Original Article
Management trajectories in the type 2 diabetes
Integrated Delivery System project in Taiwan:
accounting for behavioral therapy, nutrition
education and therapeutics
Hsing-Yi Chang
DrPH1, Mark L. Wahlqvist
MD1,2,3, Wen-Ling Liu
MS1,
Meei-Shyuan Lee
DrPH2,3, Shyi-Jang Shin
MD, PhD4,Yu-Sheng Li
MS1,
Chih-Jen Chang
MD5, Chwen-Tzuei Chang
MD6, Mao-Tsu Fuh
MD, PhD7,
Hung-Jen Yang
MD, MPH8, Tong-Yuan Tai
MD, PHD9, Chih-Cheng Hsu
MD DrPH11Division of Preventive Medicine and Health Services Research, National Health Research Institutes, Miaoli
County, Taiwan,
2School of Public Health, National Defence Medical Center, Taipei, Taiwan,
3Asia Pacific Health and Nutrition Centre, Monash Asia Institute, Monash University, Australia
4Division of Endocrinology and Metabolism, Department of Internal Medicine, Kaohsiung Medical
Univer-sity Hospital, Kaohsiung city, Taiwan
5Department of Family Medicine, National Cheng Kung University Hospital, Tainan, Taiwan 6Department of Internal Medicine, China Medical University Hospital, Taichung City, Taiwan
7Division of Metabolism, Department of Internal Medicine, China Medical University, Taichung city, Taiwan 8Mission Care Health System, Min Shen General Hospital, Taoyuan, Taiwan
9Taipei Jen Chi Relief Institution, Taipei, Taiwan
Background and aim: Glycated hemoglobin (HbA1c) assessment is basic to diabetes management. Little is done to describe the whole spectrum of the trajectory, its related temporal patterns of metabolic indices, and comor-bidities. Methods and Results: This was a longitudinal study. In the Diabetes Management through Integrated De-livery System project in Taiwan, enrollees had diabetes, but no major comorbidities. They were randomized into intensive or conventional education (health, diet and exercise) groups. HbA1c was classified by a group-based trajectory model on the basis of repeated six-monthly measurements. We analyzed data from 1091 subjects who had at least two measurements on HbA1c. HbA1c exhibited three distinct ranges of low (4253 mmol/mol), inter -mediate (64-75 mmol/mol) and high (97 mmol/mol), all of which persisted for 4.5 years regardless of receiving intensive education or not. Temporal changes and a time-group interaction were found for triglycerides, total cholesterol, HDL-C and LDL-C. The high trajectory was associated with the major co-morbidities of retinopathy, nephropathy, neuropathy, stroke, hypoglycemia, and ketoacidosis. Patients in the intensive education group (62.4%), which were equally distributed in the three trajectories, had significantly lower HbA1cs (-0.14%= -1.5 mmol/mol, p=0.026). The intermediate trajectory patients with intensive education had HbA1cs higher than the low trajectory patients with conventional education (=0.189, p=0.033). Though not significant, a similar pattern was found for DM education in the high group (=0.223, p=0.154). Conclusions: Novel strategies beyond current education and pharmacotherapeutic regimens are needed to lower HbA1c at least 11 mmol/mol for the high HbA1c group to minimize comorbidities.
INTRODUCTION
Diabetes severity is appre-ciable in Taiwan, among the five leading causes of death since 19831 with in-creasing prevalence and high mortality.2 The
gly-cated hemoglobin
(HbA1c) has been found to be 6518 mmol/mol in Taiwanese with diabetes, over half having an HbA1c>57 mmol/mol.3 In 230 diabetes centers in Asia, the HbA1c was
7022 mmol/mol
(N=18211) and 55% of
patients had an
HbA1c>44 mmol/mol, which indicates poor gly-
Corresponding Author: Dr
Chih-Cheng Hsu, Division of Preventive Medicine and Health Services Research, In-stitute of Population Health Sciences, National Health Research Institutes, Zhunan, Miaoli County, 35053 Tai-wan.
Tel: 886-37-246166 ext. 36336; Fax: 886-37-586261 Email: cch@nhri.org.tw Manuscript received 14 Feb-ruary 2014. Initial review completed 13 March 2014. Revision accepted 26 April 2014.
doi:
10.6133/apjcn.2014.23.4.06 cemic control across this region.4
Intensive glycemic con-trol has been studied ex-tensively. Type 2 diabetes patients treated with mul-tiple insulin injections have less retinopathy and nephropathy than those with conventional insulin injections for 6 years5; while intensive treatment is associated with higher all-cause mortality.6 Hy-poglycemia has been con-sidered a reason for the higher mortality at the lower glycemic end.7 Yet, intensive blood glucose control results in no re-duction in major macrovascular events, al-though it does in mi-crovascular events, mani-fested mainly as nephropathy.8 Neverthe-less, long-term benefits of intensive control on dia-betes have been observed. At the beginning, we re-cruited 1223 patients with DM in 36 clinics. We deleted 1 person for un-certain diabetes diagnosis, 121 persons with labora-tory data less than 2 times, 10 patients from small clinics (each recruited less than 5 patients). Finally, 1091 patients with at least 2 measures on HbA1c
were included in the study.
To minimize complica-tions of diabetes, multi-factorial intervention has been used. In a random-ized trial, with intensive treatment more tied to goals, the onsets of nephropathy and retinopa-thy were delayed during 3 years follow-up.12 After that, both patients re-ceived standard treatment, and those treated inten-sively remained at a lower risk of cardiovascular events and mortality for another 5 years.11 How-ever, a Cochrane system-atic review and meta-anal-ysis found no improve-ment in all-cause mortal-ity with intensive therapy or conclusive evidence for macrovascular or mi-crovascular end-points, while severe hypo-glycemic episodes were increased by 30%.13
Most studies of glycemic control use base-line data to predict out-comes. Few have de-scribed the trajectories of the chosen glycemic indi-cator. In this study, we first identified the HbA1c trajectories in diabetes pa-tients managed by Tai-wanese community-based clinics. Then, we assessed the temporal changes in related metabolic indices in regard to the defined trajectory clusters of HbA1c. Finally, we evalu-ate whether intensive edu-cation overcomes trajec-tory clusters.
MATERIAL AND
METHODS Participants
Subjects were enrolled in the Diabetes Management through the Integrated De-livery System (DMIDS) project (NCT00288678 ClinicalTrial.gov) which was granted ethics ap-proval by the Institutional
Review Board of National Health Research Insti-tutes. Informed consent was obtained to link health insurance claim data from the Bureau of National Health Insurance (BNHI) to the study. Only those subjects who pro-vided consent forms were included in the study.
The project aimed to in-vestigate the effectiveness of randomized educational interventions and case management for type 2 di-abetes in community-based clinics.14 Teaching hospitals in northern, cen-tral and southern Taiwan were chosen as the study centers. They recruited 36 local clinics between Au-gust 2003 and December 2005. The intervention lasted until December 2008. All patients treated in the collaborating clinics were eligible except (i) age < 30 or > 70 years; (ii) type 1 diabetes; (iii) women with gestational diabetes; and (iv) those with major complications of diabetes. Participants were randomized into conventional or intensive education groups. The conventional group con-tinued their routine care, whereas the intensive edu-cation group received in-struction on self-monitor-ing glucose, medication, exercises, diet control, foot care, and complica-tion management from a qualified health manager who had a diabetes shared-care license. How-ever, some clinics already practiced intensive educa-tion. We asked the partici-pants if they received in-tensive education. Study variables
Baseline demographic characteristics included family history of diabetes, smoking, betel nut chew-ing, alcohol drinkchew-ing, and
disease history. At base-line and every 6 months, a medical history, behav-ioral and nutritional as-sessments, a physical check-up and blood sam-ples were obtained.
Weight and height were measured at each visit. Body mass index (BMI) was calculated (kg/m2). Waist circumference (WC) was measured at the midpoint between the lowest rib and the iliac crest. Blood pressure (BP) was the mean of three re-peats measured with a
mercury
sphygmo-manometer after partici-pants sat for at least 10 min.
Fasting venous blood was collected. All blood and urine specimens in 2-8 °C containers were ex-press transported to a cen-tral laboratory. HbA1c was assayed by HPLC (Variant II; Bio-Rad Lab-oratories, Hercules, CA, USA). Fasting blood glu-cose, triglycerides (TG), total cholesterol, and high-density lipoprotein cholesterol (HDL-C) were analyzed by an automatic analyzer. The average in-tra-assay and inter-assay coefficients of variation for all analytes were all <5%. The urine albumin to creatinine ratio (ACR) was calculated.14 Glomerular filtration rate (GFR), was calculated as 186.3 × (creatinine-1.54) × (age-0.203) × 1.227 × (men: 1; women: 0.742).15
The BNHI data were linked to DMIDS. We ex-tracted information on medication which in-cluded medication 1 year prior to study entry and at the last observation point. The BNHI allows 3-month prescriptions for chronic diseases, which determined the medication analysis intervals.
Complications and their corresponding ICD-9-CM codes were as follows: for acute complications: (a) hypoglycemia (251.1 or 251.2); and (b) ketoaci-dosis (250.1); for chronic complications: (a) periph-eral circulatory disorders (2507), gangrene (7854, 0400, 4402), amputation (885, 886, 887, 895, 896, 897), or surgery (841); (b) retinopathy (361, 362, 2505) or blindness (369); (c) nephropathy (580, 581, 582, 583, 590, 2504) or kidney failure (584, 585, 586, 588); (d) neuropathy (250.6); (e) ischemic heart disease (410, 411, 412, 413, 414); and (f) stroke (430-438).
Statistical methods We used the group-based trajectory model, which combines the methods for finite mixture models and cluster analysis with lon-gitudinal data, to identify the patterns of HbA1c. The model classifies indi-viduals into clusters with similar trajectories ac-cording to the longitudinal data of individuals, as-suming that individual dif-ferences in trajectories can be summarized by a finite set of different polynomial functions for age or time by an SAS macro (http://www.andrew.c- mu.edu/user/bjones/in-dex.htm).16 The Bayesian information criterion (BIC) was used to select the optimal model.17
Then we examined the temporal patterns of other indices for diabetes man-agement, including BMI, WC, blood lipids, ACR, GFR, and BP, based on the classified HbA1c tra-jectory groups. The base-line characteristics among groups were compared us-ing ANOVA or chi-square tests. The temporal pat-terns among groups were
compared using multivari-ate analysis (GENMOD) to account for the nature of repeated measurements. The effect of intensive ed-ucation was compared ac-counting for possible con-founders as well as clus-ters of trajectories. The changes in medication be-tween various time points were compared using Cochran’s Q test. We also compared the diabetic complications among groups using a propor-tional-hazards model con-trolling for age and BMI. All analyses were carried out using SAS version 9.
RESULTS
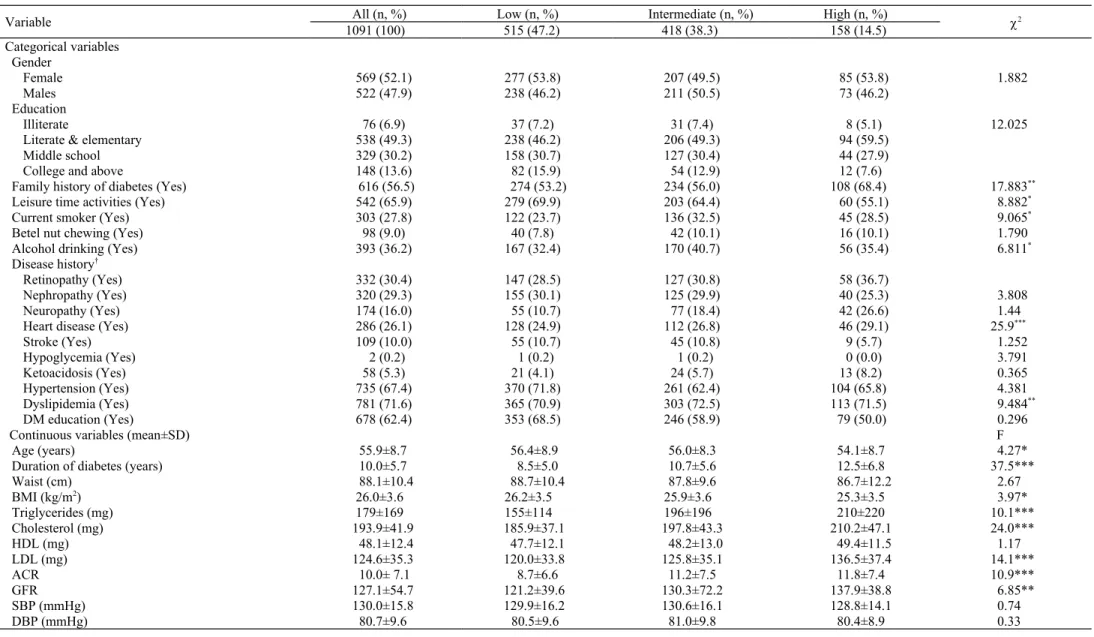
There were 1223 subjects recruited. We excluded those with missing data. One site in eastern Taiwan dropped out of the study several months after study initiation; its patients were excluded. Individuals with at least two repeated mea-surements of HbA1c were included. This left 1091 eligible participants for analysis. The average fol-low-up time was 4.5 years. Their baseline char-acteristics are shown in Table 1. The participants were 55.98.7 years old with a mean duration of follow-up of 5.15.6 years. More than half (56.5%) had a family his-tory of diabetes. Around 27.8% reported smoking, 9.0% chewing betel nuts, and 36.2% drinking alco-hol. Regarding comorbidi-ties, 30.4%, 29.3% and 16.0% had retinopathy, nephropathy, and neu-ropathy, respectively. Also at entry, 67.4% had hypertension, 71.6% dys-lipidemia, 26.1% heart diseases, and 10.0% stroke, but very few had
experienced
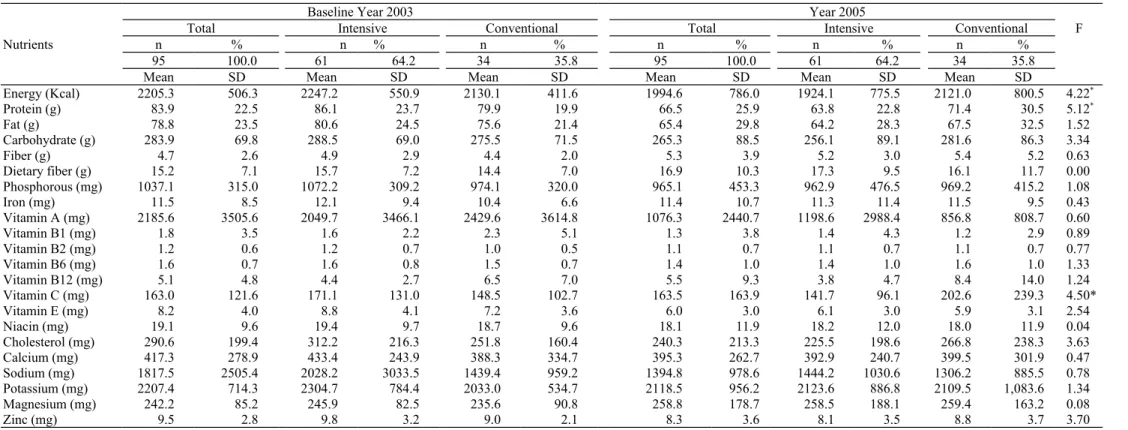
hypo-glycemia or ketoacidosis. Nutrient intakes for a sub-set of participants are
shown in Table 2. ANOVA for repeated measure was used to ex-amine the change over time as well as treatment effects. The results indi-cated that, with intensive dietary education, energy intakes were reduced, but at the expense of reduced nutritional quality as judged by changes in pro-tein (-5.1 g/1000kcals) and vitamin C (-2.5 mg/1000kcals) nutrient densities.
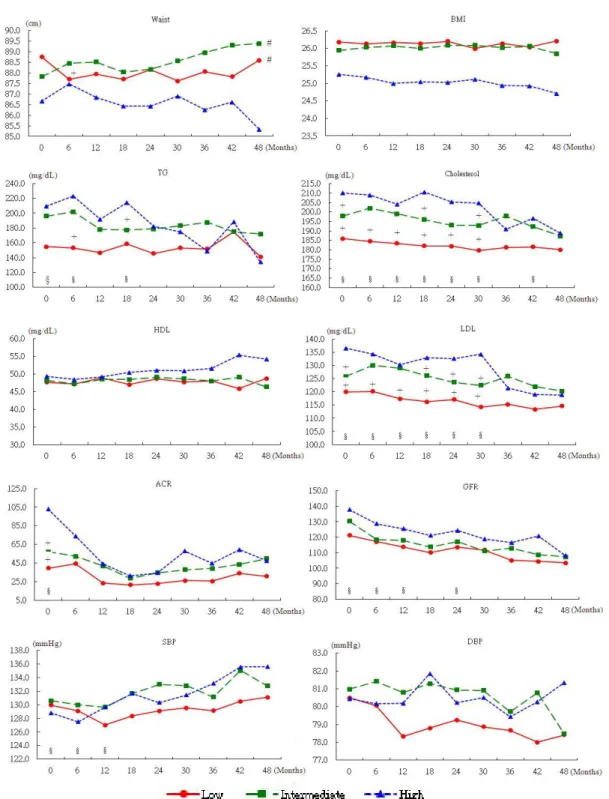
The group-based trajec-tory model clearly sepa-rated patients into three groups (Figure 1A); 47.2% of them had HbA1c around 42-53 mmol/mol (low), 38.3% with HbA1c around 64-75 mmol/mol (intermediate), and the rest with HbA1c around 97 mmol/mol (high) in the follow-up pe-riod (BIC=-10738.9 for number of observations and -10728.5 for number of subjects; the real BIC fell in between). There were no differences in gender or education pro-files among the three HbA1c groups. The group with the highest HbA1c was younger; had a longer duration of diabetes; less physically active; a higher proportion with family history of diabetes; more neuropathy; higher TG, cholesterol, LDL, ACR and GFR; and a lower BMI than their counter-parts at baseline (Table 1). The temporal changes of other management in-dices are plotted in Figure 1B. A multivariate model assuming first-order au-toregressive error was used to test the time trends, group differences and time-group interac-tions of each variable. Those statistically signifi-cant are identified. Both low and intermediate groups had significantly
lower WC and higher ACR than the high group. Significant time differ-ences were observed in TG, cholesterol, LDL, GFR, and SBP. Time– group interactions ap-peared in WC, TG, cholesterol, LDL, and ACR, meaning that the changes in different groups differed over time. In the high group, more were on insulin, biguanides, sulfonylureas, thiazolidinediones, or -glucosidase inhibitors, but this was not the case for statins (Table 3). A simi-lar pattern was found at the last time point. The use of each medication in the entire study population increased over time, ex-cept for biguanides and statins. Over 80% partici-pants were prescribed two medications. Proportions of patients using two or three medications in-creased by the last time point. About 65% of the high group were pre-scribed three or more medications.
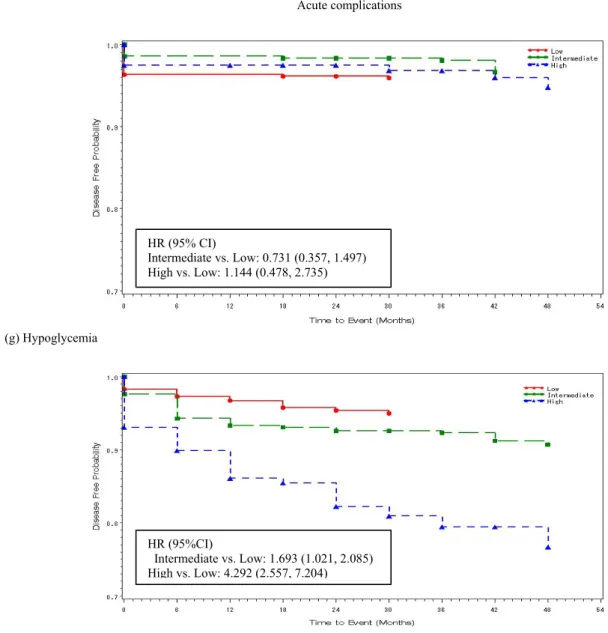
The incidences of com-plications among the three HbA1c groups are plotted in Figure 2. Significant differences existed among the groups for the devel-opment of retinopathy, nephropathy, neuropathy, stroke and ketoacidosis. Most of these complica-tions showed lower inci-dences in the intermediate trajectory group and high incidences in the high tra-jectory group compared with the low group after controlling for age and BMI.
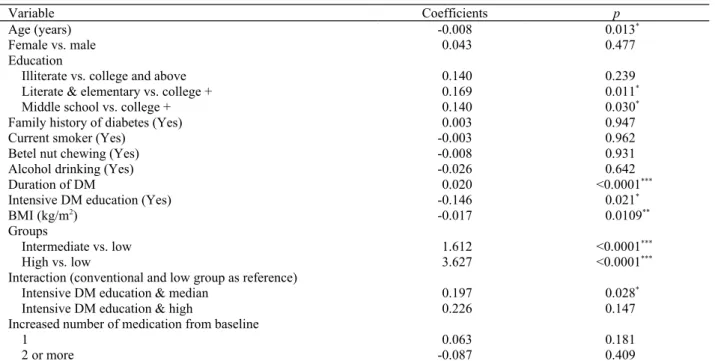
Patients with a lower education or a longer du-ration of diabetes were more likely to be in the higher HbA1c group con-trolling for other factors (Table 4). Conversely, older age and a higher BMI were correlated with
a lower HbA1c. Patients in the intensive education group (62.4%), which were equally distributed in the three trajectories, had significantly lower HbA1cs (-0.14%=-1.54 mmol/mol, p=0.026). Even so, the intermediate trajectory patients with in-tensive education still had HbA1cs higher than the low trajectory patients with conventional educa-tion (=0.189, p=0.033). Though not significant, a similar pattern was found for DM education in the high group (=0.223,
p=0.154).
DISCUSSION
We demonstrated persis-tence of HbA1c status in diabetes care in local clin-ics engaged in a project to enhance diabetes manage-ment in Taiwan. Those who started with lower HbA1cs stayed low, and those who started with higher values stayed high for 4.5 years. The pattern persisted even to the end of 2012 (9 years) (Appen-dix 1). This phenomenon possibly may be regarded as a form of “metabolic memory”.18
Long-term effects of lowering HbA1c have been reported previously. However, little informa-tion has been available about HbA1c trajectory, interventions and out-comes. Lind and col-leagues estimated the cor-relation coefficients from the same individuals for different time intervals and found the correlation coefficients differed little for up to 4 years. Later, they used the same method to identify the time effect of HbA1c and found that values from 2-3 or even 5 years prior made a greater contribution to the prediction of contem-porary progression of
retinopathy than did the current values.21 This per-sistence supports our
find-ings. The trajectory analy-sis makes the
Table 1. Comparison of characteristics of the three HbA1c group participants in the DMIDS study at entry
Variable All (n, %) Low (n, %) Intermediate (n, %) High (n, %) 2
1091 (100) 515 (47.2) 418 (38.3) 158 (14.5) Categorical variables Gender Female 569 (52.1) 277 (53.8) 207 (49.5) 85 (53.8) 1.882 Males 522 (47.9) 238 (46.2) 211 (50.5) 73 (46.2) Education Illiterate 76 (6.9) 37 (7.2) 31 (7.4) 8 (5.1) 12.025
Literate & elementary 538 (49.3) 238 (46.2) 206 (49.3) 94 (59.5)
Middle school 329 (30.2) 158 (30.7) 127 (30.4) 44 (27.9)
College and above 148 (13.6) 82 (15.9) 54 (12.9) 12 (7.6)
Family history of diabetes (Yes) 616 (56.5) 274 (53.2) 234 (56.0) 108 (68.4) 17.883**
Leisure time activities (Yes) 542 (65.9) 279 (69.9) 203 (64.4) 60 (55.1) 8.882*
Current smoker (Yes) 303 (27.8) 122 (23.7) 136 (32.5) 45 (28.5) 9.065*
Betel nut chewing (Yes) 98 (9.0) 40 (7.8) 42 (10.1) 16 (10.1) 1.790
Alcohol drinking (Yes) 393 (36.2) 167 (32.4) 170 (40.7) 56 (35.4) 6.811*
Disease history†
Retinopathy (Yes) 332 (30.4) 147 (28.5) 127 (30.8) 58 (36.7)
Nephropathy (Yes) 320 (29.3) 155 (30.1) 125 (29.9) 40 (25.3) 3.808
Neuropathy (Yes) 174 (16.0) 55 (10.7) 77 (18.4) 42 (26.6) 1.44
Heart disease (Yes) 286 (26.1) 128 (24.9) 112 (26.8) 46 (29.1) 25.9***
Stroke (Yes) 109 (10.0) 55 (10.7) 45 (10.8) 9 (5.7) 1.252 Hypoglycemia (Yes) 2 (0.2) 1 (0.2) 1 (0.2) 0 (0.0) 3.791 Ketoacidosis (Yes) 58 (5.3) 21 (4.1) 24 (5.7) 13 (8.2) 0.365 Hypertension (Yes) 735 (67.4) 370 (71.8) 261 (62.4) 104 (65.8) 4.381 Dyslipidemia (Yes) 781 (71.6) 365 (70.9) 303 (72.5) 113 (71.5) 9.484** DM education (Yes) 678 (62.4) 353 (68.5) 246 (58.9) 79 (50.0) 0.296
Continuous variables (mean±SD) F
Age (years) 55.9±8.7 56.4±8.9 56.0±8.3 54.1±8.7 4.27*
Duration of diabetes (years) 10.0±5.7 8.5±5.0 10.7±5.6 12.5±6.8 37.5***
Waist (cm) 88.1±10.4 88.7±10.4 87.8±9.6 86.7±12.2 2.67 BMI (kg/m2) 26.0±3.6 26.2±3.5 25.9±3.6 25.3±3.5 3.97* Triglycerides (mg) 179±169 155±114 196±196 210±220 10.1*** Cholesterol (mg) 193.9±41.9 185.9±37.1 197.8±43.3 210.2±47.1 24.0*** HDL (mg) 48.1±12.4 47.7±12.1 48.2±13.0 49.4±11.5 1.17 LDL (mg) 124.6±35.3 120.0±33.8 125.8±35.1 136.5±37.4 14.1*** ACR 10.0± 7.1 8.7±6.6 11.2±7.5 11.8±7.4 10.9*** GFR 127.1±54.7 121.2±39.6 130.3±72.2 137.9±38.8 6.85** SBP (mmHg) 130.0±15.8 129.9±16.2 130.6±16.1 128.8±14.1 0.74 DBP (mmHg) 80.7±9.6 80.5±9.6 81.0±9.8 80.4±8.9 0.33
†All diseases were extracted from the NHI database. * 0.01 ≤ p < 0.05;** 0.001 ≤ p < 0.01; *** p < 0.001.
Table 2. Comparisons on nutrient intakes between intensive and conventional DM educations
Nutrients
Baseline Year 2003 Year 2005
Total Intensive Conventional Total Intensive Conventional F
n % n % n % n % n % n %
95 100.0 61 64.2 34 35.8 95 100.0 61 64.2 34 35.8
Mean SD Mean SD Mean SD Mean SD Mean SD Mean SD
Energy (Kcal) 2205.3 506.3 2247.2 550.9 2130.1 411.6 1994.6 786.0 1924.1 775.5 2121.0 800.5 4.22* Protein (g) 83.9 22.5 86.1 23.7 79.9 19.9 66.5 25.9 63.8 22.8 71.4 30.5 5.12* Fat (g) 78.8 23.5 80.6 24.5 75.6 21.4 65.4 29.8 64.2 28.3 67.5 32.5 1.52 Carbohydrate (g) 283.9 69.8 288.5 69.0 275.5 71.5 265.3 88.5 256.1 89.1 281.6 86.3 3.34 Fiber (g) 4.7 2.6 4.9 2.9 4.4 2.0 5.3 3.9 5.2 3.0 5.4 5.2 0.63 Dietary fiber (g) 15.2 7.1 15.7 7.2 14.4 7.0 16.9 10.3 17.3 9.5 16.1 11.7 0.00 Phosphorous (mg) 1037.1 315.0 1072.2 309.2 974.1 320.0 965.1 453.3 962.9 476.5 969.2 415.2 1.08 Iron (mg) 11.5 8.5 12.1 9.4 10.4 6.6 11.4 10.7 11.3 11.4 11.5 9.5 0.43 Vitamin A (mg) 2185.6 3505.6 2049.7 3466.1 2429.6 3614.8 1076.3 2440.7 1198.6 2988.4 856.8 808.7 0.60 Vitamin B1 (mg) 1.8 3.5 1.6 2.2 2.3 5.1 1.3 3.8 1.4 4.3 1.2 2.9 0.89 Vitamin B2 (mg) 1.2 0.6 1.2 0.7 1.0 0.5 1.1 0.7 1.1 0.7 1.1 0.7 0.77 Vitamin B6 (mg) 1.6 0.7 1.6 0.8 1.5 0.7 1.4 1.0 1.4 1.0 1.6 1.0 1.33 Vitamin B12 (mg) 5.1 4.8 4.4 2.7 6.5 7.0 5.5 9.3 3.8 4.7 8.4 14.0 1.24 Vitamin C (mg) 163.0 121.6 171.1 131.0 148.5 102.7 163.5 163.9 141.7 96.1 202.6 239.3 4.50* Vitamin E (mg) 8.2 4.0 8.8 4.1 7.2 3.6 6.0 3.0 6.1 3.0 5.9 3.1 2.54 Niacin (mg) 19.1 9.6 19.4 9.7 18.7 9.6 18.1 11.9 18.2 12.0 18.0 11.9 0.04 Cholesterol (mg) 290.6 199.4 312.2 216.3 251.8 160.4 240.3 213.3 225.5 198.6 266.8 238.3 3.63 Calcium (mg) 417.3 278.9 433.4 243.9 388.3 334.7 395.3 262.7 392.9 240.7 399.5 301.9 0.47 Sodium (mg) 1817.5 2505.4 2028.2 3033.5 1439.4 959.2 1394.8 978.6 1444.2 1030.6 1306.2 885.5 0.78 Potassium (mg) 2207.4 714.3 2304.7 784.4 2033.0 534.7 2118.5 956.2 2123.6 886.8 2109.5 1,083.6 1.34 Magnesium (mg) 242.2 85.2 245.9 82.5 235.6 90.8 258.8 178.7 258.5 188.1 259.4 163.2 0.08 Zinc (mg) 9.5 2.8 9.8 3.2 9.0 2.1 8.3 3.6 8.1 3.5 8.8 3.7 3.70
Table 3. Proportions of uses and changes of medications for diabetes or lipids in the three HbA1c trajectory groups.
Medication All (n, %) Low (n, %) Median (n, %) High (n, %) 2
Medication type
1 year before study entry
Insulin 58 (5.3) 16 (3.1) 25 (6.0) 17 (10.8) 14.7*** Biguanides 896 (82.1) 395 (76.7) 357 (85.4) 144 (91.1) 22.1*** Sulfonylurea 990 (90.7) 438 (85.1) 396 (94.7) 156 (98.8) 39.8*** Thiazolidinedione 126 (11.6) 33 (6.4) 64 (15.3) 29 (18.4) 26.3*** -Glucosidase Inhibitors 66 (6.1) 23 (4.5) 26 (6.2) 17 (7.8) 8.46** Statin 409 (37.5) 201 (39.0) 163 (39.0) 45 (28.5) 6.40*
Between 3 month before and 4.5 years after study entry
Insulin 129 (11.8)*** 24 (4.7) 55 (13.1)*** 50 (31.7) *** 85.6*** Biguanide 923 (84.6) 406 (78.8) 375 (89.9) 142 (89.9) 24.9*** Sulfonylurea 933 (85.5)*** 421 (81.8) 369 (88.3) *** 143 (90.5) ** 11.7** Thiazolidinedione 224 (20.5)*** 65 (12.6)*** 117 (28.0) *** 42 (26.6) 37.5*** -Glucosidase inhibitor 169 (15.5)*** 55 (10.7)*** 76 (18.2)*** 38 (24.1) ** 20.3** Statin 417 (38.2) 202 (39.2) 154 (36.8) 61 (38.6) * 6.40* Number of medications† 1 year before study entry
Any one 1076 (98.6) 503 (97.7) 415 (99.3) 158 (100) 7.00*
Any two 906 (83.0) 390 (75.7) 367 (87.8) 149 (94.3) 40.5***
3 or more 441 (40.2) 180 (35.0) 191 (45.7) 70 (44.3) 12.2**
Between 3 months before and 4.5 years after study entry
Any one 1074 (98.4) 503 (97.7) 415 (99.3) 158 (100.) 8.58*
Any two 943 (86.4) 409 (79.4) 385 (92.1) 149 (94.3) 41.4***
3 or more 541 (49.6) 200 (38.8) 239 (57.2) 102 (64.6) 47.6***
* 0.01 ≤ p < 0.05, ** 0.001 ≤ p < 0.01, *** p < 0.001 for comparing differences among groups using overall chi-squared test.
Table 4. Factors associated with HbA1c in the three groups, accounting for temporal effects.
Variable Coefficients p
Age (years) -0.008 0.013*
Female vs. male 0.043 0.477
Education
Illiterate vs. college and above 0.140 0.239
Literate & elementary vs. college + 0.169 0.011*
Middle school vs. college + 0.140 0.030*
Family history of diabetes (Yes) 0.003 0.947
Current smoker (Yes) -0.003 0.962
Betel nut chewing (Yes) -0.008 0.931
Alcohol drinking (Yes) -0.026 0.642
Duration of DM 0.020 <0.0001***
Intensive DM education (Yes) -0.146 0.021*
BMI (kg/m2) -0.017 0.0109**
Groups
Intermediate vs. low 1.612 <0.0001***
High vs. low 3.627 <0.0001***
Interaction (conventional and low group as reference)
Intensive DM education & median 0.197 0.028*
Intensive DM education & high 0.226 0.147
Increased number of medication from baseline
1 0.063 0.181
2 or more -0.087 0.409
* 0.01 ≤ p< 0.05; ** 0.001 ≤ p < 0.01; *** p < 0.001
Figure 1A. Trajectories of HbA1c. The solid line is the average observed value, whereas the dashed line is the average estimated value after grouping
Figure 1B. Temporal changes of the diabetes related indices based on the three groups
#indicates group difference. The high group is the reference group.§ indicates time difference. The 48 month value is the reference value. indicates group × time interaction. The high group and the 49 month value is the reference.
Chronic complications (a) Retinopathy (b) Nephropathy (c) Neuropathy HR (95% CI) Intermediate vs. Low: 1.038 (0.870, 1.239) High vs. Low: 1.309 (1.037, 1.625) HR (95% CI) Intermediate vs. Low: 1.324 (1.061, 1.652) High vs. Low: 1.507 (1.119, 2.029) HR (95%CI): Intermediate vs. Low: 2.231 (1.683, 2.958) High vs. Low: 3.366 (2.419, 4.685)
(d) Gangrene
(e) Ischemic heart diseases
(f) Stroke HR (95% CI) Intermediate vs. Low: 1.298 (0.669, 2.522) High vs. Low: 1.978 (0.895, 4.372) HR (95% CI) Intermediate vs. Low: 0.862 (0.662, 1.121) High vs. Low: 1.281 (0.992, 1.781) HR (95% CI) Intermediate vs. Low: 1.601 (1.070, 2.396) High vs. Low: 2.067 (1.227, 3.484)
Acute complications
(g) Hypoglycemia
(h) Ketoacidosis
Figure 2. Comparisons of incidence of comorbidities among the three groups. All hazard ratios (HR) were adjusted for age and BMI. HR (95% CI) Intermediate vs. Low: 0.731 (0.357, 1.497) High vs. Low: 1.144 (0.478, 2.735) HR (95%CI) Intermediate vs. Low: 1.693 (1.021, 2.085) High vs. Low: 4.292 (2.557, 7.204)
simultaneous analysis of classification and trajectory pos-sible. We believe ours is the first attempt to describe time trends in HbA1c and to find them to be relatively persis-tent.
Dietary intake advice was the major part of DM educa-tion. Whether this was intensive or usual education is known for all participants. However, detailed food records were not routinely kept and those available were expressed in nutrient terms for the DMIDS project. Inso-far as these data allow, we can say that with the ‘best di-etary education’ total energy, protein and vitamin C in-takes were reduced, so that there was no identifiable im-provement in dietary quality (Table 2). Thus, it is con-ceivable that an achieved reduction in energy intake has been misinterpreted as success when it has compromised dietary quality, now known to be important not just in re-gard to glycaemic control, but also the likelihood of com-plications. Therefore, the current approach to dietary management may itself be a contributor to the inability to change the trajectories of glycaemic control and of com-plication rates.22
Progression of indicators Body composition
Often, weight loss is welcomed in management of type 2 diabetes, but here it occurred with poor glycemic control reflected in persistently elevated HbA1c levels. It would be expected that the phenomena usually seen with hyper-glycemia, namely osmotic diuresis and muscle break-down with excessive gluconeogenesis from amino acids, leading to sarcopenia, would explain the weight and BMI findings here. Nevertheless, WC decreased as well, which, if it represents a reduction in abdominal obesity, is likely to be a favorable contributor to the weight change alongside unfavorable body compositional changes.
A weight trajectory study in diabetes concluded that weight loss, possibly some fat loss, at the time of diagno-sis was an important predictor of future glycemic con-trol.23 We looked at this from a different angle. Our study took a longer-term perspective of weight loss in type 2 diabetes with worse HbA1c, which, if recognized early, might alert to opportunities to maintain a healthier body composition.
Lipoproteins
In the Taiwanese general population, higher TG are associated with relatively higher HDL-C than in Caucasians. Lipoprotein susceptibility to a high glycemic trajectory may be different in this population, and the quality of the higher HDL-C may be more reflective of a chronic inflammatory state than of more effective reverse cholesterol transport from atherosclerosis-vulnerable arteries. “Bad” HDL-C is found in various inflammatory disease states.24 The rise in HDL-C may not represent less cardiovascular risk in this situation. The steady-state LDL-C in this study may represent a form of resistance or adaptation to persistent glycemic trajectories in each stratum.
Blood pressure
The trajectories of SBP and DSP were dissociated, with that for SBP projecting upwards for all glycemic
trajecto-ries and that for DBP remaining unchanged. The re-sponses among our study subjects may not be generaliz-able to other populations because of differences in the prevalence of these two forms of hypertension. Studies have observed that elevated diastolic BP being more common than elevated systolic BP in Chinese Taiwanese compared to their prevalence in Caucasians. This dissoci-ation may signal general difficulty in patient adherence to low sodium: potassium ratio diets in Taiwan, which would accentuate this problem with time.27
Persistent glycemic trajectories
The term “metabolic memory” has been used to describe the situation in which glycemic control at the early stage of the disease could persist for a long time.28 Much focus has been placed on the negative effects of non-intensive treatment at early stages.29 In turn, a diversity of “memo-ries” may allow or disallow one complication compared with another, as appears to be the case in our various glycemic trajectories. In our study, glycemic trajectory predicted the development of nephropathy. Whatever the underlying glycemic disorder, early intensive glycemic control at its high end is warranted.6-8
Use of pharmaceuticals
There was greater use of both insulin and oral anti-hyper-glycemic medications of all types used in Taiwan in the high trajectory patients (Table 2). Where there was use of only one or two medications, this did not change much over time, whereas the use of three medications increased slightly in the intermediate and high groups. It seems that physicians were satisfied with keeping patients at a stable HbA1c level, instead of lowering it. Some have identified a reluctance of physicians to increase medication usage in diabetes management, which they have termed “physi-cian inertia”.30
We found that total cholesterol decreased and HDL-C increased with time in the high trajectory group. This raises the possibility that there is a lipoprotein-metabolic phenomenon operating in this group. We have considered that weight loss might have accounted for the fall in total cholesterol, but LDL did not differ among the groups or change with time. This leaves us with reciprocal changes between VLDL-TG and HDL-C (Figure 1B). These are favorable changes by current convention (although the literature now refers to “bad” HDL). Perhaps it is because the use of all oral anti-hyperglycemic agents and insulin have increased with time and been lipid-favorable. Alter-natively, sustained high glycemic status may induce com-pensatory and CVD risk---favorable changes in lipopro-tein status.
Factors associated with HbA1c level
The differences in education level implied people with higher education took better care of themselves. In addi-tion, those who received intensive education had lower HbA1c levels. The magnitude of the trajectory group dif-ference in HbA1c was around 2%; but education inter-vention could only account for < 0.2% HbA1c, which would not move patients from the high to a lower group. It is clear that prevalent and multiple drug therapy with oral anti-hyperglycemic agents or insulin does little for
those with the high HbA1c trajectory over a period of 4.5 years. Thus, while the potential value of avoidance of the high glycemic trajectory, through early and effective management, is evident, present measures are not able to realize this goal. Changing diet has been difficult, even it has been the major lifestyle intervention on DM. Even though most of DM patients claimed they practice diet control, 31 their actual dietary intakes might not meet the standard. Creative and easily implemented ways in diet control are needed.
Limitations
Patients recruited were not necessarily newly diagnosed; however, they did not have major diabetes complications at entry. Nevertheless, newly diagnosed subjects often present with conditions other than diabetes and where there has been a delay in diagnosis so that they may not be very different from our study population. This is espe-cially so since patients treated in local or community clin-ics are considered less severe and more stable than those in regional hospitals or medical centers. However, within about 4.5 years, we observed the emergence of diabetes complications and more so in patients in the high HbA1c group. A longer period of follow-up might have changed the picture of HbA1c persistence and its relevance, most likely towards greater severity of outcomes.
The dietary records were only available in 95 patients. Among the study sites, only one site recorded the nutrient intakes. Nevertheless, the results were published for this site.22 The information of food intakes was converted to nutrients. It would be more informative if food informa-tion was available.
Our observation of stratified HbA1c persistence seems to represent inadequately developed clinical diabetes pro-grams in Taiwan for the high end of HbA1c, despite the intention that the DMIDS project represents best practice as we know it. But inadequate HbA1c trajectory control by current clinical standards is unlikely to explain persis-tence within a given stratum widely divergent from the other strata. Aside from the characteristics of clinical pro-grams or poorly understood metabolic biology as limiting for optimal glycaemic control, our findings may also rep-resent entrenched personal behaviors in a societal sec-tor.31 As for what biological explanations there might be for the stratification or its consequences it may represent a form of metabolic memory. It may also have a partial genetic, familial or epigenetic basis.32
Conclusions
Assignment to a high HbA1c group at an early stage can identify patients with diabetes whose health indicators progressively deteriorated over a period of 4.5 years, with the corollary that those in the intermediate and low HbA1c groups have persistent relative advantages. How-ever, novel strategies beyond current education and phar-macotherapeutic regimens are needed to lower HbA1c by at least 11 mmol/mol (2%) in absolute terms for the high HbA1c group to minimize comorbidities..
ACKNOWLEDGEMENTS
This study would not have been possible without the partici-pants, the assistance of Resource Development International
Cambodia, Son Channary, Son Channara and Datelyn Sampson. This study was funded by the University of Guelph and was presented orally at the 2012 Global Development Symposium on May 7th at the Ontario Veterinary College, University of Guelph. This work was supported by the University of Guelph. AUTHOR DISCLOSURES
There is no conflict of interest with any author. The correspond-ing author, Chih-cheng Hsu, has full access to all data in the study and takes responsibility for the integrity of the data and the accuracy of the data analysis. National Health Research In-stitutes provided funding for the whole study, including design and conduct; data management, analysis, and interpretation of the data; and preparation, review of the manuscript.
REFERENCES (please search doi on the
http://60.199.250.251:8080/doi/search website, and add it to the references)
1. Health and Vital Statistics: (2) Vital Statistics, Taiwan area, ROC. In: Health. Do, editor. Taipei: Department of Health, The Executive Yuan, Republic of China; 2009.
2. Chang HY, Hsu CC, Pan WH, Liu WL, Cheng JYC, Tseng CH, Bai CH, Yeh WT, Hurng BS. Gender differences in trends in diabetes prevalence from 1993 to 2008 in Taiwan. Diabetes Research and Clinical Practice. 2010.(incomplete, volume number, the beginning page and ending page?) 3. Chuang LM, Tsai ST, Huang BY, Tai TY. The current state
of diabetes management in Taiwan. Diabetes research and clinical practice. 2001;54(Suppl 1):S55-65.
4. Chuang LM, Tsai ST, Huang BY, Tai TY. The status of dia-betes control in Asia--a cross-sectional survey of 24 317 pa-tients with diabetes mellitus in 1998. Diabet Med. 2002;19:978-85.
5. Ohkubo Y, Kishikawa H, Araki E, Miyata T, Isami S, Mo-toyoshi S, Kojima Y, Furuyoshi N, Shichiri M. Intensive in-sulin therapy prevents the progression of diabetic microvas-cular complications in Japanese patients with non-insulin-dependent diabetes mellitus: a randomized prospective 6-year study. Diabetes Research and Clinical Practice. 1995;28:103-17.
6. Gerstein HC, Miller ME, Byington RP, Goff DC, Jr., Bigger JT, Buse JB et al. Effects of intensive glucose lowering in type 2 diabetes. N Engl J Med. 2008;358:2545-59.
7. Currie CJ, Peters JR, Tynan A, Evans M, Heine RJ, Bracco OL, Zagar T, Poole CD. Survival as a function of HbA(1c) in people with type 2 diabetes: a retrospective cohort study. Lancet. 2010;375:481-9.
8. Patel A, MacMahon S, Chalmers J, Neal B, Billot L, Wood-ward M et al. Intensive blood glucose control and vascular outcomes in patients with type 2 diabetes. N Engl J Med. 2008;358:2560-72.
9. Turner RC, Cull CA, Frighi V, Holman RR. Glycemic con-trol with diet, sulfonylurea, metformin, or insulin in patients with type 2 diabetes mellitus: progressive requirement for multiple therapies (UKPDS 49). UK Prospective Diabetes Study (UKPDS) Group. JAMA. 1999;281:2005-12. 10. Holman RR, Paul SK, Bethel MA, Matthews DR, Neil HA.
10-year follow-up of intensive glucose control in type 2 dia-betes. N Engl J Med. 2008;359:1577-89.
11. Gaede P, Lund-Andersen H, Parving HH, Pedersen O. Ef-fect of a multifactorial intervention on mortality in type 2 diabetes. N Engl J Med. 2008;358:580-91.
12. Gaede P, Vedel P, Parving HH, Pedersen O. Intensified multifactorial intervention in patients with type 2 diabetes mellitus and microalbuminuria: the Steno type 2 randomised study. Lancet. 1999;353:617-22.
Hemmingsen C, Wetterslev J. Intensive glycaemic control for patients with type 2 diabetes: systematic review with meta-analysis and trial sequential analysis of randomised clinical trials. BMJ (Clinical research ed.) 2011;343:d6898. 14. Hsu CC, Hwang SJ, Tai TY, Chen T, Huang MC, Shin SJ et al. Cigarette smoking and proteinuria in Taiwanese men with Type 2 diabetes mellitus. Diabet Med. 2010;27:295-302.
15. Levey AS, Bosch JP, Lewis JB, Greene T, Rogers N, Roth D. A more accurate method to estimate glomerular filtration rate from serum creatinine: a new prediction equation. Ann Intern Med. 1999;130:461-70.
16. Jones BL, Nagin DS. Advances in group-based trajectory modeling and a SAS procedure for estimating them. Socio-logical Research and Methods. 2007;35:542-71.
17. Nagin DS. Group-Based Modeling of Development. Cam-bridge, Massachusetts, USA: Harvard University Press; 2005.
18. Wright AD. Metabolic memory in type 1 diabetes. Br J Dia-betes Vasc Dis 2009;9:254-7.
19. Gore MO, McGuire DK. The 10-year post-trial follow-up of the United Kingdom Prospective Diabetes Study (UKPDS): cardiovascular observations in context. Diab Vasc Dis Res. 2009;6:53-5.
20. Nathan DM, Cleary PA, Backlund JY, Genuth SM, Lachin JM, Orchard TJ, Raskin P, Zinman B. Intensive diabetes treatment and cardiovascular disease in patients with type 1 diabetes. N Engl J Med. 2005;353:2643-53.
21. Lind M, Oden A, Fahlen M, Eliasson B. The shape of the metabolic memory of HbA1c: re-analysing the DCCT with respect to time-dependent effects. Diabetologia. 2010;53: 1093-8.
22. Huang MC, Hsu CC, Wang HS, Shin SJ. Prospective ran-domized controlled trial to evaluate effectiveness of regis-tered dietitian-led diabetes management on glycemic and diet control in a primary care setting in Taiwan. Diabetes
Care. 2010;33:233-9.
23. Feldstein AC, Nichols GA, Smith DH, Stevens VJ, Bach-man K, Rosales AG, Perrin N. Weight change in diabetes and glycemic and blood pressure control. Diabetes Care. 2008;31:1960-5.
24. Scanu AM, Edelstein C. HDL: bridging past and present with a look at the future. Faseb J. 2008;22:4044-54. 25. Saad MF, Lillioja S, Nyomba BL, Castillo C, Ferraro R, De
Gregorio M, et al. Racial differences in the relation between blood pressure and insulin resistance. N Engl J Med. 1991;324:733-9.
26. Wahlqvist ML, Chang HY, Chen CC, Hsu CC, Chang WC, Wang WS, Hsiung CA. Is impaired energy regulation the core of the metabolic syndrome in various ethnic groups of the USA and Taiwan? BMC Endocr Disord. 2010;10:11. 27. Chang HY, Hu YW, Yue CS, Wen YW, Yeh WT, Hsu LS,
Tsai SY, Pan WH. Effect of potassium-enriched salt on car-diovascular mortality and medical expenses of elderly men. Am J Clin Nutr. 2006;83:1289-96.
28. Drzewoski J, Kasznicki J, Trojanowski Z. The role of "metabolic memory" in the natural history of diabetes melli-tus. Pol Arch Med Wewn. 2009;119:493-500.
29. Engerman RL, Kern TS. Retinopathy and tissue hexose in drug-treated animals. Arch Ophthalmol. 1998;116:543-4. 30. Grant R, Adams AS, Trinacty CM, Zhang F, Kleinman K,
Soumerai SB, Meigs JB, Ross-Degnan D. Relationship be-tween patient medication adherence and subsequent clinical inertia in type 2 diabetes glycemic management. Diabetes Care. 2007;30:807-12.
31. Li CL, Lin NY, Wang HH, Hsu CC, Hurng BS, Chang HY. A population study on changes in diabetes self-care behav-iors in Taiwan between 2001 and 2005. Prev Med. 2010;50: 308-9.
32. Tonna S, El-Osta A, Cooper ME, Tikellis C. Metabolic memory and diabetic nephropathy: potential role for epige-netic mechanisms. Nat Rev Nephrol. 2010;6:332-41.
Original Article
Management trajectories in the type 2 diabetes
Integrated Delivery System project in Taiwan:
accounting for behavioral therapy, nutrition
education and therapeutics
Hsing-Yi Chang
DrPH1, Mark L. Wahlqvist
MD1,2,3, Wen-Ling Liu
MS1,
Meei-Shyuan Lee
DrPH2,3, Shyi-Jang Shin
MD, PhD4,Yu-Sheng Li
MS1,
Chih-Jen Chang
MD5, Chwen-Tzuei Chang
MD6, Mao-Tsu Fuh
MD, PhD7,
Hung-Jen Yang
MD, MPH8, Tong-Yuan Tai
MD, PHD9, Chih-Cheng Hsu
MD DrPH11Division of Preventive Medicine and Health Services Research, National Health Research Institutes,
Miaoli County, Taiwan,
2School of Public Health, National Defence Medical Center, Taipei, Taiwan,
3Asia Pacific Health and Nutrition Centre, Monash Asia Institute, Monash University, Australia
4Division of Endocrinology and Metabolism, Department of Internal Medicine, Kaohsiung Medical
Univer-sity Hospital, Kaohsiung city, Taiwan
5Department of Family Medicine, National Cheng Kung University Hospital, Tainan, Taiwan 6Department of Internal Medicine, China Medical University Hospital, Taichung City, Taiwan
7Division of Metabolism, Department of Internal Medicine, China Medical University, Taichung city,
Tai-wan
8Mission Care Health System, Min Shen General Hospital, Taoyuan, Taiwan 9Taipei Jen Chi Relief Institution, Taipei, Taiwan