行政院國家科學委員會專題研究計畫 成果報告
子計畫二:Sb-ADCP 測量台灣海峽南部之流場
計畫類別: 整合型計畫 計畫編號: NSC91-2611-M-110-014- 執行期間: 91 年 08 月 01 日至 92 年 07 月 31 日 執行單位: 國立中山大學海洋資源學系(所) 計畫主持人: 曾若玄 報告類型: 精簡報告 處理方式: 本計畫可公開查詢中 華 民 國 93 年 1 月 16 日
Sb-ADCP 測量台灣海峽南部之流場
計劃編號: NSC91-2611-M-110-014
執行期限: 91 年 8 月 1 日至 92 年 7 月 31 日
主持人: 曾若玄 中山大學海洋資源系
計劃參與人員: 張育嘉
一、中文摘要 本研究是利用三條研究船(OR1, OR2 和 OR3)於 2002 年 8 月 7 日~8 月 9 日同步觀測台灣海峽南北兩條橫向 測線的流場及水文溫鹽場,北測線是 由桃園到海壇島以 OR2 探測,南測線 分兩段,台西到澎湖以 OR3 探測,澎 湖到金門以 OR1 探測,利用各船上的 Sb-ADCP 觀測海流,並以時間差的測 線 設 計 方 式 將 全 日 和 半 日 分 潮 流 濾 除,僅餘平均淨流。研究結果顯示於 觀 測 期 間 台 灣 海 峽 內 的 海 流 皆 為 往 北,平均流速約為 50 ~ 60 cm/s,又以 澎湖水道內的流速最為強勁(最大值約 為 200 cm/s)。南測線的總流量為 3.03 Sv 往北,北測線的總流量為 2.94 Sv 往北,又從水團的溫鹽特性可知此時 期的台灣海峽是由南海往東海輸送海 水,又以澎湖水道的流量約佔了 68 % 為主。 關鍵詞:台灣海峽、潮流、流量、澎湖 水道 AbstractCurrents and hydrographic properties along two transects across the northern and southern regions of the Taiwan Strait were measured simultaneously by three research vessels during the period of 7 August – 9 August 2002. The north transect, spanning from Tao-Yuan to Hai-Tan Island, was surveyed by R/V OR2. The south
transect is divided into two segments. The eastern part, spanning from Tai-Hsi to Peng-Hu, is surveyed by R/V OR3. The western part, spanning from Peng-Hu to Kin-Men, is surveyed by R/V OR1. Shipboard ADCP of each vessel was used to observe flows. In order to remove diurnal and semidiurnal tidal flows from observed flows, three round-trip ADCP surveys with pre-designed time lags were conducted along each segment. The outflow through the Taiwan Strait, with velocity of 50 ~ 60 cm/s, was clearly observed to flow northeastward. Peak velocities can reach over 200 cm/s in the Peng-Hu Channel. The volume transport through the north and south transects was estimated to be 2.94 Sv and 3.03 Sv, respectively. A major portion (~ 68 %) of the volume transport was concentrated in the Peng-Hu Channel. Keywords: Taiwan Strait, tidal currents, volume transport, Peng-Hu Channel
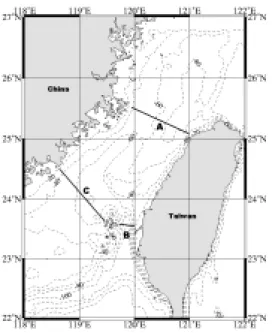
二、計劃緣由與目的 台灣海峽長 350 km,寬 180 km, 平均水深 60 m。北接擁有廣大陸棚的 東海,南通平均水深大於 2000 m 的南 海,西靠中國大陸,東臨台灣列島。 台灣與澎湖群島(圖 1)間又有平均水深 150 m 狹長漏斗狀的澎湖水道,還有平 均水深 40 m 的台灣灘與雲彰隆起。崎
嶇的地形,變換的季風,複雜的流場, 蔚為台灣屏障的台灣海峽,一直是海 洋學者積極研究的區域。
圖 1本研究的測線 A, B, C 地理位置圖 台灣海峽內存有一長年性向北的 平 均 流 (Chuang, 1985) , Tseng and Shen(2003)利用浮標,觀測海峽東邊表 層流場,亦得到海峽內持續向北的海 流。Jan et al. (2001)等利用模式配合風 場揭露,冬季海峽西邊有南下的中國 沿岸流,東邊則是沿澎湖水道北上的 黑潮。夏季則是中國沿岸流消退,東 邊以南海海水取代黑潮北上。 台灣海峽是南海與東海的重要通 道。若能得知其海水輸送量,則有助 於海洋環流、海面熱通量收支、營養 鹽 分 佈 、 物 質 交 換 等 過 程 的 瞭 解 。 Wyrtki (1961)利用水位推估台灣海峽 夏季流量 0.5 ~ 1.0 Sv 向北,冬季為 0.5 Sv 向南。Wang et al. (2003)利用船碇式 ADCP 觀測海峽流量,得到夏季流量 為 2.7 Sv,冬季流量為 0.9 Sv。Jan and Chao (2003)以船碇式 ADCP 觀測,採 相位平均法濾潮,推估澎湖水道淨流 量隨季節變化,冬季為 0 ~ 0.5 Sv,春 夏為 0.5 ~ 1.5 Sv,皆向北。 本 研 究 為 SWEET 計 劃 的 子 計 劃,SWEET 計劃結合了國內海洋界多 位學者共同探測台灣海峽的流場和水 文場,本年度所完成的一項重要成果 便 是 利用 三 條研 究船 (OR1, OR2 和 OR3)同步進行台灣海峽南北兩條測線 的觀測,藉此可以由體積守恆原理以 確定台灣海峽的流量與水團的流向。 這種觀測方法對於台灣海峽的研究是 過去所未見的,本文便是特別針對這 次聯合探測的成果提出報告。 三、觀測與分析方法 本研究的測線一共有兩條(圖 1), 北測線(測線 A)是由桃園外海到海壇 島,由海研二號負責探測,南測線分 成兩段,台西外海到澎湖(測線 B)是由 海研三號負責探測,澎湖到金門(測線 C)則是以海研一號負責探測,這三條 船於 2002 年 8 月 7 日~8 月 9 日同步進 行各測線的流場和水文測量。 為 了 能 夠 濾 除 全 日 潮 和 半 日 潮 流,每條測線皆重複觀測三次,測線 A 和 C 的相鄰兩次觀測的時間間隔為 16 小時,將這三次觀測於各點的流速資 料作平均,理論上便可濾除全日和半 日潮流,而得到平均的恆流或淨流。 類似的方法曾經被 Katoh et al. (2000) 應用於東海的流場觀測,或是被 Jan and Chao (2003)應用於澎湖水道的流 場觀測,但是和本研究所使用的方法 也有不同之處,Jan and Chao (2003)是 將兩次相隔 6 hr 12 min 30 sec 的流速 觀 測 值 平 均 , 僅 能 濾 除 半 日 潮 流 , Katoh et al. (2000)則是將四次相隔 12 hr 25 min 及四次相隔 6 hr 12 min 30
sec 的流速觀測值相平均,能夠濾除全 日和半日潮流,本文所使用的方法或 可稱為「三相法」(3 phase method)。 測線 B 由於距離短,因此所採用的相 鄰兩次觀測的時間間隔為 8 小時,三 次觀測資料的平均仍可濾除全日和半 日潮流。表 1 為測線 A, B, C 的 ADCP 觀測起始與終止時間。
表 1 Starting and finishing times of ADCP measurements on Transects A, B and C in August 2002
Transect A B C
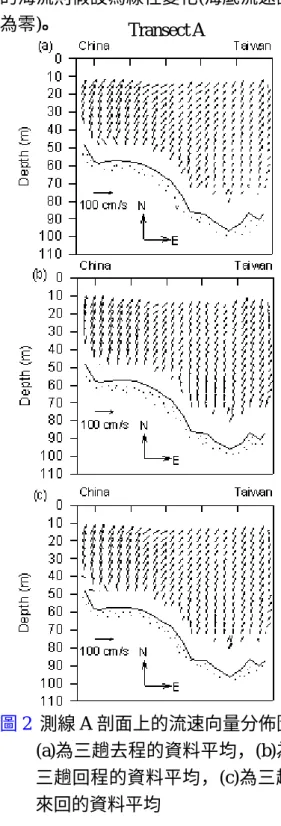
Start time August 7, 1400 August 7, 1506 August 7, 1843 Finish time August 9, 0600 August 8, 1854 August 9, 1056 三條研究船上所安裝的 ADCP 均 為美國 RDI 公司的產品,OR2 和 OR3 的 ADCP 為 75 KHz,OR1 的 ADCP 為 150 KHz,垂直間距均設定為 4 m, 最上層的流速位於水面下 10 m(OR1) 與 16.4 m(OR2 和 OR3),資料取樣間 隔均設定為 1 min。為了使流速的觀測 結果達到一定的品質,本研究僅採用 ADCP 資料品質(percent good)在 85 % 以上以及離開海底距離大於水深 15 % 之流速值。 在跑完 ADCP 測線之後的回程則 進行 CTD 的探測,測線 A 無進行 CTD 探測,測線 B 完成了七站 CTD 探測, 測線 C 完成了九站 CTD 探測。 在 ADCP 流速資料的處理過程方 面,首先將每條測線分成若干等份(測 線 A, B 和 C 分別分為 22, 12 和 18 等 份),落於每一等份之內的每層流速資 料均作空間上的平均。從水面到第一 層流速之間的海流假設等於第一層的 流速值,從最下一層流速到海底之間 的海流則假設為線性變化(海底流速設 為零)。 圖 2 測線 A 剖面上的流速向量分佈圖 (a)為三趟去程的資料平均,(b)為 三趟回程的資料平均,(c)為三趟 來回的資料平均 四、結果與討論 4.1 流場分佈 測線 A 的跑法是以定速作連續的 來回三趟,因此可以用去程(由東向西) Transect A
的三趟,回程(由西向東)的三趟以及來 回三趟的 ADCP 資料分別作平均來比 較流場分佈,圖 2 為測線 A 剖面上的 流速向量分佈圖,(a)為去程的平均, (b)為回程的平均,(c)為去程和回程的 所有資料平均,比較這三種計算方法 的結果可知,利用去程或回程的 ADCP 資料平均出來的淨流分佈均很相似, 也就是說本研究所採用的濾潮方法是 可信的,從海洋上層到底層的海流相 當 均 勻 , 流 速 和 流 向 沒 有 很 大 的 差 異,流速約為 40 ~ 60 cm/s,流向則為 0° ~ 40°,也就是從台灣海峽流向東海。 測線 B 位於澎湖水道,水深最大 約為 150 m,圖 3 為測線 B 剖面上的 流速向量分佈圖,在澎湖水道內的淨 流均為朝北,兩側的流速較小,在水 道中間的流速較強,最大流速可達 149 cm/s,表層的流速稍大於底層的流速。 由於測線 B 的回程有作 CTD 探測,因 此 只 能 利 用 去 程 ( 由 東 向 西 ) 的 三 趟 ADCP 資料平均求得淨流。 圖 3 測線 B 剖面上的流速向量分佈圖 測線 C 的回程有作 CTD 探測,因 此也只能利用去程(由東向西)的三趟 ADCP 資料平均求得淨流。圖 4 為測 線 C 剖面上的流速向量分佈圖,在靠 近澎湖群島的西邊,海流受到島嶼的 阻礙而偏轉,流向為西北,最大流速 可達 100 cm/s,在測線 C 的中間流向 為朝北,流速約為 30 ~ 40 cm/s,在靠 近大陸的那一側流向則為東北向,流 速約為 30 ~ 40 cm/s。 圖 4 測線 C 剖面上的流速向量分佈圖 圖 5 測線 A, B, C 的垂直平均之淨流 向量及流量大小 將相位平均所求得的淨流分解成 垂直和平行於測線的流速向量,再將 垂直於測線的流速乘以個別的面積後 累加,便可獲得體積流量。圖 5 為測 線 A, B, C 的垂直平均之淨流向量以及 所計算出來的流量大小。測線 A 的總 流量為 2.94 Sv,測線 B 和 C 的總流量 和為 3.03 Sv,兩者相當接近,也可符 Transect B Transect C
合體積守恆的定理。由此可知此一時 期的台灣海峽是由南海往東海輸送海 水,而通過澎湖水道的海水輸送量約 佔了總流量的 2/3。 圖 6 位密度剖面與溫鹽特性,(a)(b)為 測線 B,(c)(d)為測線 C,南海與 黑潮水用紫色與綠色表示。 4.2 溫鹽特性 測線 B 和 C 的 CTD 探測結果經過 標準的資料分析步驟,便可繪製 T-S 圖和σθ vs. Z 圖(圖 6),海水的垂直分層 非常明顯,在澎湖和金門中間海域的 表面混合層厚度約為 20 ~ 30 m,在澎 湖水道中央的混合層厚度則可達到 50 ~ 60 m,由 T-S 特性指出澎湖西方的海 水為南海水,而澎湖水道內的表層海 水部份呈現黑潮水特性,中下層的海 水則較接近南海水。綜合溫鹽特性和 流量估算的結果,本研究的主要成果 可以用下列文字來說明:在本研究的觀 測期間,屬於西南季風盛行時期(圖 7),高溫低鹽的南海水向北傳送,經過 台灣海峽後再繼續流向東海,總體積 流量約為 3 Sv,澎湖水道內的流量約 為 2 Sv。 五、計劃結果自評 本研究以三條研究船同步觀測台 灣海峽的流況,計算海水輸送量,研 究結果具有學術價值。 圖 7 東吉島 2002 年 8 月風速棍棒圖 六、參考文獻 1.Chuang, W.-S., 1985, “Dynamics of subtidal flow in the Taiwan Strait.”
Journal of the Oceanographic Society Japan, 41, 65-72.
2.Jan, S., and Chao, S.-Y., 2003, “Seasonal Variation of Volume transport in the major inflow region of the Taiwan Strait: the Penghu Channel.” Deep-Sea
Research II, 50, 1117-1126.
3.Jan, S., Wang, Y.-H., Chao, S.-Y., and Wang, D. –P., 2001, “Development of a Nowcast System for the Taiwan Strait (TSNOW): Numerical simulation of barotropic tides. Ocean and Polar
Research, 23, 195-203.
4.Katoh, O., 2000, “Current distributions in the southern East China Sea in summer”, Journal of Geophysical Research, 105, C4, 8565-8573.
5.Tseng, R.-S., and Shen, Y.-T., 2003, “Lagrangian observations of surface flow patterns in the vicinity of Taiwan.”
Deep-Sea Research II, 50, 1107-1115.
6.Wang, Y.-H., Jan., S. and Wang D.-P., 2003, “Transports and tidal current estimates in the Taiwan Strait from shipboard ADCP observations”,
Estuarine, Coastal and Shelf Science, 57,
193-199.
7.Wyrtki, K., 1961, “Physical oceanography of the southeast Asia waters.” Scientific results of marine
investigations of the South China Sea and Gulf of Thailand. 1959-1961, Naga