台灣國際觀光旅館業效率、生產力變動與獲利率之探討 - 政大學術集成
102
0
0
全文
(2) 立. 政 治 大. ‧. ‧ 國. 學. n. er. io. sit. y. Nat. al. Ch. engchi. i Un. v.
(3) EFFICIENCY, PRODUCTIVITY CHANGE AND PROFITABILITY IN TAIWAN’S INTERNATIONAL TOURIST HOTEL INDUSTRY By Li-Hsueh Chen. 立. 政 治 大. ‧ 國. 學 A THESIS. ‧ er. io. sit. y. Nat. SUBMITTED TO THE DEPARTMENT OF ECONOMICS NATIONAL a CHENGCHI UNIVERSITY. n. iv l C n hengchi U IN PARTIAL FULFILLMENT OF THE REQUIREMENTS FOR THE DEGREE OF DOCTOR OF PHILOSOPHY. JANUARY 2012 TAIWAN, REPUBLIC OF CHINA.
(4) 立. 政 治 大. ‧. ‧ 國. 學. n. er. io. sit. y. Nat. al. Ch. engchi. i Un. v.
(5) EFFICIENCY, PRODUCTIVITY CHANGE AND PROFITABILITY IN TAIWAN’S INTERNATIONAL TOURIST HOTEL INDUSTRY By Li-Hsueh Chen. 立. 治 政Abstract 大. ‧ 國. 學. The dissertation is a collection of three separate but related papers which are devoted to the empirical studies of the international tourist hotel industry in Taiwan. In addition to the. ‧. introduction in chapter 1, three papers are presented in chapters 2 to 4, respectively. The empirical results in chapter 2 indicate that, in the first stage, the data envelopment analysis. sit. y. Nat. (DEA) models without the quasi-fixed and adjusted inputs overestimate the technical and pure technical efficiencies, but underestimate the scale efficiency of international tourist. io. n. al. er. hotels so that the necessity of considering the existence of the quasi-fixed input is justified.. i Un. v. The second stage uses the stochastic frontier analysis (SFA) model to purge the effects from. Ch. engchi. exogenous variables and statistical noise. The SFA results show that the exogenous variables have significant influences on input slacks and pure technical efficiency. The degree of market concentration and hotel size have positive impacts on labor, food and beverage (F&B) expense and operating expense input slacks, as well as have negative impacts on pure technical efficiency. An international tourist hotel in the resort area has negative relationships with all input slacks and a positive relationship with pure technical efficiency. An international tourist hotel participating in the international and/or domestic hotel chain has positive relationships with labor and F&B expense input slacks, but has a negative relationship with other expense. Severe acute respiratory syndrome (SARS) has positive effects on labor and F&B expense input slacks and has a negative effect on pure technical efficiency. The financial tsunami has positive effects on labor and other expense input slacks and has a negative effect on pure technical efficiency. After adjusting the variable input data. i.
(6) from the SFA results in the second stage, the efficiency-evaluation results in the third stage show that the technical inefficiency mainly results from the inappropriate production scale. In addition, international tourist hotels have an ample space to improve their technical and scale efficiencies. The efficiency-evaluation results also show that the conventional DEA models overestimate the technical and scale efficiencies, but underestimate the pure technical efficiency of international tourist hotels so that the usage of the three-stage approach is justified. Finally, international tourist hotels which mainly receive group visitors have the worst performance. In chapter 3, the empirical results show that, in the first stage, the Malmquist index without the quasi-fixed and adjusted inputs underestimates the productivity change so as to justify the necessity of considering the existence of quasi-fixed input. After adjusting the variable input data from the SFA results in the second stage, the productivity. 政 治 大. index in the third stage shows that the initial increase in productivity has been compensated by a decrease. The productivity growth or deterioration mainly results from the technological. 立. progress or regress and the scale efficiency improvement or deterioration. The results also. ‧ 國. 學. show that the Malmquist index with the quasi-fixed input and without adjusted inputs underestimates the productivity change. The key factors of the productivity changes. ‧. estimated by the Malmquist productivity index with the quasi-fixed and adjusted inputs are significantly different from those estimated by the Malmquist productivity index with the. sit. y. Nat. quasi-fixed input and without adjusted inputs so as to justify the usage of the three-stage. io. er. approach. Finally, international tourist hotels with mainly receiving group visitors have the better improvement of productivity. The sources of productivity changes among receiving. n. al. i Un. v. different types of visitors are different, but the scale efficiency change plays an important role. Ch. engchi. in all types. In chapter 4, the empirical results indicate that the scale efficiency hypothesis is supported in Taiwan’s international tourist hotel industry. An international tourist hotel that mainly receives individual visitors and an international tourist hotel that simultaneously receives group and individual visitors have negative impacts on profitability. SARS and financial tsunami have negative effects on profitability.. ii.
(7) CONTENTS CHAPTER 1 INTRODUCTION...................................................................................................................... 1 1.1 BACKGROUND OF TAIWAN’S INTERNATIONAL TOURIST HOTEL INDUSTRY ................................................. 1 1.2 PURPOSE AND FRAMEWORK OF THE DISSERTATION .................................................................................... 2 CHAPTER 2 EFFICIENCY IN TAIWAN’S INTERNATIONAL TOURIST HOTEL INDUSTRY.......... 9 2.1 INTRODUCTION ........................................................................................................................................... 9 2.2 METHODOLOGY ........................................................................................................................................ 11 2.3 DATA DESCRIPTION AND EMPIRICAL RESULTS .......................................................................................... 14 2.3.1 Data Description............................................................................................................................. 14 2.3.2. 政 治 大 2A ................................................................................................................................................... 35 立. Empirical Results ........................................................................................................................... 17. 2.4 CONCLUSIONS .......................................................................................................................................... 22 APPENDIX. APPENDIX 2B ................................................................................................................................................... 36. ‧ 國. 學. APPENDIX 2C ................................................................................................................................................... 37 APPENDIX 2D ................................................................................................................................................... 39. ‧. CHAPTER 3 PRODUCTIVITY CHANGE IN TAIWAN’S INTERNATIONAL TOURIST HOTEL. sit. y. Nat. INDUSTRY....................................................................................................................................................... 43 3.1 INTRODUCTION ......................................................................................................................................... 43. io. er. 3.2 METHODOLOGY ........................................................................................................................................ 45. al. n. iv n C 3.2.2 The Malmquist Productivity Index 47 h ................................................................................................ i U e h n c g 3.3 DATA DESCRIPTION AND EMPIRICAL RESULTS ...................................................................................... 49 3.2.1. The Distance Function................................................................................................................... 45. 3.3.1 Data Description............................................................................................................................. 49 3.3.2. Empirical Results ........................................................................................................................... 49. 3.4 CONCLUSIONS .......................................................................................................................................... 52 APPENDIX 3A ................................................................................................................................................... 60 CHAPTER 4 PROFITABILITY IN TAIWAN’S INTERNATIONAL TOURIST HOTEL INDUSTRY. 61 4.1 INTRODUCTION ......................................................................................................................................... 61 4.2 METHODOLOGY ........................................................................................................................................ 63 4.3 DATA DESCRIPTION AND EMPIRICAL RESULTS .......................................................................................... 66 4.3.1 Data Description............................................................................................................................. 66 4.3.2. Empirical results............................................................................................................................. 67. 4.4 CONCLUSIONS .......................................................................................................................................... 69. iii.
(8) APPENDIX 4A ................................................................................................................................................... 78 CHAPTER 5. CONCLUDING REMARKS................................................................................................... 79. REFERENCES ................................................................................................................................................ 83. 立. 政 治 大. ‧. ‧ 國. 學. n. er. io. sit. y. Nat. al. Ch. engchi. iv. i Un. v.
(9) FIGURES FIGURE 1.1 THE NUMBER OF INTERNATIONAL TOURIST ARRIVALS WORLDWIDE .................................................. 4 FIGURE 1.2 THE NUMBER OF VISITOR ARRIVALS IN TAIWAN ................................................................................. 4 FIGURE 1.3 THE NUMBER OF INTERNATIONAL TOURIST HOTELS IN TAIWAN ......................................................... 5. 立. 政 治 大. ‧. ‧ 國. 學. n. er. io. sit. y. Nat. al. Ch. engchi. v. i Un. v.
(10) TABLES TABLE 1.2 THE AVERAGE OCCUPANCY RATE, THE PROFITABILITY AND THE MARKET STRUCTURE IN TAIWAN’S INTERNATIONAL TOURIST HOTEL INDUSTRY ............................................................................. 7 TABLE 2.1 DESCRIPTIVE STATISTICS OF RELEVANT VARIABLES ..................................................................... 25 TABLE 2.1 (CONTINUED) ................................................................................................................................... 26 TABLE 2.1 (CONTINUED) ................................................................................................................................... 27 TABLE 2.1 (CONTINUED) ................................................................................................................................... 28 TABLE 2.1 (CONTINUED) ................................................................................................................................... 29 TABLE 2.1 (CONTINUED) ................................................................................................................................... 30 TABLE 2.1 (CONTINUED) ................................................................................................................................... 31 TABLE 2.2 PEARSON CORRELATION COEFFICIENTS OF INPUT AND OUTPUT VARIABLES ............................... 31. 政 治 大 , Q. TABLE 2.3 PEARSON CORRELATION COEFFICIENTS OF INPUT-OUTPUT MIXES ............................................. 32 -F I , 立.............................................................................................................. 32. TABLE 2.4 COMPARISON OF DEA MODELS. WITH AND WITHOUT THE. UASI. IXED NPUT AS WELL AS WITH. AND WITHOUT ADJUSTED INPUTS. ‧ 國. 學. TABLE 2.5 RESULTS OF WILCOXON SIGNED RANK TEST ................................................................................. 33 TABLE 2.6 SFA PARAMETER ESTIMATES OF INPUT SLACK EQUATIONS .......................................................... 33. ‧. TABLE 2.7 SUMMARY OF THE ADJUSTED EFFICIENCY MEASURES AMONG DIFFERENT TYPES OF VISITORS. 34 TABLE 2.8 RESULTS OF WILCOXON RANK SUM TEST ...................................................................................... 34. sit. y. Nat. APPENDIX 2E........................................................................................................................................................ 41 TABLE 2E RESULTS OF THE IDENTIFICATION OF INFLUENTIAL OBSERVATIONS ............................................. 41. io. n. al. er. TABLE 2E (CONTINUED).................................................................................................................................... 42. i Un. v. TABLE 3.1 DESCRIPTIVE STATISTICS OF OUTPUT AND INPUT VARIABLES ....................................................... 54. Ch. TABLE 4.1 DESCRIPTIVE STATISTICS OF RELEVANT VARIABLES ..................................................................... 71. engchi. TABLE 4.1 (CONTINUED) ................................................................................................................................... 72 TABLE 4.1 (CONTINUED) ................................................................................................................................... 73 TABLE 4.1 (CONTINUED) ................................................................................................................................... 74 TABLE 4.1 (CONTINUED) ................................................................................................................................... 75 TABLE 4.1 (CONTINUED) ................................................................................................................................... 76 TABLE 4.2 PARAMETER ESTIMATES OF PROFITABILITY EQUATIONS .............................................................. 77. vi.
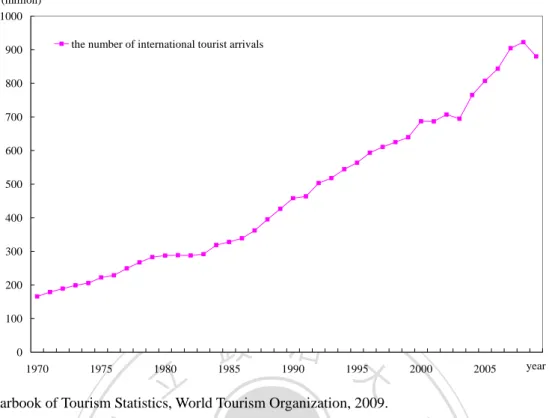
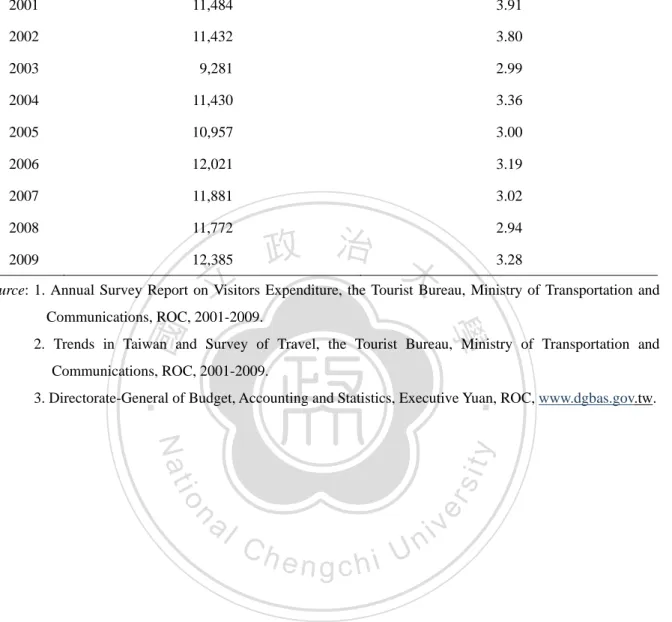
(11) CHAPTER 1 INTRODUCTION 1.1. Background of Taiwan’s International Tourist Hotel Industry. The concepts of a global village and globalization prompt people to easily contact each other and make a tendency of travel around different countries. In addition, with economic growth, the standard of living promotion and the development of international free trade in recent years, international travel activities have a rapid growth, except those decreases in severe acute respiratory syndrome (SARS) in 2003 and financial tsunami in 2009 (see Figure 1.1). The growth of travel activities has promoted the development of tourism industries. 政 治 大. worldwide. Travel has become an important socio-economic index. The tourism industry is a main source of foreign exchange earnings in many countries. Furthermore, global economic. 立. development is stimulated by travel activities (Gonzalez and Moral, 1996).. ‧ 國. 學. Taiwan is diverse and rich in the natural landscape and culture. More and more foreign visitors have desires to travel in Taiwan. Since the martial law was lifted in 1985, the removal. ‧. of limitations for the tourism industry has led tourist activities and foreign visitors further to grow up, except a decrease in SARS in 2003 (see Figure 1.2). In addition, since mainland. y. Nat. sit. tourists were allowed to visit Taiwan from 2008, the number of visitor arrivals in Taiwan was. al. er. io. increased even during the period of financial tsunamai. Various policies to encourage people. v. n. to enjoy their leisure life and promote the tourism, such as two-day weekend policy in 2001,. Ch. i Un. the doubling tourist arrivals plan in 2002, the tourism flagship plan in 2005 have been. engchi. implemented. The liberalization of international tourism in China also promoted the prevalence of tourist activities. Hence, the tourism industry has gradually played an important role in the economic growth in Taiwan. The aggregate tourism revenue has increased from US$11,484 million in 2001 to US$12,385 million in 2009. The ratio of aggregate tourism revenue to Taiwan’s gross domestic product (GDP) ranged from 2.94% and 3.91% during the period of 2001-2009 (see Table 1.1). Kim et al. (2006), Jang and Chen (2008), Chen and Chiou-Wei (2009) as well as Chen et al. (2009) also showed that the tourism industry has a greater contribution to Taiwan’s GDP than the agriculture industry. Additionally, Kim et al. (2006) as well as Chen and Chiou-Wei (2009) indicated that international tourism development could facilitate the economic growth in Taiwan. These results repeatedly illustrated the importance of tourism industry in Taiwan.. 1.
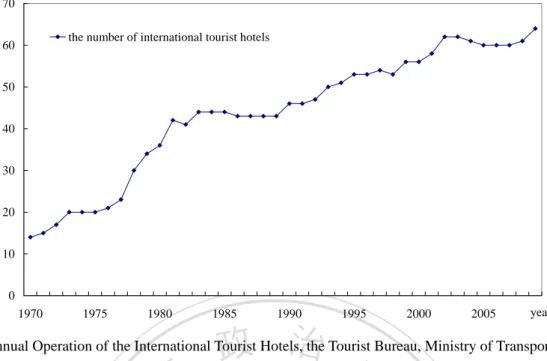
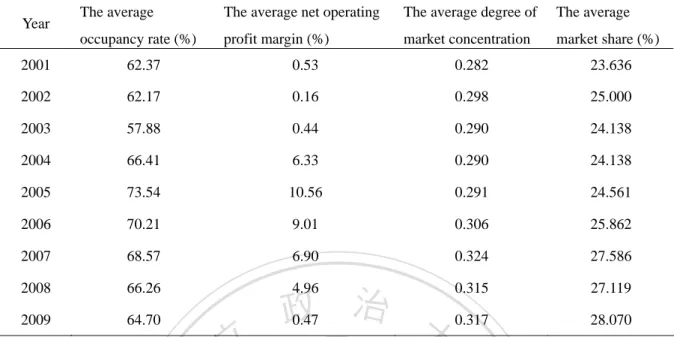
(12) With the expansion of travel activities, the demands for hotels are created. Hotels can be divided into tourist hotels and general hotels in Taiwan. Tourist hotels can provide a variety of activities, such as lodging, catering, social activity, meeting facility, shopping and amusements, which are the most critical function of the tourism industry (Tourist Bureau, 2010). According to the Regulations for Administration of Tourist Hotel Enterprises, two types of tourist hotels are distinguished: international tourist hotels and ordinary tourist hotels. International hotels are usually four-star or five-star tourist hotels and ordinary tourist hotels are three-star tourist hotels. In general, international tourist hotels provide the better quality of service than ordinary tourist and general hotels (Chen et al., 2005). The prohibition of building tourist hotels in Taiwan was deregulated in 1977. Under the expansion of travel activities and the encouragement by the government, the number of international tourist. 政 治 大. hotels sprang up from 14 in 1970 to 64 in 2009 (Figure 1.3). In addition, 39 new tourist hotels are expected to open during the period of 2011-2017. Under the movement of. 立. internationalization, international hotel groups established international tourist hotels in. ‧ 國. 學. Taiwan or signed cooperation contracts with Taiwan’s international tourist hotels one after another. The rising number of international tourist hotels has induced a more highly. ‧. competitive market environment. Except the initial period, the average occupancy rate decreased in recent years, which means that sales earnings and performance first increased. sit. y. Nat. and then decreased. The average net operating profit margin is in the similar trend to the. io. er. average occupancy rate (see Table 1.2). In addition, the net operating profit margins of individual international tourist hotels are significantly different from each other during the. n. al. i Un. v. period of 2001-2009. The highest operating profit margin is 45.25% while the lowest is. Ch. engchi. -135.95%. The standard deviation is 18.33%. These above faces show that individual international tourist hotels have to improve their performance in order to survive in this market. However, the average degree of market concentration and the average market share did not significantly change during the period of 2001-2009 (see Table 1.2). The above finding shows that the market structure might not the sole determinant of profitability in the international tourist hotel industry. 1. 1.2. Purpose and Framework of the Dissertation. The tourism industry has gradually played an important role in the economic growth in Taiwan. International tourist hotels are the most critical part of the tourism industry. 1. Since the data of ordinary tourist hotels are not available, this paper does not illustrate them.. 2.
(13) Therefore, this dissertation is to study the efficiency and productivity change, and to investigate the determinants of profitability in the international tourist hotel industry. The dissertation is a collection of three separate but related papers which are devoted to the empirical studies of the international tourist hotel industry in Taiwan. In addition to the introduction in chapter 1, three papers are presented in chapters 2 to 4, respectively. Chapter 2 is to evaluate the efficiency of international tourist hotels based on the three-stage data envelopment analysis (DEA) model with the quasi-fixed input. Based on the Malmquist productivity index with the quasi-fixed and adjusted inputs, the productivity change in the international tourist hotel industry will be evaluated in chapter 3. In chapter 4, the determinants of profitability in the international tourist hotel industry will be investigated. The last chapter summarizes the empirical results in the previous chapters and their policy. 政 治 大. implications, as well as provides suggestions for further research.. 立. ‧. ‧ 國. 學. n. er. io. sit. y. Nat. al. Ch. engchi. 3. i Un. v.
(14) (million) 1000 the number of international tourist arrivals. 900 800 700 600 500 400 300 200 100. 政 治 大. 0 1970. 1975. 1980. 1985. 立. 1990. 1995. 2000. 2005. year. Figure 1.1. 4.5. The Number of International Tourist Arrivals Worldwide. ‧. (million) 5. 學. ‧ 國. Source: Yearbook of Tourism Statistics, World Tourism Organization, 2009.. al. n. 3. sit. io. 3.5. er. 4. y. Nat. the number of visitor arrivals. 2.5 2. Ch. engchi. i Un. v. 1.5 1 0.5 0 1970. 1975. 1980. 1985. 1990. 1995. 2000. 2005. year. Source: Annual Operation of the International Tourist Hotels, the Tourist Bureau, Ministry of Transportation and Communications, ROC, 2009.. Figure 1.2. The Number of Visitor Arrivals in Taiwan. 4.
(15) 70 the number of international tourist hotels. 60. 50. 40. 30. 20. 10. 0 1970. 1975. 1980. 1985. 1990. 1995. 2000. 2005. year. 政 治 大. Source: Annual Operation of the International Tourist Hotels, the Tourist Bureau, Ministry of Transportation and. 立. Communications, ROC, 2009.. The Number of International Tourist Hotels in Taiwan. 學 ‧. ‧ 國. Figure 1.3. n. er. io. sit. y. Nat. al. Ch. engchi. 5. i Un. v.
(16) Table 1.1 The Aggregate Tourism Revenue and the Ratio of Aggregate Tourism Revenue to Taiwan’s GDP Year. The aggregate tourism revenue (US$ million). The ratio of aggregate tourism revenue to Taiwan’s GDP (%). 2001. 11,484. 3.91. 2002. 11,432. 3.80. 2003. 9,281. 2.99. 2004. 11,430. 3.36. 2005. 10,957. 3.00. 2006. 12,021. 3.19. 2007. 11,881. 3.02. 2008. 11,772. 2009. 12,385. 2.94. 政 治 大. 立. 3.28. Source: 1. Annual Survey Report on Visitors Expenditure, the Tourist Bureau, Ministry of Transportation and. ‧ 國. 學. Communications, ROC, 2001-2009.. 2. Trends in Taiwan and Survey of Travel, the Tourist Bureau, Ministry of Transportation and Communications, ROC, 2001-2009.. ‧. 3. Directorate-General of Budget, Accounting and Statistics, Executive Yuan, ROC, www.dgbas.gov.tw.. n. er. io. sit. y. Nat. al. Ch. engchi. 6. i Un. v.
(17) Table 1.2 The Average Occupancy Rate, the Profitability and the Market Structure in Taiwan’s International Tourist Hotel Industry Year. The average. The average net operating. The average degree of. The average. occupancy rate (%). profit margin (%). market concentration. market share (%). 2001. 62.37. 0.53. 0.282. 23.636. 2002. 62.17. 0.16. 0.298. 25.000. 2003. 57.88. 0.44. 0.290. 24.138. 2004. 66.41. 6.33. 0.290. 24.138. 2005. 73.54. 10.56. 0.291. 24.561. 2006. 70.21. 9.01. 0.306. 25.862. 2007. 68.57. 6.90. 0.324. 27.586. 2008. 66.26. 4.96. 0.315. 27.119. 2009. 64.70. 治 政 0.47 大 0.317. 立. 28.070. Source: Annual Operation of the International Tourist Hotels, the Tourist Bureau, Ministry of Transportation and. ‧ 國. 學. Communications, ROC, 2001-2009.. Note: 1. The average degree of market concentration is measured by the sum of the squared ratios of revenues from each international tourist hotel to total revenues of all international tourist hotels in the same city or. ‧. county.. 2. The average market share is measured by the ratio of revenues from each international tourist hotel to. y. Nat. n. al. er. io. sit. total revenues of all international tourist hotels in the same city or county.. Ch. engchi. 7. i Un. v.
(18) 立. 政 治 大. ‧. ‧ 國. 學. n. er. io. sit. y. Nat. al. Ch. engchi. 8. i Un. v.
(19) CHAPTER 2 EFFICIENCY IN TAIWAN’S INTERNATIONAL TOURIST HOTEL INDUSTRY 2.1 Introduction With economic growth, the improvement of living standards, the rising trend of international free trade in recent years, international travel activities have grown rapidly (see Figure 1.1). However, since the prohibition of building tourist hotels in Taiwan was deregulated in 1977 to encourage building new international tourist hotels, the number of international tourist hotels had the upward trend. Moreover, international hotel groups entered Taiwan’s market. Hence, the international tourist hotel industry has become more and more competitive (see. 政 治 大. Figure 1.3). In addition, individual international tourist hotels’ profitability is significantly. 立. different from each other. Individual international tourist hotels must more efficiently utilize. ‧ 國. 學. the input usage and enhance managerial performances for sustainable development. In addition, visitors can be divided into group and individual visitors. International tourist hotels must apply different marketing strategies and service methods to serve various visitors.. ‧. Whether the decision of receiving different types of visitors may result in the difference of. sit. y. Nat. management efficiency or not. Therefore, the managerial efficiency of international tourist. io. al. er. hotels in Taiwan is worth to be evaluated and investigated.. n. The DEA is applied to evaluate the efficiency of international tourist hotels in Taiwan. The. Ch. i Un. v. concept of DEA was proposed by Farrell (1957). 2 Then, Charnes et al. (1978) developed. engchi. DEA to the efficiency measure model with multiple inputs and outputs by utilizing the deterministic non-parametric approach and mathematical programming technique. The main advantage of DEA is that it only requires input and output data from each decision making unit (DMU) and does not require a pre-specified parametric production function. A piecewise linear envelopment surface from observed input-output data is yielded through the DEA approach. This envelopment surface is treated as the efficient frontier. DMUs are efficient for lying on the frontier and their technical efficiency measures are 1; the rest of DMUs are termed as inefficient and their efficiency measures do not equal 1. Banker et al. (1984). 2. Actually, DEA can be used to measure productive efficiency which comprises two parts: the technical (physical) and allocative (price) parts (Farrell, 1957). Since the measurement of the latter requires information on input prices that are often difficult to obtain or measure accurately, this paper will be focused mainly on technical efficiency.. 9.
(20) relaxed the assumption of constant returns to scale (CRS) proposed by Charnes et al. (1978) to variable returns to scale (VRS) so that their approach could further decompose technical efficiency into two components: pure technical efficiency and scale efficiency. However, the conventional DEA cannot filter out the external effects. Theoretically, both internal and external factors can affect pure technical efficiency measures. The former is under the control of DMUs. The latter includes exogenous factors and random noise that are not under the control of DMUs. External factors need to be sorted out in order to correctly assess the efficiency of each DMU. Fried et al. (1999) and Fried et al. (2002) proposed modified approaches, called the four-stage DEA and three-stage DEA, to solve this problem, respectively. In the four-stage DEA, the first stage uses the original inputs and outputs to evaluate the efficiency by the conventional DEA model. Then, the second stage applies the. 政 治 大. Tobit censored regression model to purge the original input-output data from the impacts of exogenous factors. The third stage adjusts the input-output data by the exogenous factors.. 立. Finally, the fourth stage uses the adjusted input-output data to re-evaluate the efficiency by. ‧ 國. 學. the DEA model. Fried et al. (2002) further proposed the three-stage DEA to eliminate the effect of random noise that does not considered in the four-stage DEA. The original inputs. ‧. and outputs are used to evaluate the efficiency by the conventional DEA model in the first stage. In the second stage, the stochastic frontier analysis (SFA) is applied to purge the. sit. y. Nat. original input-output data from the impacts of exogenous factors and statistical noise. 3 The. io. er. adjusted input-output data are used to re-evaluate the efficiency in the third stage. In addition, the conventional DEA assumes that all inputs can be adjusted, immediately. In practice, firms. n. al. i Un. v. cannot adjust all inputs in the short run since they may spend many adjustment costs. Banker. Ch. engchi. and Morey (1986) first introduced non-discretionary inputs (or quasi-fixed inputs) in the DEA model to deal with this problem. Then, the presence of quasi-fixed inputs has been applied in the hospital sector (Bilodeau et al., 2004; Ouellette and Vierstraete, 2004; Steinmann et al., 2004), school (Essid et al., 2010; Ouellette and Vierstraete, 2010), etc. In order to acquire more accurate measures, this paper incorporates quasi-fixed inputs into the three-stage DEA model and uses this model to evaluate the efficiency. A lot of existing literature applies DEA to evaluate the efficiency in the hotel industry. 4 3. The stochastic frontier analysis was proposed by Aigner et al. (1977) and Meeusen and van den Broek (1977), respectively. 4 Johns et al. (1997), Anderson et al. (2000),Tsaur (2001), Brown and Ragsdale (2002), Hwang and Chang (2003), Chiang et al. (2004), Barros (2005), Barros and Mascarenhas (2005), Barros and Santos (2006), Wang and He (2006), Wang et al. (2006), Barros and Dieke (2008), Shang et al. (2008), Shang et al. (2008), Botti et al. (2009), Chen (2009), Neves and Lorenco (2009), Perrigot et al. (2009), Yu and Lee (2009), Hsieh and Lin (2010), Wu et al. (2011), etc.. 10.
(21) Most of the literature does not use the three-stage DEA model to investigate the efficiency of hotels except Shang et al. (2008) and Shang et al. (2008). However, the choice of input and output variables in Shang et al. (2008) and Shang et al. (2008) violates the principle of exclusivity suggested by Thanassoulis (2001) that every input or output should not be counted more than once. In addition, no studies incorporate quasi-fixed inputs into the three-stage DEA model to analyze the efficiency of hotels according to the author’s best knowledge. This paper may first apply the three-stage DEA with quasi-fixed inputs to evaluate the efficiency of international tourist hotels in Taiwan. In addition to the introduction, the rest of this chapter is organized as follows. Section 2 establishes the three-stage DEA model with quasi-fixed inputs to evaluate the efficiency of international tourist hotels in Taiwan. A description of the data and empirical results are. 政 治 大. presented in Section 3. Section 4 is a conclusion.. 立. 2.2 Methodology. ‧ 國. 學. The DEA approach uses a mathematical programming technique to estimate a piecewise linear envelopment surface from the observed input-output data. This envelopment surface is. ‧. referred to as the efficient frontier. The frontier is generated from efficient DMUs and the. sit. y. Nat. technical efficiency measures of these efficient DMUs are 1; the rest of DMUs are termed as. io. al. er. inefficient and their efficiency measures do not equal 1.. n. There are input-oriented and output-oriented models to evaluate the efficiency in the DEA. Ch. i Un. v. approach. Lovell (1993) suggested that if DMUs could easily adjust the input usage but were. engchi. difficult to estimate the amount of outputs, it was more appropriate to use the input-oriented model. Otherwise, the output-oriented model seemed suitable. The input-oriented model is used for this paper due to two reasons: First, international tourist hotels in Taiwan have limited control over their revenues which are highly related to conditions in the external environment. Second, international tourist hotels in Taiwan have the flexibility to adjust their input usages in terms of labor and expenses. Technical efficiency evaluated by the conventional DEA model may be affected by exogenous factors and random noise. This paper applies the three-stage DEA to purge these external effects. In addition, these managers of international tourist hotels cannot adjust or are unwilling to adjust the entire bundle of inputs, because they may spend many adjustment costs to adjust all inputs to their optimal level in the short run. In other words, there are quasi-fixed inputs in international tourist hotels. This paper incorporates quasi-fixed inputs 11.
(22) introduced by Banker and Morey (1986) as well as Ouellette and Vierstraete (2004) in the three-stage DEA model. 5 In the first stage, the original input-output data is applied to the DEA model. According to Banker and Morey (1986) as well as Ouellette and Vierstraete (2004), suppose that there are N international tourist hotels in this market, each using M variable inputs and R quasi-fixed inputs to produce S outputs. Let x mn , k rn and y sn denote the mth (m=1, 2,…, M) variable input usage, the rth (r=1, 2,…, R) quasi-fixed input usage and the sth (s=1, 2,…, S) output production of the nth (n=1, 2,…, N) international tourist hotel. Under the assumptions of the reference technology exhibiting CRS and strong disposability of inputs, technical efficiency (TEi) can be obtained by solving the following model: 6 min. , λ1 ,Κ , λ N. θ iCRS. 政 治 大. 立. x mn ≤ θ i x mi , m = 1, 2,Κ , M. ∑λ k n. N. n =1. n. ≤ k ri , r = 1, 2,Κ , R. y sn ≥ y si , s = 1, 2,Κ , S. io. ∑λ. rn. Nat. n =1. ‧. N. (2-2). (2-3). y. n. n. al. λ n ≥ 0, n = 1, 2,Κ , N. (2-4). er. n =1. 學. N. ∑λ. ‧ 國. subject to. (2-1). sit. θ iCRS. Ch. engchi. i Un. v. (2-5). where θ iCRS is the technical efficiency of the ith international tourist hotel; λn is the weight of the nth international tourist hotel’s production action used. Technical efficiency of an international tourist hotel is evaluated in terms of its ability to radically reduce its inputs usage. If the radical reduction is possible for an international tourist hotel, its optimal θ iCCR < 1 ; if the radial reduction is not possible for an international tourist hotel, its. optimal θ iCCR = 1 . The difference between this model and the conventional DEA model is that the technical efficiency measure, θ iCRS , multiplies the variable inputs, but does not multiply 5. Banker and Morey (1986) first introduced quasi-fixed inputs in the DEA model, but they called them as non-discretionary inputs. Bilodeau et al. (2004) as well as Ouellette and Vierstraete (2004) called them as quasi-fixed inputs. 6 Strong disposability, or called free disposability, refers to the ability to dispose of unwanted commodity with no private cost. Strong disposability of inputs models the situation in which inputs can be increased without reducing output. That is, this condition excludes “upward sloping” isoquants (Färe et al., 1994).. 12.
(23) the quasi-fixed inputs in this model. The technical efficiency measure obtained from the above model is not only influenced by the pure technical efficiency (i.e., the efficiency in resource usage), but also by the scale efficiency (i.e., the efficiency in production scale). To decompose these two factors, the reference technology assumption of above model is relaxed to VRS by imposing the N. constraint. ∑λ n =1. n. = 1 . Then, the pure technical efficiency (PTEi) measure, θ iVRS , can be. produced. The scale efficiency (SEi) measure is computed as SEi ≡ TEi PTE i . 0 < SEi ≤1, since 0 < TEi ≤ PTEi ≤ 1 . If SEi = 1 , the international tourist hotel is scale-efficient and operates at the optimal scale which is the point of constant returns on the production frontier; if SEi <1, the international tourist hotel is scale-inefficient and operates at the inappropriate. 政 治 大 In the second stage, SFA is used to decompose input slacks into exogenous effects, random 立. scale.. noise, and managerial inefficiency. The input slacks are the difference in the input usage. ‧ 國. 學. between an international tourist hotel and a hypothetical international tourist hotel on the efficient frontier. 7 The values indicate how much the input usage of the corresponding. ‧. international tourist hotel needs to be reduced in order to be technically efficient. However,. y. Nat. quasi-fixed inputs will not be affected by exogenous effects and random noise since they. sit. cannot be adjusted in the short run. Hence, only M variable input slacks are decomposed. The. n. al. er. io. dependent variables are the M variable input slacks and the independent variables are the L. i Un. v. observable exogenous variables. The M separate SFA regressions are specified as:. Ch. engchi. smn = f m(zn; β m) +νmn + umn , m = 1, 2,Κ , M ; n = 1, 2,Κ , N. (2-6). N. where s mn = x mn − ∑ λ*n x mn ; λ*n is the optimal solution of the nth international tourist hotel; n =1. z n = [z1n , z 2 n , Κ , z Ln ] is a vector of the L observable exogenous variables of the nth. international tourist hotel; f m(zn; β m) is the deterministic feasible slack frontier with 2 estimated the parameter vector β m of the mth variable input slack; ν mn ~ N (0, σ vm ). represents statistical noise; u mn represents the managerial inefficiency which is assumed to be truncated-normal distribution and be independent with v mn . These adjusted variable inputs are constructed from the results of SFA regressions as 7. Input slacks include the radial and non-radial input slacks.. 13.
(24) follows:. [. {. ]. }. ~ x mn = x mn + max n z n βˆ m − z n βˆ m + [max n {νˆmn } − νˆmn ], m = 1, 2,Κ , M ; n = 1, 2, Κ , N (2-7). x mn and x mn denote the adjusted and original variable input usage, respectively. where ~ [max n z n βˆ m − z n βˆ m ] forces all international tourist hotels to operate in the least favorable. {. }. set of external conditions observed in the sample. [max n {vˆ mn } − vˆ mn ] forces all international tourist hotels to operate in the worst situation observed in the sample.. Finally, the third stage uses the data of the adjusted variable inputs, original quasi-fixed inputs and original outputs to re-evaluate the efficiency in order to yield more accurate measures.. 2.3. 立. Data Description. 學. ‧ 國. 2.3.1. 政 治 大. Data Description and Empirical Results. The data used in this paper are based on Taiwan’s international tourist hotels operated from. ‧. 2003 to 2009. They were conducted by the Annual Operation of the International Tourist Hotels, published by the Tourist Bureau, Ministry of Transportation and Communications,. sit. y. Nat. ROC. After discarding incomplete observations, 47 international tourist hotels are remained. io. al. er. and are listed in Appendix 2A.. v. n. Referring to Johns et al. (1997), Anderson et al. (2000), Hwang and Chang (2003), Chiang. Ch. i Un. et al. (2004), Wang and He (2006), Wang et al. (2006) and Shang et al. (2008), the outputs of. engchi. international tourist hotels are divided into three categories: guest room revenue, food and beverage (F&B) revenue as well as other revenue. Four types of inputs are distinguished: guest room, labor, F&B expense and other expense. The revenues of international tourist hotels are mainly from the guest room revenue and F&B revenue. The average guest room revenue and F&B revenue account for 46% of total revenues, respectively. Although the average other revenue only accounts for around 8% of total revenues, the maximum value among all international tourist hotels is 62%. Hence, the other revenue is considered as a type of output, and is measured in terms of total revenues except guest room revenue and F&B revenue to avoid double-counting. The guest room is represented as the quasi-fixed input and is measured by the number of guest rooms. The quantity of labor is measured by the number of employees. The other expense is measured in terms of total operating expenses except guest room expense, labor-related expense and F&B expense. In addition, guest room 14.
(25) revenue, F&B revenue and other revenue are deflated by the consumer price index with 2006 as the base year. F&B expense and other expense are deflated by the wholesale price index with 2006 as the base year. The consumer and wholesale price indices are published by the Directorate-General of Budget, Accounting and Statistics of Executive Yuan, ROC. In the second stage, the variables of market structure, hotel characteristics and external environment are chosen to filter out the impacts of exogenous variables. 8 Market structure is represented by the degree of market concentration. The degree of market concentration is measured by Herfindahl-Hirschman Index (H). An international tourist hotel’s H is the sum of the squared ratios of revenues from each international tourist hotel to total revenues of all international tourist hotels in the same city or county. 9 The higher value of H represents the higher market concentration. Hotel characteristics are divided into hotel size, market. 政 治 大 dummy variable SIZE 1 is equal to 1 for the international tourist hotel with 201 to 400 guest 立 rooms; otherwise, SIZE 1 is equal to 0. The dummy variable SIZE 2 is equal to 1 for the condition and hotel style. The hotel size is measured by the number of guest rooms. The. ‧ 國. 學. international tourist hotel with more than 401 guest rooms; otherwise, SIZE 2 is equal to 0. 10 The market condition is denoted by the dummy variable which the international tourist hotel. ‧. belongs to a resort hotel or city hotel. The dummy variable RESORT is equal to 1 for international tourist hotels being resort hotels, and 0 for those being city hotels. The hotel. y. Nat. sit. style is denoted by the dummy variable which the international tourist hotel belongs to an. al. er. io. international and/or domestic chain hotel or independent hotel. The dummy variable CHAIN. v. n. is equal to 1 for international tourist hotels being international and/or domestic chain hotels,. Ch. i Un. and 0 for those being independent hotels. External environment is represented by two events:. engchi. severe acute respiratory syndrome (SARS) in 2003 and financial tsunami in 2008 and 2009. The theoretical foundations of these exogenous variables are illustrated as follows: Market Structure. The Degree of Market Concentration (H). The lower degree of market concentration is, the 8. According to Fried et al. (1999), exogenous variables are these factors that may affect pure technical efficiency but are not controlled by DMUs in the short run, such as the form of ownership, location characteristics, labor relations as well as government regulations. 9 Since an international tourist hotel competes with other international tourist hotel in the same county or city, this paper divides the locations of total international tourist hotels into 13 areas by counties and cities. These 13 areas include Taipei, Kaohsiung, Taichung, Hsinchu, Hualien, Tainan and Taitung cities as well as Kaohsiung, Taoyuan, Hualien, Tainan, Taitung and Pingtung counties. 10 According to Tourist Bureau (2010), hotel size is divided into eight categories: less than 100, 101-200, 201-300, 301-400, 401-500, 501-600, 601-700 and more than 701 guest rooms. However, this classification is too detail and leads to only two international tourist hotels in some categories.. 15.
(26) more competitive pressure among international tourist hotels will be. International tourist hotels have more desire to reduce wasted resources and increase their efficiency in order to survive (Lovell, 1993). Hence, under the same quantities of outputs, if the competitive pressure is higher, the international tourist hotels will use fewer quantities of inputs and lead to fewer input slacks. Therefore, the relationship between the degree of market concentration and input slack is expected to be positive. In other words, the relationship between the degree of market concentration and pure technical efficiency is expected to be negative. Hotel Characteristics. Hotel Size (SIZE). When the firm size expands, the input usage may be reduced through. sharing or joint utilization, but also may be increased through allocative complexity (Baumol. 政 治 大. et al., 1982). Hence, the impacts of hotel size on input slack and pure technical efficiency are indeterminable.. 立. Market Condition (RESORT). Resort hotels face the more volatile demand than city hotels,. ‧ 國. 學. but the number of guest rooms cannot be changed in the short run (Baum and Mudambi, 1995). Hence, the effects of the peak season and off-peak season on resort hotels are more. ‧. serious, and easily lead to waste labor and resources. Therefore, the relationship between the market condition and input slack is expected to be positive. In other words, the relationship. y. Nat. io. sit. between the market condition and pure technical efficiency is expected to be negative.. er. Hotel Style (CHAIN). Chain hotels could attract more visitors via marketing chain and benefit. al. n. iv n C U facilities (Wang and He, 2006). h e n gservices input usage and costs by requiring standard c h i and. from the managerial experience of hotel chains via technology transfers, but could increase Hence, the impacts of hotel style on input slack and pure technical efficiency are indeterminable. External Environment. Severe Acute Respiratory Syndrome (SARS). SARS is a respiratory disease in humans. It can. be spread from person to person through respiratory secretions. In order to reduce contact with others, people will avoid going to public places. Hence, demands for accommodation and F&B in international tourist hotels will be reduced and input slacks will be increased during the period of SARS infection. Therefore, the relationship between SARS and input slack is expected to be positive. In other words, the relationship between SARS and pure technical efficiency is expected to be negative.. 16.
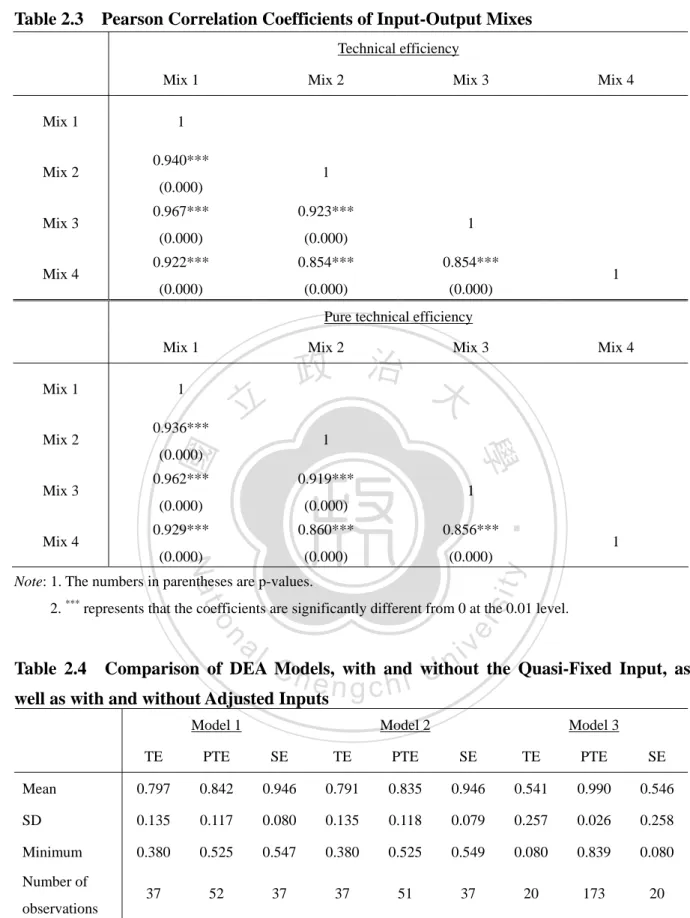
(27) Financial Tsunami (FT). During the period of financial tsunami, people will decrease. additional expenditures and increase savings because of uncertain incomes and the possibility of unemployment. Hence, the unnecessary tourism expenditure will be lowered and demands for accommodation and F&B in international tourist hotels will be reduced. Therefore, the financial tsunami is expected to have a positive relationship with input slack and a negative relationship with pure technical efficiency. The definitions of relevant variables are summarized in Appendix 2B. The descriptive statistics of relevant variables is presented in Table 2.1. On the output side, guest room revenues range from 26 million to 1,479 million NT dollars; F&B revenues range from 5 million to 1,250 million NT dollars; other revenues range from 10,758 to 454 million NT dollars. On the input side, guest rooms range from 50 to 873 rooms; labors range from 53 to. 政 治 大 expenses range from 10 million to 1,085 million NT dollars. These represent that there are 立 extremely different among individual international tourist hotels on the output and input sides. 982 employees; F&B expenses range from 3 million to 368 million NT dollars; other. ‧ 國. 學. The guest room is represented as the quasi-fixed input because only 12 out of 47 international tourist hotels change the quantities of guest rooms during the period of 2003-2009 and most. ‧. international tourist hotels change within 10 guest rooms (see Appendix 2C). In addition, 58.7% of international tourist hotels have 201 to 400 guest rooms, indicating that over half. y. Nat. sit. international tourist hotels is the middle size. The average value of market condition dummy. al. er. io. indicates that 14.9% of international tourist hotels are resort hotels. The average value of. v. n. hotel style dummy represents that 59.3% of international tourist hotels are chain hotels. 2.3.2. Empirical Results. Ch. engchi. i Un. Before evaluating the efficiency of international tourist hotels, this paper examines the problem of data errors (or influential observations), the correlation of input and output variables and the choice of input-output mix. Since the existence of data errors will distort the DEA efficiency- evaluation results, the method proposed by Wilson (1995) is used to detect influential observations. The process is briefly described in Appendix 2D. The result shows that no observations play a relatively important role in determining the efficient frontier, because the value of total effect by removing any observation is not too high (see Appendix 2E). Hence, no observations need to be deleted from the data. Golany and Roll (1989) considered that input and output variables should follow the assumption of “isotonicity”. It means when an increase in any input variable should not result 17.
(28) in a decrease in any output variable. This paper applies the Pearson correlation coefficients to examine the isotonicity relationship between input and output variables. The result indicates that input and output variables are positive relationships at the 1% significant level (see Table 2.2). Hence, the input and output variables conform to the assumption of isotonicity. Since the results of DEA efficiency-evaluation are sensitive to the input-output mixes, this paper utilizes the Pearson correlation coefficients to perform the stability test. Based on the same input variables, four kinds of input-output mixes are chosen. First, Mix 1 is the original mix and includes 3 output variables: guest room revenue, F&B revenue and other revenue. Second, Mix 2 includes 2 output variables: guest room revenue and F&B revenue. Third, Mix 3 includes 2 output variables: guest room revenue plus other revenue and F&B revenue. Finally, Mix 4 includes 2 output variables: guest room revenue and F&B revenue plus other. 政 治 大 input-output mixes are positive relationships at the 1% significant level (see Table 2.3). 立 Hence, the choice of input and output variables in the original mix is appropriate. revenue. The results show that the efficiency-evaluation results among four kinds of. ‧ 國. 學. The first stage. First, the impact of quasi-fixed input is investigated. The comparison. ‧. between the efficiency measures estimated by the DEA model without the quasi-fixed and adjusted inputs (Model 1) as well as those estimated by the DEA model with the quasi-fixed. sit. y. Nat. input and without adjusted inputs (Model 2) is presented in Table 2.4. Furthermore, this paper uses the Wilcoxon signed rank test to examine whether the efficiency measures estimated by. io. er. Model 1 and 2 are significantly different or not. Table 2.5 shows that the technical efficiency. al. n. iv n C U implying that the DEA models h esignificant those estimated by Model 1 at the 1% n g c h ilevel, and pure technical efficiency measures estimated by Model 2 are significantly lower than. without the quasi-fixed and adjusted inputs overestimate the technical and pure technical efficiencies of international tourist hotels. The scale efficiency measure estimated by Model 2 is higher than that estimated by Model 1 at the 5% significant level, implying that the DEA model without the quasi-fixed and adjusted inputs underestimates the scale efficiency of international tourist hotels. Hence, the necessity of considering the existence of the quasi-fixed input is justified. The evaluation results for each efficiency measure estimated by Model 2 are summarized in Table 2.4 and are described in the following paragraph. The mean technical efficiency measure of international tourist hotels is 0.791, implying that international tourist hotels in Taiwan could reduce inputs by 20.9%, on average, and still produce the same level of outputs. In order to investigate the source of technical inefficiency, technical efficiency can be 18.
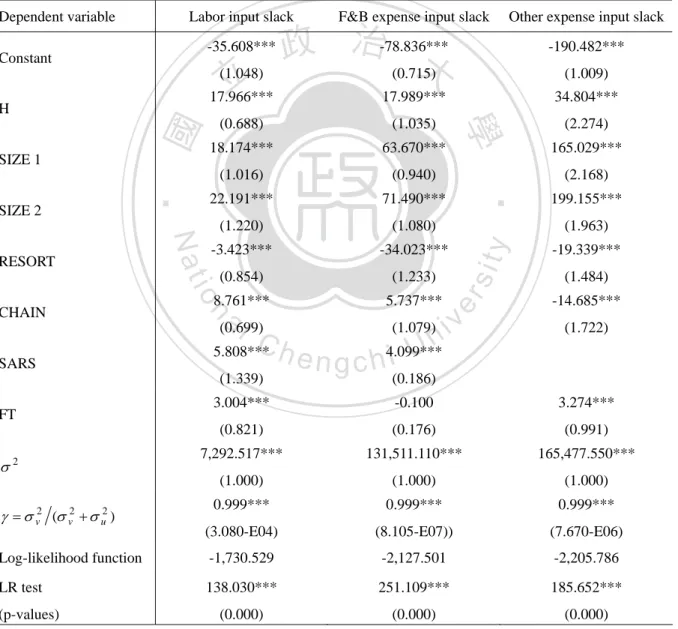
(29) decomposed into pure technical efficiency and scale efficiency. The mean pure technical efficiency measure is 0.835 while the mean scale efficiency measure is 0.946. These results imply that the technical inefficiency mainly results from wasted resources. In addition, the percentage of hotels operating on the frontier is about 11.2 (37 out of 329) in technical efficiency and 15.5 (51 out of 329) in pure technical efficiency. This result implies that an ample space exists for most international tourist hotels in Taiwan to improve their efficiency. The second stage.. The labor, F&B expense and other expense input slacks yielded in the. first stage are used as dependent variables, as well as the degree of market concentration, hotel size, market condition, hotel style, SARS and financial tsunami are used as independent variables in the SFA model to purge effects from exogenous variables and statistical noise in the second stage. Before applying the SFA approach, these values of variance inflationary. 政 治 大 variables. Since the values of VIF are all below 2.45, the multicollinearity problem among 立 independent variables is not serious. Following Fried et al. (2002), the likelihood-ratio test. factor (VIF) are calculated to examine the degree of multicollinearity among independent 11. ‧ 國. 學. (LR test) is applied to examine the specification of SFA model. The null hypothesis of this test is that the SFA model is equivalent to the traditional model, without managerial. ‧. inefficiency effect. When there is managerial inefficiency effect, the null hypothesis will be rejected and SFA should be applied. Otherwise, the ordinary least square (OLS) regression. y. Nat. sit. should be used (Coelli et al., 1998). The LR test results reject the null hypotheses in all input. er. io. slack equations at the 1% significant level (see Table 2.6). Hence, the SFA model is adequate. al. iv n C 12 U of market concentration has h e n2.6. The SFA results are presented in Table The i degree gch n. to be used in the second stage.. positive effects on all three input slacks at the 1% significant level, implying that the more competitive pressure can help international tourist hotels to increase their pure technical efficiency. The underlying reason is that when there are more competitors in the market, international tourist hotels are more willing to reduce wasted resources in order to survive (Lovell, 1993). The result also supports the quiet life hypothesis proposed by Hick (1935) that if international tourist hotels have more market power, the manager will pay less attention to improving their efficiency. Two hotel size dummies are positive on all three input slacks at the 1% significant level. Moreover, the bigger hotel size is, the larger coefficient. 11. The VIF value is smaller than 5 for each independent variable with no serious correlation with each other; but there exists serious multicollinearity problem if the largest VIF value exceeds 10 (Greene, 2000). 12 In order to obtain better result, SARS is deleted from the other expense input slack equation.. 19.
(30) will be. The result implies that an expansion in the hotel size may increase the complexity of allocating resources more than decrease the input usage through sharing or joint utilization. Contrary to the expectation, the resort dummy is negative and significant on all three input slack. Two possible explanations for this outcome are that popular visiting spots help international tourist hotels to attract more visitors, or managers of resort hotels may adopt superior managerial strategies to improve their efficiency (Wang and He, 2006). The effects of hotel style are positive on labor and F&B expense input slacks, but is negative on the other expense input slack, indicating that chain hotels could reduce their other expenses by attracting visitors and benefiting from hotel chains’ managerial experience, but could increase their labors and F&B expenses in order to require standard services and facilities. The SARS has positive effects on labor and F&B expense input slacks at the 1% significant level,. 政 治 大. indicating that demands for accommodation and F&B in international tourist hotels could be decreased in order to avoid SARS infection during the period of SARS prevalence. The. 立. financial tsunami dummy is positive on labor and other expense input slacks at the 1%. ‧ 國. 學. significant level, implying that people may reduce the unnecessary tourism expenditure in order to face the uncertainty of the economic environment during the period of financial. ‧. tsunami.. sit. y. Nat. The contribution of managerial inefficiency is also showed in Table 2.6. The estimated values of parameter γ are all close to 1 in three input slack equations. 13 It means that the. al. er. io. inefficiency is mainly due to the managerial inefficiency. Since the variation in input slacks. v. n. mostly results from the exogenous variables and managerial inefficiency, the impacts of. Ch. i Un. exogenous variables must be eliminated to avoid misleading the efficiency measures of. engchi. international tourist hotels. Hence, the necessity of adopting the three-stage DEA is justified. The third stage.. The third stage re-evaluates efficiency measures by using the adjusted. variable input data calculated in the second stage. Similarly, the test between efficiency measures estimated by Model 2 and estimated by the DEA model with quasi-fixed and adjusted inputs (Model 3) is presented in Table 2.5 to justify the usage of the three-stage approach. This paper also utilizes the Wilcoxon signed rank test to examine whether the efficiency measures estimated by Model 2 and 3 are significantly different or not. The results show that the technical efficiency and scale efficiency measures estimated by Model 3 are When γ is close to 1, the impact of the managerial inefficiency dominates the statistical noise. Contrarily, when γ is close to 0, the impact of the statistical noise dominates the managerial inefficiency (Coelli et al., 1998). 13. 20.
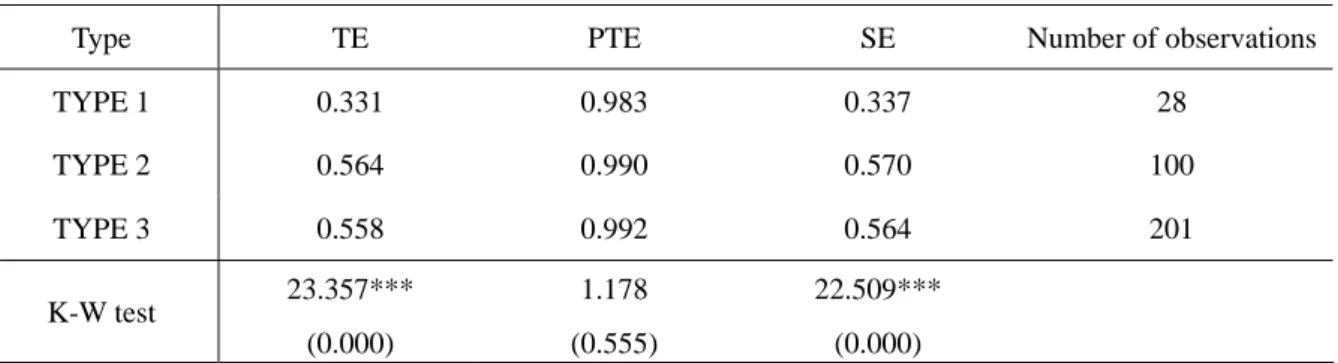
(31) significantly lower than those estimated by Model 2 at the 1% significant level, implying that the conventional DEA models overestimate the technical and scale efficiencies of international tourist hotels. The pure technical efficiency measure estimated by Model 3 is higher than that estimated by Model 2 at the 1% significant level, implying that the conventional DEA model underestimates the pure technical efficiency of international tourist hotels. Hence, the necessity of adjusting inputs is justified. The evaluation results for each efficiency measure estimated by Model 3 are also summarized in Table 2.4. The mean technical efficiency measure is 0.541, implying that international tourist hotels in Taiwan could reduce inputs by 45.9%, on average, and still produce the same level of outputs. In addition, the mean pure technical efficiency measure is 0.990 while the mean scale efficiency measure is 0.546. These pure technical efficiency. 政 治 大 exogenous variables and statistical noise. These results imply that the technical inefficiency 立 mainly originates in the inappropriate production scale. A possible explanation for this measures of international tourist hotels are very close to 1 after discarding the effects of. ‧ 國. 學. outcome is that international tourist hotels may take a long time to reach the appropriate scale since adjusting the number of guest rooms to attain the optimal level may spend many. ‧. adjustment costs in the short run. Finally, 173 out of 329 observations are purely technically efficient and only 20 are technically efficient, implying that most international tourist hotels. y. Nat. io. sit. in Taiwan have an ample space to improve their technical and scale efficiencies.. er. Efficiency comparison among international tourist hotels with different types of visitors.. al. n. iv n C hen when they serve different types of visitors. According g c h itoUTsaur (2001), when an international. This paper also investigates whether international tourist hotels achieve different efficiencies,. tourist hotel serves group visitors more than 75% in total visitors, the international tourist hotel belongs to TYPE 1 that specializes in receiving group visitors; when an international tourist hotel serves individual visitors more than 75% in total visitors, the international tourist hotel belongs to TYPE 2 that specializes in receiving individual visitors. In addition, this paper adds TYPE 3 that simultaneously receives group and individual visitors, when an international tourist hotel serves group and individual visitor both lower than 75% in total visitors. Table 2.7 shows that the mean technical efficiency measure of TYPE 2 is the highest, and that of TYPE 1 is the lowest. The mean pure technical efficiency measures are all close to 1 among three types. This paper also utilizes the Kruskal-Wallis test (K-W test) to examine whether efficiency measures among different types of visitors are significantly different or not. These results show that technical and scale efficiency measures among different types of. 21.
(32) visitors are significantly different at the 1% significant level, but the pure technical efficiency measure is not significantly different (see Table 2.7). These imply that the difference of technical efficiency among three types of visitors mainly results from the difference of scale efficiency. Furthermore, the Wilcoxon rank sum test is used to investigate the multiple comparisons of technical and scale efficiencies among three types (see Table 2.8). These results show that these technical and scale efficiency measures between TYPE 1 and TYPE 2 as well as TYPE 1 and TYPE 3 are significantly different at the 1% significant level, but these technical and scale efficiency measures between TYPE 2 and TYPE 3 are not significantly different. These indicate that if an international tourist hotel mainly receives group visitors, the efficiency will be lower. A possible reason for this outcome is that group visitors book rooms and ask the. 政 治 大 power and technique to reduce prices or request more services. International tourist hotels 立 which mainly receive group visitors may use more quantities of inputs and still produce the relative services through travel agencies. However, travel agencies have the better bargaining. ‧ 國. 學. same quantities of outputs. Thus, international tourist hotels which mainly receive group visitors perform lower than others.. ‧. 2.4. Conclusions. y. Nat. io. sit. Since the prohibition of building tourist hotels in Taiwan was deregulated in 1977 to. er. encourage building new international tourist hotels, the number of international tourist hotels. al. n. iv n C h Individual was the downward trend in recent years. i U tourist hotels’ profitability is e n g c hinternational. sprang up. Furthermore, the average occupancy rate of international tourist hotels in Taiwan significantly different from each other. The phenomena motivate this paper to evaluate the efficiency of international tourist hotels. To accurately examine the efficiency of international tourist hotels in Taiwan, the three-stage DEA approach with the quasi-fixed input is used to eliminate the effects of external factors and random noise on efficiency measures based on the 2003-2009 data conducted by the Annual Operation of the International Tourist Hotels. In the first stage, the data of original variable inputs, quasi-fixed input and outputs are used to evaluate the technical efficiency of international tourist hotels. The efficiency-evaluation results show that the DEA models without quasi-fixed and adjusted inputs overestimate the technical and pure technical efficiencies, but underestimate the scale efficiency of international tourist hotels so that the necessity of considering the existence of quasi-fixed input is justified. The second stage uses SFA model to purge the effects from exogenous 22.
(33) variables and statistical noise. The SFA results show that the exogenous variables have significant influences on input slacks and pure technical efficiency. The degree of market concentration has positive impacts on labor, F&B expense and operating expense input slacks and has a negative impact on pure technical efficiency because international tourist hotels with the lower degree of market concentration may reduce wasted resources under the competitive pressure. A hotel size has positive effects on all input slacks and has a negative effect on pure technical efficiency because the losses from the complexity of allocating resources dominates the gains from sharing or joint utilization. An international tourist hotel in the resort area has negative relationships with all input slacks and a positive relationship with pure technical efficiency because popular visiting spots can help international tourist hotels to attract more visitors, or managers of resort hotels may adopt superior managerial. 政 治 大. strategies to improve their efficiency. An international tourist hotel participating in the international and/or domestic hotel chain has positive relationships with labor and F&B. 立. expense input slacks, but has a negative relationship with the other expense input slack.. ‧ 國. 學. Because marketing chain and technology transfers can help international tourist hotels to attract visitors and obtain the managerial experience, but requiring standard services and. ‧. facilities can cause them to increase more labors and F&B expenses. SARS has positive effects on labor and F&B expense input slacks and has a negative effect on pure technical. sit. y. Nat. efficiency because avoiding SARS infection can cause a decrease in demands for. io. er. accommodation and F&B in international tourist hotels. The financial tsunami has positive effects on labor and other expense input slacks and has a negative effect on pure technical. n. al. i Un. v. efficiency because the uncertainty of economic environment can lead to a decrease in the unnecessary tourism expenditure.. Ch. engchi. After adjusting the variable input data from the SFA results in the second stage, the efficiency-evaluation results in the third stage show that international tourist hotels in Taiwan could reduce inputs by 45.9%, on average, and still produce the same level of outputs. The mean pure technical efficiency measure is 0.990 and the mean scale efficiency measure is 0.546, implying that the technical inefficiency mainly results from the inappropriate production scale. In addition, international tourist hotels have an ample space to improve their technical and scale efficiencies. The efficiency-evaluation results also show that the conventional DEA models overestimate the technical and scale efficiencies, but underestimate the pure technical efficiency of international tourist hotels so that the usage of the three-stage DEA approach is justified. Finally, international tourist hotels which mainly receive group visitors have the worst performance because the better bargaining power of 23.
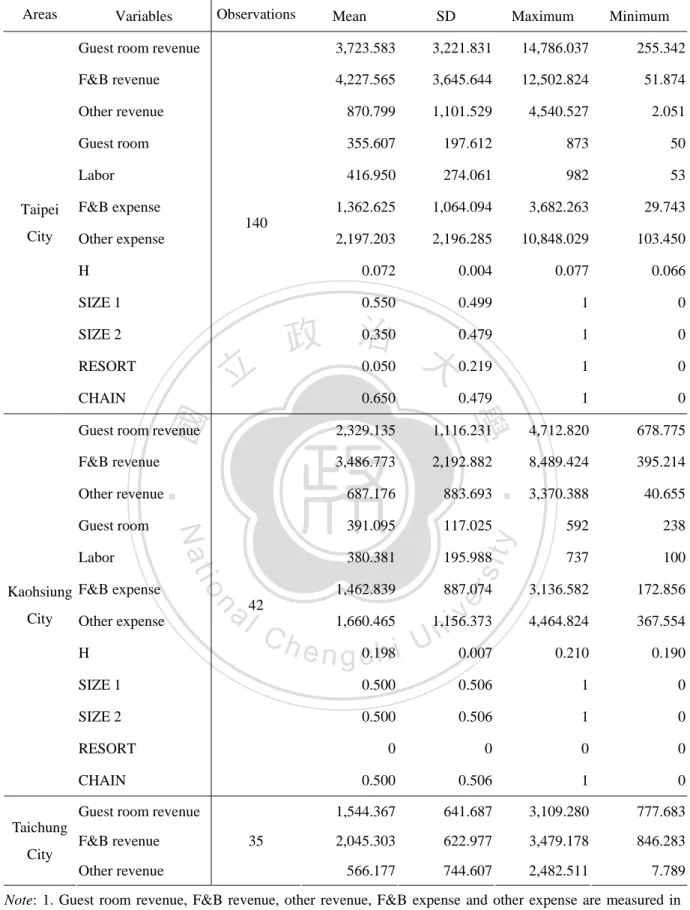
(34) travel agencies can cause international tourist hotels to increase the usage of inputs. Some important lessons may emerge directly from the empirical results in this chapter. First of all, for studies of efficiency to be more informative to decision and policy makers, the three-stage DEA approach with quasi-fixed inputs should be adopted to control the impacts of exogenous factors, statistic noise and quasi-fixed inputs. Second, managers may have to appropriately adjust the operating scale since most of international tourist hotels are still scale inefficient. Third, managers may have to carefully assess the advantage and disadvantage of hotel chains before participating in or developing them. Finally, the information about service qualities, the form of ownership, labor relations and the data of ordinary tourist hotels might be needed for the empirical results to be more reliable and the policy implications to be more meaningful.. 立. 政 治 大. ‧. ‧ 國. 學. n. er. io. sit. y. Nat. al. Ch. engchi. 24. i Un. v.
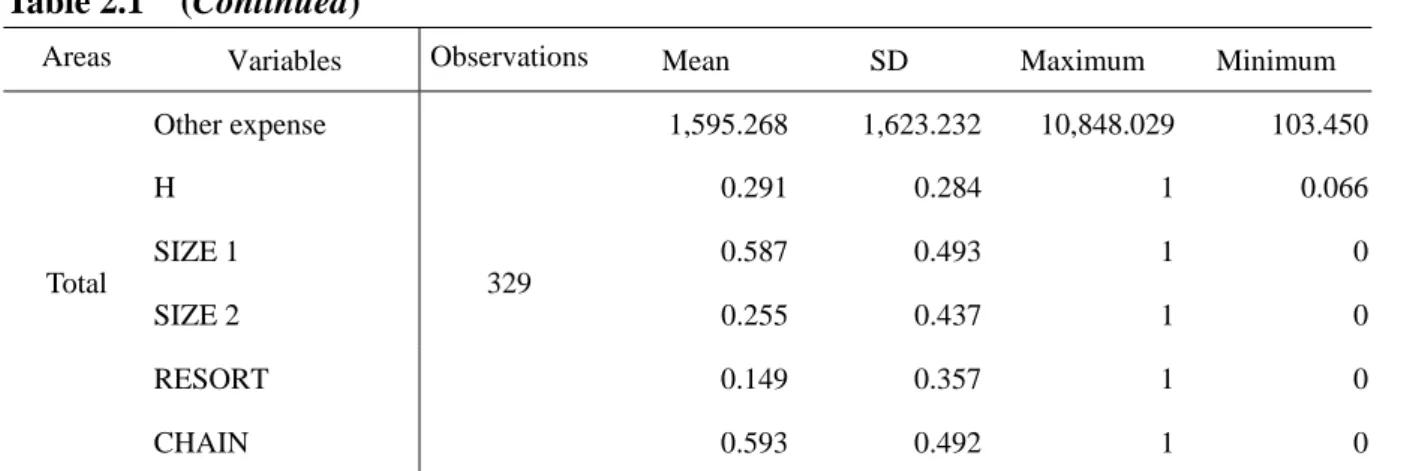
(35) Table 2.1. Descriptive Statistics of Relevant Variables. Areas. Observations. Variables. Mean. SD. Guest room revenue. 3,723.583. 3,221.831. 14,786.037. 255.342. F&B revenue. 4,227.565. 3,645.644. 12,502.824. 51.874. Other revenue. 870.799. 1,101.529. 4,540.527. 2.051. Guest room. 355.607. 197.612. 873. 50. Labor. 416.950. 274.061. 982. 53. 1,362.625. 1,064.094. 3,682.263. 29.743. 2,197.203. 2,196.285. 10,848.029. 103.450. H. 0.072. 0.004. 0.077. 0.066. SIZE 1. 0.550. 0.499. 1. 0. 0.350 0.479 政 治 大 0.219 0.050. 1. 0. 1. 0. 1. 0. Taipei. F&B expense. City. Other expense. 立. 0.479. Guest room revenue. 2,329.135. 1,116.231. 4,712.820. 678.775. F&B revenue. 3,486.773. 2,192.882. 8,489.424. 395.214. Other revenue. 687.176. 883.693. 3,370.388. 40.655. Guest room. 391.095. 117.025. 592. 238. 380.381. 195.988. 737. 100. 1,462.839. 887.074. 3,136.582. 172.856. 1,156.373. 4,464.824. 367.554. 0.007. 0.210. 0.190. io. Kaohsiung F&B expense. al. n Other expense H. 42. Ch. 1,660.465. e n g c0.198 hi. y. i Un. v. SIZE 1. 0.500. 0.506. 1. 0. SIZE 2. 0.500. 0.506. 1. 0. 0. 0. 0. 0. 0.500. 0.506. 1. 0. 1,544.367. 641.687. 3,109.280. 777.683. 2,045.303. 622.977. 3,479.178. 846.283. 566.177. 744.607. 2,482.511. 7.789. RESORT CHAIN Guest room revenue City. sit. Nat. Labor. ‧. ‧ 國. CHAIN. 學. 0.650. er. RESORT. Taichung. Minimum. 140. SIZE 2. City. Maximum. F&B revenue. 35. Other revenue. Note: 1. Guest room revenue, F&B revenue, other revenue, F&B expense and other expense are measured in terms of hundred thousand NT dollars. 2. Guest room reveneue, F&B revenue and other revenue are deflated by the consumer price index with 2006 as the base year. F&B expense and other expense are deflated by the wholesale price index with 2006 as the base year. 25.
(36) Table 2.1. (Continued). Areas. Observations. Variables. Minimum. 93.802. 404. 155. Labor. 259.857. 89.365. 449. 162. F&B expense. 742.620. 203.220. 1,189.266. 430.357. Other expense. 1,108.800. 607.066. 2,649.340. 450.758. 0.223. 0.005. 0.232. 0.216. SIZE 1. 0.600. 0.497. 1. 0. SIZE 2. 0.200. 0.406. 1. 0. 0. 0. 0. 0. 0.571. 0.502. 1. 0. 治 331.368 政 1,265.633 大53.440 744.145. 1,662.908. 752.985. 804.810. 635.629. 25.443. 21.988. 35. H. CHAIN Guest room revenue. 立. F&B revenue. 0.000. 390. 390. 174.571. 11.816. 185. 155. 423.270. 94.993. 579.822. 326.651. 577.957. 166.364. 856.823. 373.214. 7. 0. sit. 1. 1. 1. 0. 1. 1. 0. 0. 0. 0. 0. 0. 0. 0. 0. 0. Guest room revenue. 2,035.166. 506.606. 2,746.688. 1,338.384. F&B revenue. 2,423.542. 1,096.391. 3,925.719. 1,305.056. 557.142. 575.173. 1,748.228. 83.146. Guest room. 229.500. 27.026. 257. 198. Labor. 288.571. 62.790. 374. 220. F&B expense. 784.991. 361.084. 1,238.309. 415.419. H SIZE 1. io. 1. er. Nat. Other expense. 390.000. ‧. Taoyuan F&B expense. 1.056. y. Labor. 23.576. 學. Guest room. ‧ 國. Other revenue. al. n. SIZE 2 RESORT. Ch. 0. e n g c h0i. CHAIN. Hsinchu Other revenue City. Maximum. 271.714. RESORT. City. SD. Guest room. Taichung City. Mean. 14. i Un. v. Note: 1. Guest room revenue, F&B revenue, other revenue, F&B expense and other expense are measured in terms of hundred thousand NT dollars. 2. Guest room reveneue, F&B revenue and other revenue are deflated by the consumer price index with 2006 as the base year. F&B expense and other expense are deflated by the wholesale price index with 2006 as the base year. 26.
(37) Table 2.1. (Continued). Areas. Observations. Variables Other expense. Mean. 2,132.364. 519.069. 0.565. 0.019. 0.595. 0.543. 0.786. 0.426. 1. 0. SIZE 2. 0. 0. 0. 0. RESORT. 0. 0. 0. 0. CHAIN. 1. 0. 1. 1. Guest room revenue. 1,390.102. 723.510. 2,759.915. 745.540. F&B revenue. 1,121.778. 259.730. 1,509.906. 677.846. Other revenue. 57.421. 72.068. 226.865. 0.108. 51.372 治 政 280.714 大79.880 190.191. 343. 221. 306. 100. 840.086. 334.224. RESORT. 430.689. 1,712.497. 271.772. 0.349. 0.009. 0.365. 0.338. 1. 0. 1. 1. 0. 0. 0. 0. 0. 0. 0. 0. 0.483. 1. 0. Nat. SIZE 2. 784.042. io. CHAIN. n. al. 0.333. Guest room revenue F&B revenue. Ch. 1,524.206. e n2,749.402 gchi. y. ‧ 國. SIZE 1. 142.603. 學. Other expense H. 533.895. 21. er. Hualien F&B expense. ‧. 立. Labor. sit. 14. Guest room. 992.131 iv n U. 2,867.378. 390.145. 855.241. 4,184.827. 1,534.876. Other revenue. 252.606. 221.334. 558.004. 41.956. Guest room. 231.571. 82.640. 315. 152. 272.429. 88.938. 374. 179. F&B expense. 1,143.998. 205.843. 1,517.147. 857.243. Other expense. 981.986. 363.306. 1,644.846. 540.997. H. 0.397. 0.082. 0.562. 0.269. SIZE 1. 0.500. 0.519. 1. 0. Tainan City. Minimum. 530.295. Hsinchu SIZE 1. City. Maximum. 1,165.691. H. City. SD. Labor. 14. Note: 1. Guest room revenue, F&B revenue, other revenue, F&B expense and other expense are measured in terms of hundred thousand NT dollars. 2. Guest room reveneue, F&B revenue and other revenue are deflated by the consumer price index with 2006 as the base year. F&B expense and other expense are deflated by the wholesale price index with 2006 as the base year. 27.
(38) Table 2.1. (Continued). Areas. Observations. 0. 0. 0. 0. 0. 0. 0. 0.500. 0.519. 1. 0. 1,464.446. 97.762. 1,602.836. 1,357.690. F&B revenue. 920.820. 201.284. 1,103.530. 543.097. Other revenue. 258.526. 74.616. 373.670. 161.011. Guest room. 276.000. 0.000. 276. 276. Labor. 213.429. 28.118. 240. 166. 338.443. 72.697. 398.732. 184.328. 95.067 治 政 768.185 大 0 1. 884.121. 613.531. 1. 1. 1. 1. 0. 0. 0. 0. 0. 0. 0. 0. 0. 0. 0. Guest room revenue. 361.707. 47.732. 411.718. 266.078. 1,194.060. 141.070. 1,316.305. 930.516. 58.607. 28.974. 122.866. 36.314. 0. 107. 107. 36.206. 235. 128. 402.833. 52.133. 457.317. 324.029. 477.602. 189.555. 856.952. 234.137. H. 1. 0. 1. 1. SIZE 1. 0. 0. 0. 0. SIZE 2. 0. 0. 0. 0. RESORT. 1. 0. 1. 1. CHAIN. 1. 0. 1. 1. 14. RESORT CHAIN Guest room revenue. F&B expense. City. Other expense. 7. 立. H SIZE 1. RESORT CHAIN. 0. Nat. F&B revenue. io. Other revenue. al. n Guest room. Ch. Labor Kaohsiung F&B expense. 0. 學. SIZE 2. 1. 7. Other expense. 107. e n g156.714 chi. y. Taitung. County. Minimum. 0. sit. City. Maximum. ‧. SIZE 2 Tainan. SD. er. Mean. ‧ 國. Variables. i Un. v. Note: 1. Guest room revenue, F&B revenue, other revenue, F&B expense and other expense are measured in terms of hundred thousand NT dollars. 2. Guest room reveneue, F&B revenue and other revenue are deflated by the consumer price index with 2006 as the base year. F&B expense and other expense are deflated by the wholesale price index with 2006 as the base year. 28.
數據
+7
相關文件
This part shows how selling price and variable cost changes affect the unit contribution, break-even point, profit, rate of return and margin of safety?. This is the
Forming the initial ideas as the base of the composition activity, as well as the fundamental
Therefore, this paper bases on the sangha of Kai Yuan Monastery to have a look at the exchange of Buddhist sangha between Taiwan and Fukien since 19th century as well as the
a Called the risk-neutral probability measure... 560 uses the money market account as numeraire... – It expresses the price of any asset relative to the money market account.. 299)
Setting 1997 Q3 as the dividing point, we compare two cases of labor rent: “domestic and foreign labor market” and “domestic labor market”, before and after the minimum wage
This research uses 28 ITHs as the DMUs of DEA to assessment relative operating efficiency of model 1 (input variables are full time employees, cost of labor,
This paper integrates the mechatronics such as: a balance with stylus probe, force actuator, LVT, LVDT, load cell, personal computer, as well as XYZ-stages into a contact-
By clarifying the relationship between IA and the associated indexes as well as the association between IA and the business operating performance, the proposed CICEM
