強關聯量子物質之材料
強關聯量子物質之材料
強關聯量子物質之材料
強關聯量子物質之材料、
、
、界面
、
界面
界面
界面、
、
、
、與其衍生性物理特性研究
與其衍生性物理特性研究--
與其衍生性物理特性研究
與其衍生性物理特性研究
--
--子計畫二
--
子計畫二
子計畫二:
子計畫二
::
:
量子體物性的基礎研究與控制
量子體物性的基礎研究與控制
量子體物性的基礎研究與控制
量子體物性的基礎研究與控制(
((
(第三年
第三年
第三年
第三年)
))
)
計畫類別:□個別型計畫 ■整合型計畫
計畫編號: NSC 98-2112-M-009-005-MY3
執行期間:98年8月1日至102年7月31日
計畫主持人:林俊源
計畫參與人員:溫智匡、施沛姍
成果報告類型(依經費核定清單規定繳交):□精簡報告 ■完整報告
處理方式:除產學合作研究計畫、提升產業技術及人才培育研究計畫、列管計畫
及下列情形者,得立即公開查詢
執行單位:國立交通大學物理研究所
中 華 民 國 102 年 6 月 19 日
行政院國家科學委員會補助專題研究計畫
行政院國家科學委員會補助專題研究計畫
行政院國家科學委員會補助專題研究計畫
行政院國家科學委員會補助專題研究計畫
■
■
■
■成果報告
成果報告
成果報告
成果報告
□
□
□
□期中進度報告
期中進度報告
期中進度報告
期中進度報告
Part-1
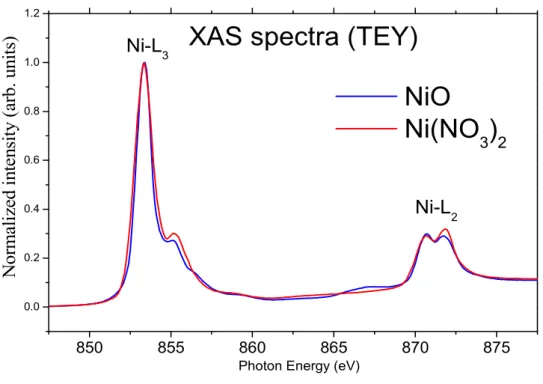
X-ray absorption near edge spectroscopy (XANES) was employed to study the valence and spin degree of freedom of transition metal ions in materials.
For the case of Ni(NO3)2, the Ni L-edge spectrum indicates divalence nickel in
Ni(NO3)2 compounds. Combined with the theoretical calculations, we confirm that the
divalent nickel exhibits the high spin state (S=1) in Ni(NO3)2. In the study, NiO
(Ni2+, S=1) was used as the standard sample. The spectrum shape differences between NiO and Ni(NO3)2 come from the different local environments.
Moreover, we measured room temperature Mn K, L2,3-edge and Co K, L2,3-edge and temperature dependent Co L2,3-edge XANES spectra in PrSrCoMnO6 double
perovskites. Our spectra show the Co3+/Mn4+ ionic state in PrSrCoMnO6. With the
help of theoretical calculations, we found that the crystal field in CoO6 octahedral is
close to the HS-LS transition boundary. The crystal structure in PrSrCoMnO6 was
solved at T=300 K and T=12 K, respectively. PrSrCoMnO6 shows an unusual lattice
change at low temperatures. The lattice volume and the average Mn-O bond length decrease, but the average Co-O bond length increases at low temperatures. We also find there is a close relationship between CoO6 local environment and Co L-edge
spectra line shape. The temperature dependent Co L-edge XAS spectra of PrSrCoMnO6 obviously demonstrate the spin state variation with T, which can be
described as the combination of a LS ground state and the triply degenerate HS first excited states. 850 855 860 865 870 875 0.0 0.2 0.4 0.6 0.8 1.0 1.2 N o rm al iz ed i n te n si ty ( ar b . u n it s)
Ni-L
2Photon Energy (eV)
NiO
Ni(NO
3)
2XAS spectra (TEY)
Ni-L
3850 855 860 865 870 875 0.0 0.2 0.4 0.6 0.8 1.0 1.2 1.4 1.6
N
o
rm
al
iz
ed
i
n
te
n
si
ty
(
ar
b
.
u
n
it
s)
Ni-L2Ni L-edge XAS data with LFM calculation
Photon Energy (eV)
NiO exp. LF. 10Dq=1.0 eV ,△△△△ eg=0 eV Ni(NO3)2 exp. LF. 10Dq=0.9 eV ,△△△△ eg=0.7 eV Ni-L3
Fig. 2. Nickel L2,3 edge XAS data with ligand field model calculations.
850 855 860 865 870 875 0.0 0.2 0.4 0.6 0.8 1.0 1.2 1.4 1.6
N
o
rm
al
iz
ed
i
n
te
n
si
ty
(
ar
b
.
u
n
it
s)
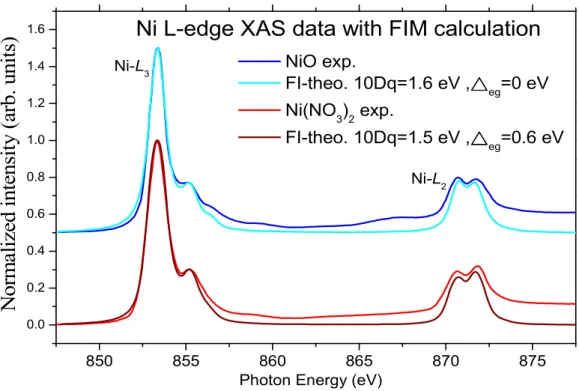
Ni-L2Photon Energy (eV)
NiO exp.
FI-theo. 10Dq=1.6 eV ,△△△△eg=0 eV Ni(NO3)2 exp.
FI-theo. 10Dq=1.5 eV ,△△△△
eg=0.6 eV
Ni L-edge XAS data with FIM calculation
Ni-L3
the XAS spectra shows the divalence nickel in Ni(NO3)2 compound. Combine
with the theoretical calculation, we assume that the divalence nickel shows a high spin state S=1 in Ni(NO3)2, same as NiO. The spectrum shape differences between NiO
and Ni(NO3)2 come from the different local environments.
On the other hand, very recently, O. Volkova et al. [1] measured magnetization measurement under magnetic field as shown in Fig. 3, the obtained value of saturation moment amounts about 2.03 µB/f.u. which is very close to the theoretical one MS =
ngSµB = 2.15 µB/f.u. for Ni2+, S=1, which is consistent to our simulations.
0
2
4
6
8
0.0 0.5 1.0 1.5 2.0theoretical : MS = 2.15 µB/f.u. for Ni2+, S=1
Ni(NO
3)
2M
(
µ B/f
.u
.)
B (Tesla)M
S~ 2.03
µ
Bmeasured at T=2 K
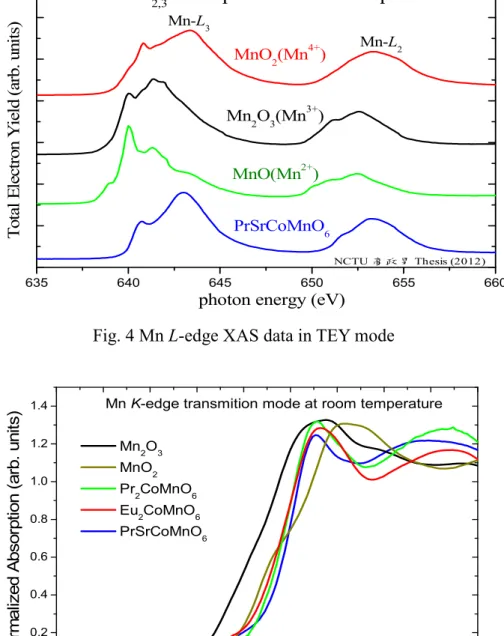
Room temperature Mn L-edge XAS data was recorded in total electron yield (TEY) mode (see Fig.4). In the previous work, which shows the PrSrCoMnO6 sample
has a similar spectra shape and energy position with MnO2, we infer that the valence
on manganese ion should be Mn4+.
Room temperature Mn K-edge XAS was recorded in the transmission mode. The edge position is sensitive to Mn valence in the K-edge spectra, which also represents the Mn4+ in PrSrCoMnO6 sample (see Fig.5), same as those Mn4+ in Eu2CoMnO6 and
La2CoMnO6 double perovskite[2,3,4].
635 640 645 650 655 660 NCTU 高政 男 Thesis (2012) PrSrCoMnO6 Mn-L 3 Mn-L 2
Mn-L2,3XAS spectra at room temperature
T o ta l E le ct ro n Y ie ld ( ar b . u n it s) MnO(Mn2+) Mn2O3(Mn3+)
photon energy (eV)
MnO2(Mn4+)
Fig. 4 Mn L-edge XAS data in TEY mode
6530 6535 6540 6545 6550 6555 6560 6565 6570 6575 0.0 0.2 0.4 0.6 0.8 1.0 1.2 1.4 NCTU 高 政 男 Thesis (2012) Mn2O3 MnO2 Pr 2CoMnO6 Eu2CoMnO6 PrSrCoMnO6
Mn K-edge transmition mode at room temperature
Photon Energy (eV)
N o rm a liz e d A b s o rp ti o n ( a rb . u n it s )
In Co K-edge, room temperature XAS was recorded in the transmission mode from BL.17C in NSRRC Taiwan, as shown in Fig.6. The K-edge XAS spectra is very sensitive to the valence of transition metal ions. Compare with other reference spectra, we find the PrSrCoMnO6 spectrum is very similar to EuCoO3, and we infer that the
cobalt ions are also trivalence in PrSrCoMnO6 sample.
7700 7710 7720 7730 7740 7750 7760 7770 7780 0.0 0.5 1.0 1.5 NCTU 高政男 Thesis (2012) CoO (Co+2) Co3O4 (Co+2.67) EuCoO3 PrSrCoMnO6 -300 K N o rm a liz e d A b s o rp ti o n ( a rb . u n it s )
Photon Energy (eV)
Co K-edge XAS , Transmission mode
Fig.6. Co K-edge XAS spectra in transmission mode
775 780 785 790 795 800
PrSrCoMnO
6Sr
2CoO
3Cl
(Co
3+HS)
EuCoO
3(Co
3+LS)
CoO
(Co
2+)
Co-L2 Co-L3T
o
ta
l
E
le
ct
ro
n
Y
ie
ld
(
ar
b
.
u
n
it
s)
Co-L
2,3XAS spectra at room temperature
Photon Energy (eV)
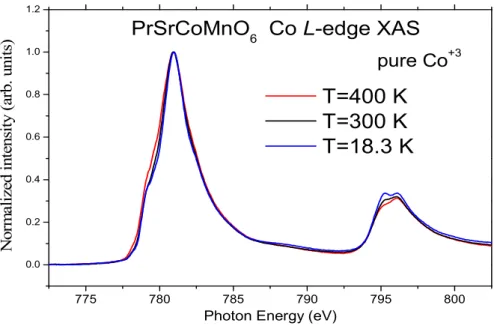
775 780 785 790 795 800 0.0 0.2 0.4 0.6 0.8 1.0 1.2
N
o
rm
al
iz
ed
i
n
te
n
si
ty
(
ar
b
.
u
n
it
s)
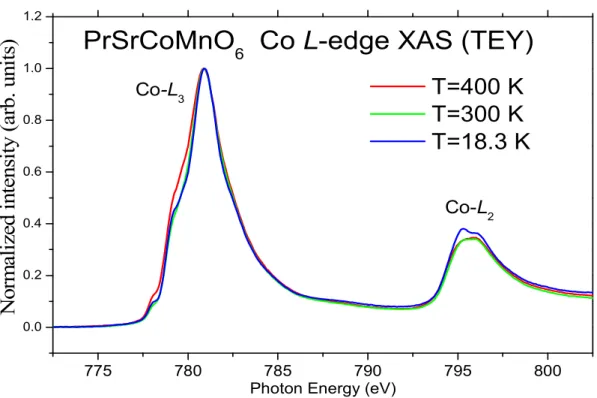
Co-L 2T=400 K
T=300 K
T=18.3 K
Photon Energy (eV)
PrSrCoMnO
6
Co L-edge XAS (TEY)
Co-L3
Fig. 8 Temperature dependent Co L-edge XAS spactra on PrSrCoMnO6 sample
We focus on the L3-edge first, there shows a shoulder characteristic in the lower
energy range, which is the contribution from Co3+ HS state. As the temperature increasing, the shoulder intensity also increases. We infer that the HS population increases with temperature increasing. Now turn to the L2-edge, there shows a peak at
795eV which come from Co3+ LS spectra. As the temperature increasing, we saw the peak intensity become lower. We infer that the LS population decreases with the temperature increasing, this result consists with that in the L3-edge. Up to now, we
assume that the Co3+ ions in PrSrCoMnO6 sample is an HS-LS mixed-spin state
We infer that the cobalt ion in PrSrCoMnO6 sample is a HS-LS mixed system,
which has a LS ground state and the triply degenerate HS 1st exciting states, and the higher HS population, which come from the thermal excitation, presence more at high temperature. 775 780 785 790 795 800 0.0 0.2 0.4 0.6 0.8 1.0 1.2 N o rm al iz ed i n te n si ty ( ar b . u n it s)
PrSrCoMnO
6Co L-edge XAS
T=400 K
T=300 K
T=18.3 K
Photon Energy (eV)
pure Co+3
Fig 9 Temperature dependent Co3+ L-edge XAS spectra.
775 780 785 790 795 800
N
o
rm
al
iz
ed
i
n
te
n
si
ty
(
ar
b
.
u
n
it
s)
Co-L2Photon energy (eV)
exp. T=400 K theo. 10Dq=0.495 eV exp. T=300 K theo. 10Dq=0.495 eV exp. T=18.3 K theo. 10Dq=0.4743 eV
Co L-edge XAS data(TEY) on PrSrCoMnO6
Co-L 3
Fig 10 Co L-edge XAS experiment data with theoretical calculation (setting the fitting temperature parameter equals to real experiment conditoin).
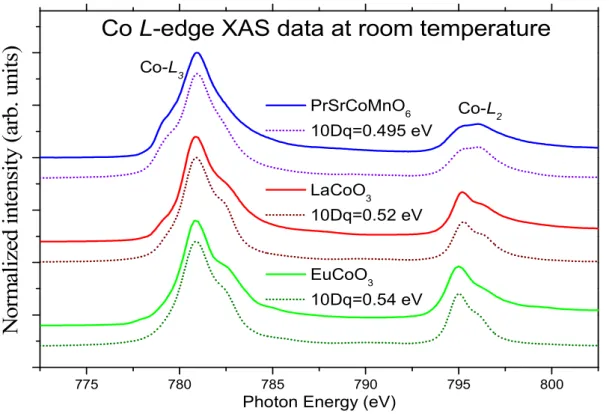
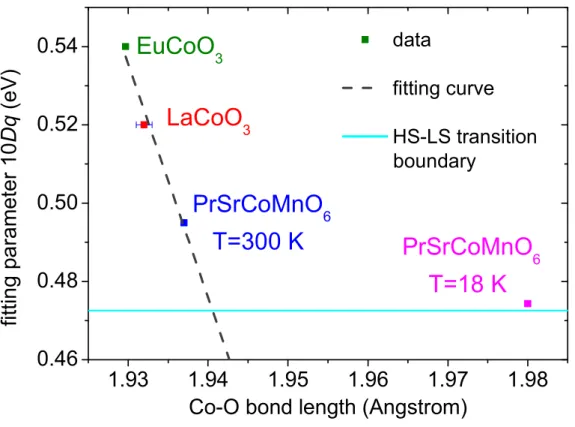
At the end, we also fit the room temperature Co L-edge XAS spectra in different samples. The fitting parameter 10Dq=0.495 eV shows the best fit to PrSrCoMnO6,
while the 10Dq=0.52 eV can fit LaCoO3 well and 10Dq=0.54 eV can fit EuCoO3 at
room temperature (see Fig.11). Compare the average Co-O bond length with the fitting parameter 10Dq in each sample, we obviously see the fitting parameter 10Dq (point charge crystal field in octahedral symmetry) decreasing with the increasing of average Co-O bond length as shown in Fig.12. The gray dash curve shows the linear fit of room temperature cases, and the light blue curve shows the Co3+ ground state HS-LS transition boundary 10Dq=0.47258 eV calculated from XTLS software.
Compare with EuCoO3 and LaCoO3, PrSrCoMnO6 has the largest average Co-O
bond length and the smallest crystal field on Co3+ ions in the CoO6 coordination, and
the crystal field in PrSrCoMnO6 is much closer to the HS-LS transition boundary,
especially in the low temperature.
775 780 785 790 795 800
N
o
rm
al
iz
ed
i
n
te
n
si
ty
(
ar
b
.
u
n
it
s)
Co-L2 Co-L3Co L-edge XAS data at room temperature
PrSrCoMnO6 10Dq=0.495 eV LaCoO 3 10Dq=0.52 eV EuCoO3 10Dq=0.54 eV
Photon Energy (eV)
Table 1 The comparison of average Co-O bond length with the fitting parameter 10Dq in different Co3+ samples.
1.93
1.94
1.95
1.96
1.97
1.98
0.46
0.48
0.50
0.52
0.54
PrSrCoMnO
6T=18 K
PrSrCoMnO
6T=300 K
LaCoO
3fi
tt
in
g
p
a
ra
m
e
te
r
1
0
D
q
(
e
V
)
Co-O bond length (Angstrom)
data
fitting curve
HS-LS transition
boundary
EuCoO
3Fig. 12 The relationship between the fitting parameter 10Dq with the average Co-O bond length in different Co3+ samples.
參考條目
參考條目
參考條目
參考條目
[1] O. Volkova, E. Deeva, I. Morozov, V. Mazurenko, I. Solovyev, J.-Y. Lin, C.K. Wen, R. Klingeler, B. Büchner, and A. Vasiliev, unpoblished
[2] N. Vasiliev, O. S. Volkova, L. S. Lobanovskii, I. O. Troyanchuk, Z. Hu, L. H. Tjeng, D. I. Khomskii, H.-J. Lin, C. T. Chen, N. Tristan, F. Kretzschmar, R.Klingeler,6and B. Büchner, PHYSICAL REVIEW B 77, 104442 (2008).
[3] T. Burnus , O. S. Volkova, L. S. Lobanovskii, I. O. Troyanchuk, Z. Hu, L. H. Tjeng, D. I. Khomskii, H.-J. Lin, C. T. Chen, N. Tristan, F. Kretzschmar, R. Klingeler, and B. Büchner, PHYSICAL REVIEW B 77, 125124 (2008).
[4] 高政男,碩士論文,"以吸收光譜研究鈣鈦礦結構中鈷氧化物自旋態與鈷離 子價數",國立交通大學,(2012)。
Part-2
In 2004, E. Bauer[1] discovered the first heavy fermion superconductor without inversion symmetry. According to the literature, CePt3Si is not excluding spin-triplet
pairing completely. At the same year, from the theatrical calculation[2], the superconductivity in non-centrosymmetric material exhibits intriguing properties due to a spin degeneracy splitting of Fermi surface is observed by spin-orbit coupling. Superconducting order parameter does not obey parity conservation anymore, it becomes possible for comprising of a mixing of spin-singlet and spin-triplet that is also known as a simplest form in mixture of s-wave and p-wave. In general, reducing the effect of Coulomb repulsion may display nodes in energy gap.
The strong electronic correlation system involves f-electron, like CePt3Si and
pressure-induced superconductors, e.g. CeTX3 (T=Co, Rh, Ir; X=Si, Ge) and UIr,
indeed, the presence of an unconventional order parameter in these non-centrosymmetric materials. For CePt3Si, in particular, line node in energy gap is
proven from the experiment of the thermal conductivity[3], penetration depth[4] and specific heat[5]. On the other hand, these non-centrosymmetric superconductors without heavy fermion features are attracted more attention, the pairing state of most weakly electronic correlation systems are s-wave which include Mg12-δIr19B16[6][7]
R2C3-y (R=La, Y), T2Ga9 (T=Rh, Ir, Pt), LaPt3Si, AMSi3 (A=Ba, Ca, La; M=Rh, Ir, Pt),
Li2(Pd1−xPtx)3B, Ru7B3, Nb0.18Re0.82[8]Re3W[9][10] Re24Nb5[11]owever, there are
some agreements in order parameter: for instance, evidences provide different results for R2C3-y (R=La, Y)[17][18], BiPd, Mo3Al2C4[12-14], Mg12-δIr19B16[19][20], and
Li2(Pd1−xPtx)3B beyond the component x=0.8.
Such strong spin-orbit coupling system as topological insulators, the solid has bulk insulator states and surface conducting states consisting of Majorana fermions[21], which is its own antiparticle that is characteristic of Bosons, and expected to appear at the edge of the vortex in topological insulators. Most of the theoretical proposals for the Majorana fermions are based on p-wave pairing in the one-dimensional spinless fermions and the p+ip pairing superconductor[22]. So far, some groups suggest the mixing pairing states exist due to impurity effect enhances spin-orbit coupling[7][14], nevertheless, no one actually finds it in superconductors. Thus, we are going to search for the proportion of p-wave in non-centrosymmetric superconductors with binary α-Mn structure by measuring specific heat.
Specific Heat Result
Re
24Ti
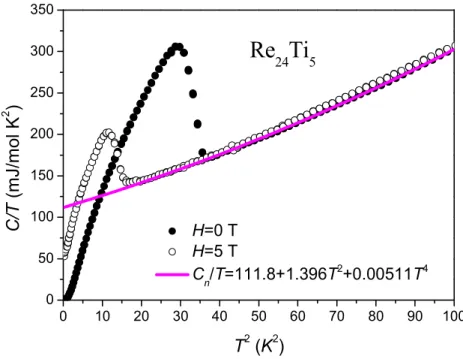
5The specific heat data in Figure 1 lotted as vs. shows the
superconducting state and normal state. The normal specific heat usually is expressed as sum of electronic contribution and phonon contribution,
where represents the electronic term due to free charge carriers, and depicts phonon contribution is assumed to be independent of the magnetic field.
It is found an extrapolation of fitting normal state to , then we can
determine the and the other fitting parameters. We also
calculated Debye temperature from equation (2-12).
We can directly observe the transition temperature and
dimensionless specific jump in superconducting state which reveals
an incontinuous phenomenon in specific heat. is larger than the theoretical value of 1.43 that suggests a moderately enhanced electron-phonon coupling.
In the following function[16], we can estimate the electron-phonon constant .
According to McMillan model, for weak coupling , for weak and intermediate
coupling , and for strong coupling . Therefore, the present
value implies that our samples are a moderate coupling superconductor rather than a weak coupling one. The result is consistent with specific jump.
(4-1)
0 10 20 30 40 50 60 70 80 90 100 0 50 100 150 200 250 300 350 T2 (K2) H=0 T H=5 T Cn/T=111.8+1.396T2+0.00511T4 C /T ( m J /m o l K 2 )
Re
24Ti
5Figure 1 Specific heat of Re24Ti5 and the pink line is its normal state.
0 1 2 3 4 5 6 7 0 50 100 150 200 250 300 C e s /T ( m J /m o l K 2 ) Tc=5.74 K 2∆/kBTc=3.68
Re
24Ti
5 T (K) 0 1 2 3 4 5 6 7 -250 -200 -150 -100 -50 0 ∆ S ( m J /m o l K ) T (K)Figure 2 The black solid is superconducting electronic conurbation of Re24Ti5 with isotropic s-wave
fitting(red line).
Inset: the entropy conservation for the superconducting phase transition.
The superconducting electronic contribution is shown in Figure 2, we calculate it
s-wave. In addition, superconducting phase transition is second order that has to obey
entropy conservation around transition temperature.
In the light of specific heat data(which in reference 27), we found the critical temperature for each corresponding magnetic field and plotted them as Figure 3.
0 1 2 3 4 5 6 0 2 4 6 8 10 12 T (K)
WHH
Hc2(0)=10.75 T H c 2 ( T )Re
24Ti
5Figure 3 Temperature dependence of upper critical fields of Re24Ti5[15], and the red curve is from
Werthamer-Helfand-Hohenberg (WHH) theory.Re21.75Ta7.25
In Figure 4, the specific heat of Re21.75Ta7.25 plotted as vs. . The normal
state is derived from equation (4-1) and the superconducting state is also obtained by
the formula, which complies with entropy balance
0 10 20 30 40 50 60 70 80 90 100 0 50 100 150 200 250 300 350
Re
21.75Ta
7.25 H=0 T H=9 T Cn/T=101.3+1.6385T2+0.00426T4 C /T ( m J /m o l K 2 ) T2 (K2)Figure 4 The specific heat of Re21.75Ta7.25, and the pink line is the normal state.
0 1 2 3 4 5 6 0 50 100 150 200 250 300
Re
21.75Ta
7.25 Tc=4.96 K 2∆/kBTc=3.7 C e s /T ( m J /m o l K 2 ) T (K) 0 1 2 3 4 5 6 -200 -150 -100 -50 0 ∆ S ( m J /m o l K ) T (K)Figure 5 The black solid is superconducting electronic conurbation of Re21.75Ta7.25 with isotropic s-wave fitting(red line).
Inset: the entropy balance for the superconducting phase transition.
transition temperature , Debye temperature , furthermore,
specific jump and electron-phonon coupling .
4.1.3 Re
24.9Hf
4.1Follow the discussion of section 4.1.1 and 4.1.2, the specific heat of Re24.9Hf4.1 is
plotted as vs. and shown in Figure 6. The normal state is fitted by equation (4-1) and the electronic superconducting specific heat is fitted by s-wave, further, the second phase transition compels the existence of entropy conversation, as Figure 7 with different order parameter. On the basis of equation (2-12) and (4-2), we obtained following parameters of Re24.9Hf4.1: , , then,
and .
For the sake of accurately analyzing Re24.9Hf4.1, we measured its specific heat
with different magnetic field. There are two ways to find the upper critical field at zero temperature, one is using the applied magnetic field vs. transition temperature, and the other one is plotting vs. magnetic field. As Figure 8, first, taking a
interception of linear fit to in a figure as vs. below except
for , and the upper critical field is the intersection point between the linear fit
of which passing through origin and . In another way, we
made use of Werthamer-Helfand-Hohenberg (WHH) theory without impurity scattering ( ) and spin-orbit scattering ( ) to fit the data of the applied magnetic field vs. its corresponding transition temperature, and it is shown in Figure 9.
0 10 20 30 40 50 60 70 80 90 100 0 50 100 150 200 250 300 350 H=0 T H=2 T H=7 T H=0.5 T H=3 T H=8 T H=1 T H=5 T H=9 T Cn/T=107T+1.4993T2+0.004524T4 C /T ( m J /m o l K 2 ) T2 (K2)
Re
24.9Hf
4.1Figure 6 The specific heat of Re24.9Hf4.1, and the pink line is the normal state.
0 1 2 3 4 5 6 7 0 50 100 150 200 250 300 Tc=5.54 K 2∆/k BTc=3.69 C e s /T ( m J /m o l K 2 ) T (K)
Re
24.9Hf
4.1 0 1 2 3 4 5 6 7-250 -200 -150 -100 -50 0 ∆ S ( m J /m o l K ) T (K)Figure 7 The black solid is superconducting electronic conurbation of Re24.9Hf4.1 with isotropic s-wave
fitting(red line).
0.0 0.4 0.8 1.2 1.6 2.0 2.4 2.8 0 20 40 60 80 100 120 140 H=0.5 T H=1 T H=2 T H=3 T H=5 T C /T ( m J /m o l K 2 ) H=7 T H=0 T T2
(
K2)
Re
24.9Hf
4.1 0 1 2 3 4 5 6 7 8 9 10 0 20 40 60 80 100 120Re
24.9Hf
4.1 γn γ ( m J /m o l K 2 ) H (T) Hc2(0)=9.84 ± 0.60 TFigure 8 For Re24.9Hf4.1, (a) has been derived from the liner extrapolation of data at low
temperatures using vs. . (b)Magnetic field dependence of electronic specific heat coefficient,
where the dash line is and the red solid line indicates a linear fit. (b)
0 1 2 3 4 5 6 0 2 4 6 8 10
WHH
H c 2 ( T ) T (K) Hc2(0)=9.01 ± 0.22 TRe
24.9Hf
5.1Figure 9 Temperature dependence of upper critical fields of Re24.9Hf4.1, and the red curve is from WHH
theory.
From the behavior of specific heat, the order parameter will be s-wave, but, in the above introduction, we know the possible order parameter of non-centrosymmetric superconductors is two-gap or anisotropic gap from theatrical calculation. In order to ascertain which fitting is the best, we calculated the chi-square and presented the highly probable fitting results in Figure 10.
We present all the parameters are listed in Table III and Table IV. Even we can describe the specific heat as two-gap and anisotropic gap by the mathematically numerical analysis, but, does it have physical meaning? So, we have to check superconductor within which limit.
Figure 10 The black solid is superconducting electronic conurbation of (a)Re24Ti5, (b)Re21.75Ta7.25 and
(c)Re24.9Hf4.1 with isotropic s-wave fitting(red line), two-gap fitting(blue line) and anisotropic
fitting(light green light).
(a) (b) (c) 0 50 100 150 200 250 300 isotropic s-wave, 2∆/kBTc=3.68 two-gap, 2∆ 1/kBTc=3.87, 2∆2/kBTc=3.5 anisotropic gap, 2∆/kBTc=3.68, α=0.070±0.025 C e s /T ( m J /m o l K 2 ) Tc=5.74 K
Re
24Ti
5 0 50 100 150 200 250Re
21.75Ta
7.25 Tc=4.96 K isotropic s-wave, 2∆/kBTc=3.7 anisotropic gap, 2∆/kBTc=3.7, α=0.149±0.033 C e s /T ( m J /m o l K 2 ) 0.0 0.2 0.4 0.6 0.8 1.0 1.2 0 50 100 150 200 250Re
24.9Ti
4.1 isotropic s-wave, 2∆/kBTc=3.69 two-gap, 2∆ 1/kBTc=3.97, 2∆2/kBTc=3.41 anisotropic gap, 2∆/k BTc=3.69, α=0.106±0.015 Tc=5.54 K C e s /T ( m J /m o l K 2 ) T/TcTable III: A comparison of several important parameters for non-centrosymmetric super-conductors with α-Mn structure.
Parameters Re24Ti5 Re21.75Ta7.25 Re24.9Hf4.1 5.74 4.96 5.54 111.8 101.3 107 343 325 335 1.60 1.52 1.55 0.45 0.32 0.37 from WHH 10.75 < 9 9.01 ± 0.22 from 9.84 ± 0.6 2.7 < 2.61 2.34 from WHH 55.3 > 60.4 60.4 ± 0.7 from 57.8 ± 1.8
Table IV: The energy gap of fits.
Order parameter Re24Ti5 Re21.75Ta7.25 Re24.9Hf4.1 Isotropic s-wave 3.68 ± 0.01 3.70 ± 0.07 3.69 Two-gap 3.68 0.18 --- 3.69 0.28 Anisotropic gap 3.68 ± 0.01 0.070 ± 0.025 3.70 0.149 ± 0.033 3.69 0.106 ± 0.015
Dirty or Clean Limit?
The Transport Measurements
The function of mean free path is , where is the Fermi velocity and
the relaxation time from Drude model. We used equation (2-6) to
estimate Fermi energy , for Re24Ti5, for Re21.75Ta7.25,
for Re24.9Hf4.1 and figure out the corresponding Fermi velocity
, , and
respectively.
Then we used van der Pauw to measure the resistances and calculated their resistivity by equation (3-8), which reveals the relation to average resistance and thickness. After that, changing the configuration of samples and measuring the Hall coefficient, taking for room temperature to derive the carrier concentration . We observed that the Hall coefficient varies with the temperature, which is shown in Figure 13.
We estimated the mean free path of our samples, which is listed in Table VI and
shorter than coherence length . It implies these superconductors within the contexts of dirty limit, in principle, the multi-gap fitting loses the physical meaning in this kind of situation.
Because the contributions of resistivity including impurity and grain boundary, assume the for Re21.75Ta7.25 and calculate its residual
resistivity by the equation[23]:
In the same way, the residual resistivity of Re24Ti5 and Re24.9Hf4.1 are and
. The measured resistivity is in the same order with residual resistivity, the contribution to resistivity is almost from the residual resistivity.
Table V: Hall coefficient of non-centrosymmetric superconductors in the unit of .
Temperature Re24Ti5 Re21.8Ta7.2 Re24.9Hf4.1 20 K * 100 K 200 K 300 K 0.0 2.0x10⁻⁷ 4.0x10⁻⁷ 6.0x10⁻⁷ 8.0x10⁻⁷ 1.0x10⁻⁶ a v e ra g e r e s is ta n c e ( Ω ) 0.0 4.0x10⁻⁷ 8.0x10⁻⁷ 1.2x10⁻⁶ 1.6x10⁻⁶ 2.0x10⁻⁶ a v e ra g e r e s is ta n c e ( Ω ) 0 1 2 3 4 0.0 4.0x10⁻⁷ 8.0x10⁻⁷ 1.2x10⁻⁶ 1.6x10⁻⁶ T=300 K T=200 K T=100 K H (T) T=20 K
Re
24Ti
5 0 1 2 3 4 5 0.0 4.0x10⁻⁷ 8.0x10⁻⁷ 1.2x10⁻⁶ 1.6x10⁻⁶ (a)0.0 1.0x10⁻⁷ 2.0x10⁻⁷ 3.0x10⁻⁷ 4.0x10⁻⁷ a v e ra g e r e s is ta n c e ( Ω ) 0.0 1.0x10⁻⁷ 2.0x10⁻⁷ 3.0x10⁻⁷ 4.0x10⁻⁷ a v e ra g e r e s is ta n c e ( Ω ) 0 1 2 0.0 1.0x10⁻⁷ 2.0x10⁻⁷ 3.0x10⁻⁷ 4.0x10⁻⁷
Re
21.75Ta
7.25 H (T) 0 1 2 3 0.0 1.0x10⁻⁷ 2.0x10⁻⁷ 3.0x10⁻⁷ 4.0x10⁻⁷ T=200 K T=300 K T=100 K T=10 K 0.0 5.0x10⁻⁷ 1.0x10⁻⁶ 1.5x10⁻⁶ 2.0x10⁻⁶ 2.5x10⁻⁶ a v e ra g e r e s is ta n c e ( Ω ) 0.0 1.0x10⁻⁷ 2.0x10⁻⁷ 3.0x10⁻⁷ 4.0x10⁻⁷ a v e ra g e r e s is ta n c e ( Ω ) 0.0 0.5 1.0 1.5 0.0 1.0x10⁻⁷ 2.0x10⁻⁷ 3.0x10⁻⁷ 4.0x10⁻⁷ 5.0x10⁻⁷Re
24.9Hf
4.1 H (T) 0.0 0.5 1.0 1.5 2.0 0.0 2.0x10⁻⁷ 4.0x10⁻⁷ 6.0x10⁻⁷ 8.0x10⁻⁷ T=200 K T=300 K T=100 K T=20 KFigure 4-11 The Hall voltage vs. magnetic fields of (a)Re24Ti5, (b)Re21.75Ta7.25 and
(c)Re24.9Hf4.1 with different temperatures.
(b)
Table VI: Several important parameters of non-centrosymmetric superconductors. Parameter Re24Ti5 Re21.75Ta7.25 Re24.9Hf4.1 125.5 136 148.9 144.06 < 153.3 130.56 7.08 9.84 7.13 5.23 3.46 2.43 10.75 < 9 9.01 ± 0.22 2.7 < 2.61 2.34 55.3 > 60.4 60.4 ± 0.7
Figure 12 The resistivity vs. temperature of (a)Re24Ti5, (b)Re21.75Ta7.25, and (c)Re24.9Hf4.1.
Insert: zoom in the lower temperature region. (a) (c) 0 20 40 60 80 100 120 140 0 4 8 12 16 20 0 40 80 120 ρ ( µ Ω c m )
Re
24Ti
5 ρ ( µ Ω c m ) T (K) 0 50 100 150 200 250 300 0 20 40 60 80 100 120 140 160 0 4 8 12 16 20 0 40 80 120 160Re
24.9Hf
4.1 ρ ( µ Ω c m ) T (K) ρ (µ Ω c m ) T (K) 0 20 40 60 80 100 120 140 0 4 8 12 16 20 0 40 80 120 160 ρ ( µ Ω c m )Re
3Ta
ρ ( µ Ω c m ) T (K) (b)Figure 13 Hall coefficient vs. temperature of (a)Re24Ti5, (b)Re21.75Ta7.25, and (c)Re24.9Hf4.1. 0.0 2.0x10⁻⁵ 4.0x10⁻⁵ 6.0x10⁻⁵ 8.0x10⁻⁵ 1.0x10⁻⁴ R H ( c m 3 /C )
Re
24Ti
5 0.0 1.0x10⁻⁵ 2.0x10⁻⁵ 3.0x10⁻⁵ 4.0x10⁻⁵ R H ( c m 3 /C )Re
21.75Ta
7.25 0 50 100 150 200 250 300 0.0 4.0x10⁻⁵ 8.0x10⁻⁵ 1.2x10⁻⁴ 1.6x10⁻⁴ R H ( c m 3 /C ) T (K)Re
24.9Hf
4.1The Case of MgB
2One of its specific heat measurements points it out that MgB2 cannot be defined
by single gap and its magnetic field dependence of electronic specific heat coefficient is not proportion to or [26]. All the evidences reveal that MgB2 is the
multigap nature of the superconducting state. Although multigap superconductor should be clean limit, MgB2 proved to be in the dirty limit[24][25]. Obviously, our
fittings would be a reference. There is no denying that our samples may be two-gap or anisotropic gap.
Figure 14 vs. . The dashed lines are determined by the conservation of entropy around the
anomaly and used to estimate .
Figure 15 The magnetic field dependence of . The dashed line is a fit to the power law[26].
參考文獻
[1] M. Yogi, Y. Kitaoka, S. Hashimoto, T. Yasuda, R. Settai, T. D. Matsuda, Y. Haga, Y. Ōnuki, P. Rogl, and E. Bauer, Phys. Rev. Lett. 92, 027003 (2004).
[2] P. A. Frigeri, D. F. Agterberg, A. Koga, and M. Sigrist, Phys. Rev. Lett. 92, 097001 (2004).
[3] K. Izawa, Y. Kasahara, Y. Matsuda, K. Behnia, T. Yasuda, R. Settai, and Y. Onuki, Phys. Rev. Lett. 94, 197002 (2005).
[4] I. Bonalde, W. Brämer-Escamilla, and E. Bauer, Phys. Rev. Lett. 94, 207002 (2005).
[5] Serdar Sakarya, William Knafo, Niels H. Van Dijk, Yingkai Huang, Karel Prokes, Christoph Meingast, and Hilbert Von Löhneysen, Journal of the Physical Society of Japan 76, 014702 (2007).
[6] Rikiya Yoshida, Hiroyuki Okazaki, Keisuke Iwai, Kengo Noami, Takayuki Muro, Mario Okawa, Kyoko Ishizaka, Shik Shin, Zheng Li, Jianlin Luo, Guo-qing Zheng,
Tamio Oguchi, Masaaki Hirai, Yuji Muraoka, and Takayoshi Yokoya, Journal of the Physical Society of Japan 78, 034705 (2009).
[7] K. Tahara, Z. Li, H. X. Yang, J. L. Luo, S. Kawasaki, and Guo-qing Zheng, Phys. Rev. B 80, 060503(R) (2009).
[8] A. B. Karki, Y. M. Xiong, N. Haldolaarachchige, S. Stadler, I. Vekhter, P. W. Adams, D. P. Young, W. A. Phelan and Julia Y. Chan, Phys. Rev. B 83, 144525 (2011). [9] P. K. Biswas, M. R. Lees, A. D. Hillier, R. I. Smith, W. G. Marshall, and D. McK. Paul, Phys. Rev. B 84, 184529 (2011).
[10] P. K. Biswas, A. D. Hillier, M. R. Lees, and D. McK. Paul, Phys. Rev. B 85, 134505 (2012).
[11] C. S. Lue, T. H. Su, H. F. Liu, and Ben-Li Young, Phys. Rev. B 84, 052509 (2011).
[12] E. Bauer, G. Rogl, Xing-Qiu Chen, R. T. Khan, H. Michor, G. Hilscher, E.
Royanian, K. Kumagai, D. Z. Li, Y. Y. Li, R. Podloucky, and P. Rogl, Phys. Rev. B 82, 064511 (2010).
[13] A. B. Karki, Y. M. Xiong, I. Vekhter, D. Browne, P. W. Adams, D. P. Young, K. R. Thomas, Julia Y. Chan, H. Kim and R. Prozorov, Phys. Rev. B 82, 064512 (2010). [14] C. N. Kuo, H. F. Liu, and C. S. Lue, Phys. Rev. B 85, 052501 (2012).
[15] C. S. Lue, H. F. Liu, C. N. Kuo, P. S. Shih, J.-Y. Lin, Y. K. Kuo, M. W. Chu, T.-L. Hung and Y. Y. Chen, Supercond. Sci. Technol. 26, 055011 (2013).
[16] V. Z. Kresin and V. P. Parkhomenko, Sov. Phys. Solid State 16, 2180 (1975). [17] K. Sugawara, T. Sato, S. Souma, T. Takahashi, and A. Ochiai, Phys. Rev. B 76, 132512 (2007).
[18] J. Chen, M. B. Salamon, S. Akutagawa, J. Akimitsu, J. Singleton, J. L. Zhang, L. Jiao, and H. Q. Yuan, Phys. Rev. B 83, 144529 (2011).
[19] T. Klimczuk, F. Ronning, V. Sidorov, R. J. Cava, and J. D. Thompson, Phys. Rev. Lett. 99, 257004 (2007).
[20] I. Bonalde, R. L. Ribeiro, W. Brämer-Escamilla, G. Mu and H. H. Wen, Phys. Rev. B 79, 052506 (2009).
[21] C.W.J. Beenakker, Annu. Rev. Condens. Matter Phys. 4, 113 (2013). [22] Jason Alicea, Rep. Prog. Phys. 75, 076501 (2012).
[23] T. P. Orlando, E. J. McNiff, Jr., S. Foner, and M. R. Beasley, Phys. Rev. B 19, 4545 (1979).
[24] A. E. Koshelev, A. A. Golubov, Phys. Rev. Lett. 90, 177002 (2003).
[25] A. Gurevich, S. Patnaik, V. Braccini, K. H. Kim, C. Mielke, X. Song, L. D. Cooley, S. D. Bu, D. M. Kim, J. H. Choi, L. J. Belenky, J. Giencke, M. K. Lee, W. Tian, X. Q. Pan, A. Siri, E. E. Hellstrom, C. B. Eom and D. C. Larbalestier, Supercond. Sci. Technol. 17, 278 (2004).
[26] H. D. Yang, J.-Y. Lin, H. H. Li, F. H. Hsu, C. J. Liu, S.-C. Li, R.-C. Yu, and C.-Q. Jin, Phys. Rev. Lett. 87, 167003 (2003).
![Fig. 3. Magnetization measurement of Ni(NO 3 ) 2 At 2 K under magnetic field.[1]](https://thumb-ap.123doks.com/thumbv2/9libinfo/8439887.181783/4.892.273.662.496.757/fig-magnetization-measurement-ni-k-magnetic-field.webp)
![Figure 3 Temperature dependence of upper critical fields of Re 24 Ti 5 [15], and the red curve is from Werthamer-Helfand-Hohenberg (WHH) theory.Re 21.75 Ta 7.25](https://thumb-ap.123doks.com/thumbv2/9libinfo/8439887.181783/15.892.206.660.315.662/figure-temperature-dependence-critical-fields-werthamer-helfand-hohenberg.webp)
