智慧型電腦分組系統之設計與評估
92
0
0
全文
(2) Computer-Supported Grouping Systems Based on AI Technologies: Design and Evaluation Student: Dai-Yi Wang. Advisors: Dr. Chuen-Tsai Sun Dr. Sunny San Ju Lin. Institute of Computer Science and Engineering National Chiao Tung Univesity. Abstract. Many Computer-Supported Collaborative Learning (CSCL) systems emphasize the use of technical tools to support effective/productive social interaction, social knowledge construction, and reflection. Only a handful of CSCL mediating tools provide help for the task of composing groups with good chances of success in task achievement and learning, and even fewer offer algorithm-based recommendations for establishing groups from a large pool of students with various characteristics and/or learning capacities. The author describes her work with other designers to create two computer-supported grouping systems. The first, named Differences In And Non-differences Among groups (DIANA), uses genetic algorithms to achieve fairness, equity, flexibility, and balance. The other, named Full Thinking Styles groups (FTS), uses iterative improvement algorithms to ensure the representation of all possible thinking styles in each team. DIANA and FTS were tested with 475 students assigned to groups of three, either randomly (63 groups), using DIANA (52), or using FTS (43). The results indicate that a) DIANA and FTS groups outperformed random groups overall, b) DIANA groups outperformed FTS and random groups in elementary school settings, and c) DIANA and FTS groups outperformed random groups in junior high school settings. Suggestions for applying computer-supported group composition systems are offered.. ii.
(3) 誌. 謝. 本論文能夠順利地完成,不是單單只倚靠個人的辛苦以及努力, 而是要歸功於許多人的指導、協助。在此,希望以我最誠摯的心意, 向你們說聲「謝謝」。 首先感謝我的指導教授孫春在教授,由於他不吝於分享其豐富的 經驗與知識,讓我學會以更寬廣的視野去看事情、做研究。感謝共同 指導教授林珊如教授,給予我論文上認真地指導與細心地協助、耐心 地傾聽我的想法、關心我的狀況,讓我的博士生涯注入了許多溫暖與 陽光。其次,感謝曾憲雄教授與袁賢銘教授對本論文的指導與建議, 使本論文得以更為完整。第三,要感謝口試委員陳國棟教授、王淑玲 博士、游寶達教授、張隆紋教授對於本論文之指正與建議。 我亦非常感謝研究室的許多伙伴們:佩嵐的鼓勵與討論;宗元、 偉民在口試時所給予的協助;政隆、文力、金村、森德辛苦幫忙做實 驗;還有許多學長、同學、學弟妹們的關心,謝謝你們! 感謝我的好朋友們:謝謝體貼細心的學妹圈圈總是陪我吃飯聊 天,排解苦悶;謝謝育瑋聽我抱怨,幫我解決問題;謝謝小婷讓我的 娛樂不匱乏;謝謝貼心的小愷總是陪我熬夜;謝謝親愛的高中同學 、JUJU、阿豆、阿奶、雅雅、小花、阿瓜、大胖,因為有你們的 友情支柱,我不怕困難! 最後,最最最感謝的就是我的家人,爸爸、媽媽、大姐、二姐、 小妹在我這二十年的求學生涯中,不斷地對我付出、關懷,以及那份 永無止盡的愛,讓我可以無後顧之憂地、恣意地享受自己所選擇的生 活。. 王岱伊. 謹於 交通大學 中華民國九十五年六月. iii.
(4) Contents ABSTRACT (IN CHINESE). i. ABSTRACT (IN ENGLISH). ii. ACKNOWLEDGEMENTS. iii. CONTENTS. iv. LIST OF FIGURES. vi. LIST OF TABLES. vii. CHAPTER 1 INTRODUCTION ..........................................................................1 1.1 Benefits of cooperative learning and computer supported cooperative learning ......................1 1.2 Theory versus the reality of the classroom................................................................................2 1.3 Object—early success ...............................................................................................................3 1.4 Organization..............................................................................................................................4. CHAPTER 2 LITERATURE REVIEW & STUDY FIXED POSITION .......................6 2.1 Group formation: educational perspective ................................................................................6 2.2 Using thinking styles to compose cooperative groups ............................................................10 2.2 Group formation from a computing perspective ..................................................................... 11 2.4 Study position, purposes, and goals ........................................................................................15. CHAPTER 3 PROBLEM ANALYSIS ................................................................18 3.1 Problems encountered in the use of psychological features....................................................18 3.2 Problems encountered in composing groups...........................................................................20 3.3 Sternberg’s suggestion: Full thinking styles............................................................................23. CHAPTER 4 TWO-PHASE GROUPING FRAMEWORK......................................26 4.1 First phase—categorization.....................................................................................................27 4.2 Second phase—grouping ........................................................................................................28. CHAPTER 5 METHODOLOGY .......................................................................30 5.1 Categorization .........................................................................................................................30 5.2 Balanced grouping ..................................................................................................................32 5.3 Full thinking style grouping....................................................................................................34. CHAPTER 6 IMPLEMENTATION ....................................................................40 6.1 On-line questionnaire system..................................................................................................40 6.2 Heterogeneous grouping systems............................................................................................41. CHAPTER 7 EXPERIMENT............................................................................45 7.1 Participants and treatment.......................................................................................................46 iv.
(5) 7.2 Group task...............................................................................................................................49 7.3 Procedure ................................................................................................................................49. CHAPTER 8 RESULTS AND DISCUSSION .......................................................51 8.1 Descriptive statistics ...............................................................................................................51 8.2 Comparing achievement among DIANA, FUTS and random composition groups ................52 8.2 Comparing satisfaction among DIANA, FUTS, and random composition groups.................60 8.3 Comprehensive discussion......................................................................................................72. CHAPTER 9 CONCLUSION ...........................................................................75 9.1 Summary and suggestions.......................................................................................................75 9.2 Limitations and future works ..................................................................................................78. REFERENCE ................................................................................................81. v.
(6) List of Figures Fig. 1. A distance-based grouping algorithm example.................................................22 Fig. 2. A comparison of distance-based group composition ........................................23 Fig. 3 A two-phase grouping framework .....................................................................27 Fig. 4. An example of a two-phase grouping model. ...................................................29 Fig. 5. The categorization algorithm............................................................................31 Fig. 6. Categorization stage flow chart for X students assigned to K groups..............32 Fig. 7. Chromosome decoding and initial population..................................................33 Fig. 9. Grouping problem search space. ......................................................................35 Fig. 10. Flow chart for the Hill Climbing algorithm used in this study.......................35 Fig. 11. Method used to find next grouping.................................................................36 Fig. 12. A flow chart of the Simulated Annealing method...........................................38 Fig. 13. The computer-supported grouping system. ....................................................40 Fig. 14. Screen from the On-line Thinking Style Questionnaire used in this study.....41 Fig. 15. Heterogeneous grouping system interface......................................................42 Fig. 16. Classification results for a sample of 36 students...........................................43 Fig. 17. Average fitness values during the evolutionary process. ................................44 Fig. 18 A algorithm of measuring density in MATLAB ..............................................48 Fig. 19 (a) Mean group achievements for each grouping method across two school levels. (b) Mean group achievements for each school level across the grouping methods ............................................................................................................55 Fig. 21 (a) Mean member satisfactions for each grouping method across two school levels. (b) Mean member satisfactions for each school level across the grouping methods.............................................................................................64 Fig. 22 (a) Mean process satisfactions for each grouping method across two school levels; (b) Mean process satisfactions for each school level across the grouping methods.............................................................................................65 Fig. 23 (a) Mean member satisfactions for each grouping method across two density levels. (b) Mean member satisfactions for each density level across the grouping methods.............................................................................................70 Fig. 24 (a) Mean process satisfactions for each grouping method across two density levels; (b) Mean process satisfactions for each density level across the grouping methods.............................................................................................71. vi.
(7) List of Tables Table 1: Commonly used characteristics for constructing heterogeneous and homogeneous groups. ........................................................................................7 Table 2: Advantages and disadvantages of heterogeneous-ability and homogeneous-ability groups..............................................................................8 Table 3. Thinking styles of the three individuals used in Definition 3. .......................24 Table 4. Thinking Style distributions for two teams. ...................................................36 Table 5. Descriptive Statistics and Correlation Matrix for Thinking Styles as Grouping Factors..............................................................................................................43 Table 6. Descriptive statistics of participants ..............................................................47 Table 7. Summary of Descriptive Statistics and One-way Analysis of Variance of Project Grades among the Four Teachers before and after Linear Transformation.................................................................................................52 Table 8. Means and Standard Deviations for Method Conditions as a Function of School Level Condition (achievement). ..........................................................53 Table 9. Summary Table of Two-Way Analysis of Variance for Grouping Method and School Level on Achievement. ........................................................................53 Table 10. Simple Main Effect. .....................................................................................54 Table 11. Means and Standard Deviations for Method Conditions as a Function of density condition (Achievement).....................................................................56 Table 12. Summary of Two-Way Analysis of Variance for Sample Density and Grouping Method.............................................................................................57 Table 13. Simple main effect .......................................................................................58 Table 14 Means and Standard Deviations for Method Conditions as a Function of School Level condition (Satisfaction)..............................................................61 Table 15 Summary of Two-Way Analysis of Variance for Grade and Grouping Method ..........................................................................................................................61 Table 16. Simple main effect (Member) ......................................................................63 Table 17. Simple main effect (Process) .......................................................................63 Table 18 Means and Standard Deviations for Method Conditions as a Function of Density Level condition (Satisfaction) ............................................................67 Table 19. Summary of Two-Way Analysis of Variance for Sample Density and Grouping Method (Satisfaction) ......................................................................67 Table 20. Simple main effect (Member) ......................................................................69 Table 21. Simple main effect (Process) .......................................................................69 vii.
(8) Table 22 Summary of the experiment results ..............................................................77. viii.
(9) Chapter 1 Introduction 1.1 Benefits of cooperative learning and computer supported cooperative learning Cooperative learning is recognized as an effective teaching approach that benefits students in terms of achievement, motivation, and social skills (Cohen, 1994a; Johnson & Johnson, 1989; Sharan, 1999; Slavin, 1995). Research results have shown that cooperative learning benefits students in terms of cognition (e.g., gaining higher achievement), affect (e.g., positive motivation), and behavior (e.g., social skills). Numerous studies have been conducted on factors that influence cooperative learning success, including intra-group interdependence, group development, task demands, resources, group process, and issues of race and ethnicity (Abrami, Chambers, Poulsen, De Simone, d’Apollonia & Howden, 1995; Cohen, 1994b; Johnson & Johnson, 1994; Kagan, 1994; Sharan & Sharan, 1992; Slavin, 1995). The literature contains a great deal of evidence and examples to serve as guides for teachers.. Computer-supported cooperative learning (CSCL) (especially in conjunction with information technologies) also promises a number of innovations to improve teaching and learning (Scardamalia & Bereiter, 1994; Suthers & Jones, 1997; Vosniadou, Corte, Glaser& Mandl, 1996). Many researchers have demonstrated how the sophisticated use of technical applications such as e-mail, electronic bulletin boards, conferencing systems, and specialized groupware can facilitate cooperative learning (Coleman, 1997). Most emphasize the use of technical tools to support 1.
(10) effective/productive social interaction, social knowledge construction, and reflection.. 1.2 Theory versus the reality of the classroom Managing cooperative or small group learning efforts poses challenges for teachers, who often must deal with students who lack the requisite social skills, have problems with social loafing, or problems with time management (Johnson & Johnson, 1991). Experienced teachers know that simply putting students together to perform a task does not ensure quality cooperative learning. As Johnson and Johnson (1990) and Slavin (1995) have observed, successful cooperative learning requires positive interdependence, meaningful interaction, individual accountability, collaborative skills training, and appropriate rewards.. Although many CSCL systems are well-designed according to established principles for the construction of cooperative learning environments (Strijbos, Martens & Jochems, 2004), many teachers face major problems at the very beginning of a project due to a lack of knowledge of how to form groups that have better chances to execute successful teamwork. In this area, few studies offer helpful advice about the effects of various grouping methods. The result: many teachers allow students to form their own groups or create groups via random assignment or according to seat arrangement.. Teachers who are more accustomed to traditional learning techniques but who want to try cooperative learning must make two important efforts. First, they need to identify specific student characteristics for establishing groups—for example, race, gender, and ability (Cohen & Lotan, 1997; Cordero, DiTomaso & Farris, 1996; Savicki, Kelley & Lingenfelter, 1996), self-efficacy (Bandura, 1997), learning style. 2.
(11) (Sternberg, 1998), and other factors that strongly affect group learning outcomes. Second, teachers must consider group type—heterogeneous or homogeneous. According to Dembo (1994), many cooperative and small-group learning researchers believe that heterogeneous groups are more likely to a) provide opportunities for students to learn how to interact with different types of classmates, and b) improve chances of academic success (Cohen, 1994a; Johnson & Johnson, 1994). However, there is evidence showing that extreme differences among group members can impair cooperation (Webb, 1989).. Currently there are very few CSCL mediating tools that provide help for composing groups and even fewer that offer recommendation algorithms for selecting team members from a large pool of students based on various characteristics and/or learning capacities. Thus, even though CSCL techniques are gaining popularity, using them correctly poses challenges for the majority of teachers.. 1.3 Object—early success To enhance cooperative learning potentiality, I created a framework to help teachers use elaborative group composition methods that can improve the odds of implementing successful cooperative learning projects. The framework employs powerful information computation techniques to create groups according to principles identified by educational researchers and theorists. The three primary design principles are. 1. Taking into consideration psychological features that are relevant to learning outcomes. For example, Sternberg (1998) emphasizes thinking styles to promote effective cooperative learning. The framework described in this paper uses thinking. 3.
(12) style as an exemplar that represents all possible psychological aspects of learners.. 2. It was assumed that heterogeneity is a better goal than homogeneity because it promotes diversity in student characteristics and equips groups with tools for achieving multiple learning purposes (Johnson & Johnson, 1994). The reasons are described above.. 3. In terms of educational equity, a goal was established to ensure that all students benefit from cooperative learning. This requires a strategy for accommodating all students by placing them in appropriate groups for successful cooperative learning. This means rejecting the idea of grouping the best students together and ignoring the weaker ones. The designers set out to find workable ways for grouping that consider all students at the same time, regardless of differences in talent or psychological features. In addition, grouping adequacy was taken into account for both individual and whole class levels to ensure that student distribution does not increase a sense of debt in some groups.. In summary, grouping is a fundamental step in cooperative leaning. To consider multiple psychological features for creating heterogeneous groups, teachers must deal with major computational requirements. With the goal in mind of assisting teachers, the design team created a framework to implement two computer-supported grouping systems: DIANA (Differences In And Non-differences Among groups) and FUTS (Full Thinking Styles groups).. 1.4 Organization The outline of this dissertation is as follows: in chapter 2, group studies in the fields of education and information technology (IT) are introduced. Chapter 3 presents 4.
(13) an analysis of the difficulties of using psychological features for group composition. A two-phase grouping framework is described in Chapter 4, an implementation algorithm in Chapter 5, and the entire system in Chapter 6. Chapter 7 and 8 discuss evaluations of DIANA and FUTS. Finally, Chapter 9 contains a conclusion and potential future perspectives of computer-supported group composition.. 5.
(14) Chapter 2 Literature Review & Study Fixed Position 2.1 Group formation: educational perspective In their list of critical decisions to be made when grouping students for cooperative learning activities, Abrami et al. (1995) noted that teachers must consider group size, group activity duration, student characteristics, methods of group composition and organization, and the manner of assigning students to groups. These decisions are affected by student age and interpersonal skills, instructional goals, activity properties, the climate of class trust, and teacher beliefs.. 2.1.1 Common grouping methods in current use. In his survey of the literature on cooperative learning, Abrami (1995) found that the majority of teachers use one of three methods to assemble small learning groups:. 1. Teachers allow students to form their own groups. Unfortunately, students tend to form teams based on friendship or common interests in a topic, and friendship-based groups are generally homogeneous (Abrami et al., 1995). Although cooperation may be facilitated as a result of harmonious communication, it can also produce ineffective results due to a lack of multiple perspectives. Furthermore, shy students or students with less developed social skills are easily excluded by other members of homogeneous groups.. 6.
(15) 2. Teachers use simple methods such as putting together students who sit next to or near each other (Abrami et al., 1995). The main advantage of these methods is that individual students do not feel rejected or singled out. The main disadvantage is that some groups may consist of all low-ability students who are less successful at performing complex tasks. Another potential problem is the unintentional creation of groups that lack balance in terms of ethnic or socio-economic position, in which higher status students dominate their lower status classmates (Cohen, 1994b).. 3. Teachers form groups according to student characteristics. The two most common alternatives are heterogeneous or homogeneous, with heterogeneous groups providing more opportunities for students to learn how to work cooperatively with different people. Cohen (1994b) and Johnson & Johnson (1994) are among many researchers who have presented evidence showing that heterogeneous grouping enables students to learn more in terms of academic knowledge and social skills. However, Webb (1989) warns that the range of member differences within a group should not be too extreme in order to prevent the construction of barriers to cooperation. Abrami et al. (1995), Cohen (1986, 1994a), and Webb (1985) have also examined how such characteristics as gender, ethnic status, socio-economic status, and personality type affect learning performance and cooperative interaction in group activities. A list of characteristics that are often used when constructing heterogeneous and homogeneous groups is presented as Table 1. Table 1: Commonly used characteristics for constructing heterogeneous and homogeneous groups. Heterogeneous groups. gender, race, ethnicity, language, status, learning style, thinking style, personality traits. Homogeneous groups. living location, first language other than English.. 7.
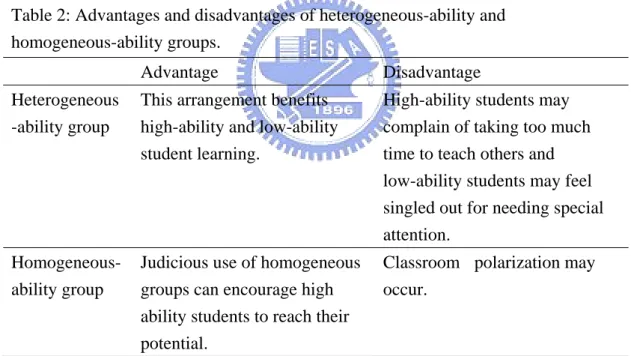
(16) 2.1.2 Ability-based groups. Abrami et al. (1995) note that creating heterogeneous groups based on ability has benefits for students at both ends of the ability spectrum, although there is a risk that high-ability students will complain about spending too much time teaching peers or that low-ability students will feel singled out for needing special attention. In contrast, homogeneous groups based on ability may encourage high-ability students to reach or exceed their potential, but they can also lead to classroom polarization, with low-ability students having fewer opportunities for improvement. A comparison of heterogeneous-ability and homogeneous-ability groups is presented in Table 2. Table 2: Advantages and disadvantages of heterogeneous-ability and homogeneous-ability groups. Advantage. Disadvantage. Heterogeneous -ability group. This arrangement benefits high-ability and low-ability student learning.. High-ability students may complain of taking too much time to teach others and low-ability students may feel singled out for needing special attention.. Homogeneousability group. Judicious use of homogeneous groups can encourage high ability students to reach their potential.. Classroom polarization may occur.. Based on a review of studies on helping behaviors in cooperative groups, Webb (1989) reported that a) students in all-high or all-low ability homogeneous groups are more likely to ask for terminal help (e.g., the correct answer) or surface information due to a lack of sufficient motivation to explain their ideas or to discuss alternatives; and b) students in all-low ability groups are more hesitant to ask for help. He therefore. 8.
(17) concluded that cooperative learning groups perform best when they contain a mix of high- and low-ability members.. 2.1.3 Gender-based groups. Savicki et al. (1996) studied three types of college-level groups that used computer-mediated communication (CMC) to discuss issues in a psychology class: female-only, male-only, and a heterogeneous mix. They reported that members of the all-female groups used more words in their CMC messages and expressed greater satisfaction with the process compared to members of the other two groups. In a separate study, Webb (1985) observed that girls in mixed groups tend to let boys deal with most problems, even when they outnumber boys.. 2.1.4 Balanced groups. Huxham & Land (2000) studied heterogeneous student groups based on individual psychological features. They used questionnaire results to categorize group member roles as activists, reflectors, theorists, and/or pragmatists. Students were assigned to groups in a manner that emphasized intra-group and de-emphasized inter-group differences. According to their results, groups created by random selection and heterogeneous groups performed equally well.. Since the majority of researchers appear to agree with the idea that heterogeneous grouping promotes positive interdependence, better group performance, and effective interaction, heterogeneity was chosen as the grouping goal when designing the group composition framework described in this dissertation. 9.
(18) 2.2 Using thinking styles to compose cooperative groups In addition to the characteristics listed in Table 1, Sternberg (1998) suggests that teachers consider thinking styles to promote cooperative learning among individuals in small groups, with the term thinking style described as personal tendencies and attitudes associated with utilizing one’s own skills. Thinking style is not the equivalent of talent or ability, but entails personal preferences for methods that determine the use of intelligence. Sternberg identified thirteen thinking styles, all of which affect all persons at the same time, but to different degrees. Hence, there is a need to simultaneously consider the degree of all thinking styles in individuals instead of simply classifying them in terms of a single thinking style.. Sternberg also established a functionality dimension consisting of three larger categories of thinking style: legislative, executive, or judicial. Individuals who follow a legislative style are innovative and do things according to their own rules. Executive thinkers are more likely to follow prescribed rules and to show a preference for ideas that they fully understand. Judicial thinkers don’t pay much attention to rules, preferring instead to compare ideas and to make judgments based on their benefits and deficiencies.. Sternberg & Louise (1996) also suggests that teachers compose cooperative teams according to student thinking styles—specifically putting one member from each of the three thinking styles just mentioned to complement each other in task performance. He claims that positive effort occurs when an individual’s thinking style matches environmental conditions and requirements. To improve the odds of finding. 10.
(19) or creating such a match, he advises teachers to establish cooperative teams that are balanced in terms of executive, legislative, and judicial thinking styles so that group members can both influence and challenge one another. Hence, the framework described in this dissertation uses thinking style as a heterogeneous grouping factor.. 2.2 Group formation from a computing perspective Although computer-supported cooperative learning facilitated cooperative learning, few CSCL mediating tools provided help in composing promising groups until a branch of intelligent application research on web-based learning devoted to form effective teams.. 2.2.1 Intelligent system. Few CSCL mediating tools were created to help with small group composition until a branch of intelligent application research in web-based learning devoted to team formation was established. Currently there are several adaptive/intelligent educational systems that facilitate web-based learning (Brusilovsky, 1999). These systems not only project classroom-like learning conditions, but also offer students adaptive courseware, personalized assistance, and individual remediation that complements student efforts according to learning status. The application of adaptive/intelligent technologies protects students from feeling as though they are lost in an ocean of information, which is a common problem with web-based learning.. Intelligent agents in the form of tutors or peers can assist learning by guiding students in accordance with courseware requirements or known learning deficiencies. The power of intelligent agents is determined by the degree of artificial intelligence, 11.
(20) sufficient information on the students using a system, and the accuracy of learning modeling. Agents can perform multiple complex roles to match diverse instructional needs and goals. Roles that are commonly played by agents in educational settings include tutor (Chan & Baskin, 1990; Chan & Chou, 1997), tutee (Biswas et al., 2001; Scott & Reif, 1999), collaborator (Hietala & Niemirepo, 1998; Ryokai, Vaucelle & Cassell, 2003), competitor (Chan & Baskin 1990; Ramirez & Uresti, 2000), and troublemaker (Aimeur & Frasson, 1996).. 2.3.2 Adaptive grouping support. According to the technical literature, past intelligent technologies were mostly applcable to individual learning, but the centralized management of learning records stimulated some researchers to analyze and match models for many students at the same time (Brusilovsky, 1999). Some research effort was spent on adaptive collaboration support, which uses system knowledge about different students (stored in the form of student learning model) to form well-matched collaborative groups (Bishop, Greer & Cooke, 1997; Hoppe, 1995; Ikeda, Go & Mizoguchi, 1997; McCalla, Greer, Kumar et al., 1997). Brusilovsky(1998) considers that adaptive collaboration support is a particular technology, which is an important development.. In general, computer-supported group formation consists of the three phases, initiating collaborative situation, finding out suitable teammates, and negotiating for constructing a final work-team (Wessner & Pfister, 2001). I particularly introduce the former two phases, that have relations with this study.. 12.
(21) Initiating collaborative situations. That is, deciding when to use cooperative learning techniques. The three parties involved in this decision are y. teachers, who are in charge of designing collaborative learning activities aimed at matching courseware needs—for instance, combining a cooperative project with problem solving.. y. students, who often spontaneously ask for cooperation when they feel friendless, helpless, illiterate, or in some other manner caught in a predicament.. y. intelligent systems that detect when students are mired in difficulties and who may therefore benefit from a cooperative environment to address learning disorder concerns. Examples include students who regularly fail quizzes, who repeatedly make the same or similar mistakes, who continually misunderstand certain concepts, or who are stuck at some point in the learning process. Systems occasionally put students in cooperative learning environments to help them review a lesson by teaching others.. Finding well-matched learning partners. Unfortunately, few technology researchers pay attention to this issue, until they have a chance to examine abundant information of students’ learning in central storage that is collected during web-based learning, technologists realize that it can be used to group students. Some research grouped students via student models, and some via other information. At least three research teams have offered suggestions on 13.
(22) finding a suitable learning partner. Following, I introduce some studies to explain how to find a suitable learning partner.. Concept complementation. Ikeda, Go and Mizoguchi (1997) proposed a novel system in which agents observe student learning progress. When the agent detects that a student is having difficulty, it asks the system to put that student into a cooperative group. The system is also programmed to find suitable partners and to create communications channels among group member agents. Students enter a group learning situation following agent negotiation. Learning goal ontology is the basis for Ikeda et al.’s proposed system. The ontology is used to assign roles to students (e.g., learner, helper, presenter, observer, participant, or debater) when they are placed into cooperative groups. The guiding purpose is to identify an individual’s learning goals with those of the group. On the side, Bishop, Greer & Cooke (1997), McCalla et al. (1997) were also devoted to find out the most suitable partner to form problem-solving groups, which is based on students’ knowledge of the domain.. Browsing behaviors similarity. Tang and Chan (2002) arranged students in terms of similar backgrounds in browsing behaviors and course knowledge. They argue that browsing activities are reliable indicators of students’ knowledge skills, interests, and learning progress, and that simple monitoring techniques are sufficient for identifying students with similar learning characteristics. This approach resembles traditional homogeneous interest/ability grouping methods.. Intended points 14.
(23) Wessner and Pfister (2001) utilize knowledge about collaborative contexts to establish intended points of cooperation without any need for a detailed learning domain model. Their system provides an interface that allows course designers to easily integrate collaborative activities into learning environments. After setting group type and size in advance according to learner characteristics and course structure, the system can create corresponding groups. However, groups were formed by random assignment or by teacher decision via the interface provided by the system. The researchers did not go into detail about appropriate matches between or among learning partners.. Regardless of how group formation is initiated—by system detection or user requisition, according to the complementary concept (Ikeda et al., 1997), according to browsing behaviors (Tang & Chan, 2002), or randomly via intended points (Wessner & Pfister, 2001)—all of the approaches mentioned so far adopt dynamic grouping methods to shift students from individual to collaborative learning modes. However, sometimes teachers do not have access to relevant student learning information (e.g., when they enter a new learning environment or when teachers are unfamiliar with a class). Moreover, some project-oriented or problem-solving learning activities require group work, at least initially. Hence, a system that can quickly place learners in appropriate groups without having to build a complex, detailed learning model is worth investigating.. 2.4 Study position, purposes, and goals Cooperative learning requires careful design and planning. Success is less likely if groups are assembled arbitrarily. Educational researchers have established theories and in some cases given suggestions such as forming heterogeneous groups according 15.
(24) to psychological features. But taking the time to create groups based on specific features is both difficult and time-consuming for teachers, who are already pressed for time. Most currently available grouping systems adopt some form of random assignment, with a few intelligent systems able to form complementary groups in terms of student learning models.. This dissertation is a description of my attempt to develop a computer-supported grouping system, based on educational theory, that simplifies the task of manipulating complex information for the purpose of creating successful cooperative learning groups. A primary goal is to make this task easy for busy teachers. The proposed system was designed to a) form heterogeneous groups based on the psychological features of students, and b) allow for the rapid introduction of students into a cooperative learning situation without having to construct individual student learning models.. The following principles guided the system design process:. 1. Ensure that all students take part in cooperative learning. When researchers assign individuals into groups in laboratory settings, they often disregard students who are difficult to deal with or who express vague features. Educators in real-life classrooms cannot disregard anyone, thus it is necessary to ensure that every student benefits from cooperative learning rather than only a few capable students. The grouping system described in this dissertation was designed to aid teachers in group composition so that no student needs are ignored. The system was designed with the belief that everyone’s right to education and achieving excellence should be valued.. 2. Adequate grouping should be a goal rather than forming “dream teams.” In conjunction with principle #1, the objective of group composition should not be to 16.
(25) merely produce refined teams, but to group an entire pool of students so that everyone benefits.. 3. Ensure that every student benefits from cooperative learning. When grouping students, some teachers use the strategy of choosing the best students first and building groups around them—a strategy that inevitably creates a number of groups consisting primarily of less capable students. Hence, a grouping system should aim to maintain within-group heterogeneity and between-group balance.. 4. Create groups, not clusters. Grouping for cooperative learning has at least two requirements that differentiate it from general clustering: teachers are often required to form groups of equal size, and all students should be taken care of and assigned to the most suitable group possible.. Based on these principles, the main purpose of the DIANA and FUTS grouping systems is to ensure fairness—that is, ensure that everyone assigned to a group starts on equal ground. The other primary purpose is to create a system that is flexible and easy to use in order to reduce teacher workloads in CSCL management.. 17.
(26) Chapter 3 Problem Analysis The educational literature encourages teachers to form groups according to psychological features that are not easily observed and that often consist of multiple continuous variables. These characteristics make the grouping problem more complex and perhaps open to the benefits of powerful computing capabilities. A computer programmer is more likely to view group formation as a question of mathematical combinations requiring careful design to ensure diversity within and among groups needs. In this chapter I will analyze the grouping problem mathematically, using psychological features as variables.. 3.1 Problems encountered in the use of psychological features Psychological features possess certain natural properties that make them difficult to use for purposes of grouping students. First, psychological variables are embedded and often not easy to observe—even if a teacher has plenty of time to make detailed observations, which most teachers don’t. In contrast, demographic variables (e.g., gender, race, age) are easier to measure and therefore more convenient for making fast, short-term grouping decisions (Cohen, 1997; Cordero et al., 1996; Savicki et al., 1996). Addressing this challenge requires the use of a trustworthy, well-developed psychological inventory—for instance, Lin & Chao’s (1999) Thinking Styles Questionnaire. In the present project the goal is to use psychological variables as grouping factors, thus requiring the creation of a questionnaire that can be easily. 18.
(27) distributed, completed, and collected online, and that allows for easy scoring so that the results can be used quickly with a group composition algorithm.. A second problem is the complex nature of psychological variables. Using thinking styles as an example, it is incorrect to state that individuals use one style only; a better approach is to view thinking styles as the way (or ways) that individuals prefer to use the abilities they have, with most people using multiple thinking style patterns. Teachers must consider all styles simultaneously, thus increasing the complexity of the composition problem.. For purposes of this dissertation, I will use the following definition of a student psychological profile:. Definition 1: The psychological profile of student x can be measured and represented as F ( x) = ( f1 ( x), f 2 ( x),L f n ( x)) when n psychological features are to be considered simultaneously.. Teachers who try to maintain simplicity by using the single most significant thinking style identified in a student will unfortunately remain ignorant of the effects of other thinking styles and thus artificially diminish student diversity. Normalizing scores to a range between 0 and 1, a student’s combined pattern of executive, legislative, and judicial thinking styles may be measured as 0.1, 0.7, and 0.5, respectively. To choose legislative to represent this student’s learning style would ignore the strong influence of judicial thinking style in this student’s psychological character.. A third problem is the continuous nature of most psychological variables compared to categorical data (e.g., gender or some other demographic factor). In 19.
(28) comparison, it is much more difficult to assign students according to self-efficacy scores that range from 15 to 55.. It is also tempting to create categories based on continuous data—for instance, dividing high, medium, and low executive thinking style scores into separate categories. The challenge here is identifying reasonable cut-off scores. Even if it were possible, the process would be time-consuming, ignore complexity within and diversity among students, and overlook valuable psychological information. For this reason, many researchers oppose the arbitrary division of continuous data, leaving teachers with no easy approach to grouping in the presence of multiple psychological features.. 3.2 Problems encountered in composing groups Forming heterogeneous groups requires calculations of group diversity. To address this issue, the design team tabulated student thinking style questionnaire scores and treated each score as a single point along three orthogonal vectors. By drawing each psychometric variable as a dimension, individual thinking styles can be positioned as a point in geometric space, and space vectors can be used to transform what is essentially an abstract problem into a structured, procedural problem—for instance, transforming the diversity of two individuals’ thinking styles into a problem involving the geometric distance between two points. In other words, diversity can be defined in terms of Euclidean distance as follows: Definition 2: Let S = {s1 , s 2 ,K, s m } be a set of students waiting to be assigned to a group. Each student is represented as a dot in an n-dimensional feature space. The degree of diversity between any two students can be expressed in terms of. 20.
(29) Euclidean distance:. D ( si , s j ) =. n. ∑( f k =1. k. ( si ) − f k (s j )) 2. Three students forming a triangular shape can be considered a single group, thus making the grouping goal one of putting together heterogeneous groups of individuals whose thinking style points create the largest possible triangles.. Defining intra-group differences in terms of distance makes it possible to find optimal solutions using exhaustive algorithms. The first step is to construct a distance matrix of all possible pairs, then aggregate pairs with the largest distances until three points are established. The process is to be repeated until no more triads can be found or formed. In light of the complexity of such an exhaustive algorithm, Lin & Sun (2000) adopted Random Mutation Hill Climbing (RMHC) for the purpose of finding optimal solutions as quickly as possible.. Although using a distance-based grouping algorithm appears to be intuitively reasonable, many of Lin and Sun’s RMHC-recommended groups were not very heterogeneous. The problem is illustrated in Fig. 1, in which a teacher wants to compose two groups of three students each based on two psychological characteristics. Each point along the two-dimensional space in the first sequence represents a student. In the second sequence, students A, B and C are assigned to a group that has the greatest potential for heterogeneity, therefore D, E and F must be placed in the second group. The placement of student C in group 1 increases the homogeneity of group 2, thus jeopardizing the heterogeneous grouping goal.. 21.
(30) Fig. 1. A distance-based grouping algorithm example. A second example, illustrated in Fig. 2, involves nine students that a teacher wants to separate into three optimum groups based on two learning characteristics. Each dot represents a student in a two-dimensional psychological space. The most heterogeneous group would consist of A, B and C and the second-most heterogeneous would consist of D, E, and F (Fig. 2b). However, those groupings would result in a third grouping of G, H and I—one with very low heterogeneity. As shown in Fig. 2c, the A-B-C, D-E-F, and G-H-I triangles become progressively smaller, indicating a steady decrease in intra-group diversity and a contradiction of the original goal of placing all students in the most heterogeneous groups possible. Stated in a different way, the problem requires a global optimal rather than local optimal solution to achieve educational equity.. 22.
(31) Fig. 2. A comparison of distance-based group composition. Using a grouping algorithm based on distance produces triangles of various sizes. As size decreases, so does intra-group diversity. This type of greedy algorithm inevitably forms groups with extreme heterogeneity, groups with concurrently decreasing heterogeneity and increasing homogeneity, and groups with extreme homogeneity. Identifying an appropriate cut-off point between heterogeneous and homogeneous groups is problematic—a distance-based grouping algorithm produces heterogeneous groups that are prized by educators, but they also produce undesirable homogeneous groups that conflict with the educational equity goal of assigning all students to their most suitable groups.. An example of optimal groupings is shown in sequence 3 of Fig. 1, in which A, B, and E are assigned to group 1 and C, D, and F to group 2. The two groups have sufficient levels of intra-group diversity—that is, their triangles are similar in shape. Our proposed DIANA grouping method is based on shape instead of distance, in accordance with an assumption that similarities in shape represent similarities in terms of heterogeneity. The result will be in compliance with the stated goals of fairness (groups having the same size), equity (assigning all students to their most suitable group), flexibility (allowing teachers to address single or multiple psychological variables), and heterogeneity (guaranteeing individual diversity for promoting intra-group interactions).. 3.3 Sternberg’s suggestion: Full thinking styles Robert J. Sternberg, a cognitive psychologist, argues that the most effective teams in terms of task accomplishment require a strong balance of executive, legislative, and judicial thinking styles. Any group can benefit from a member who 23.
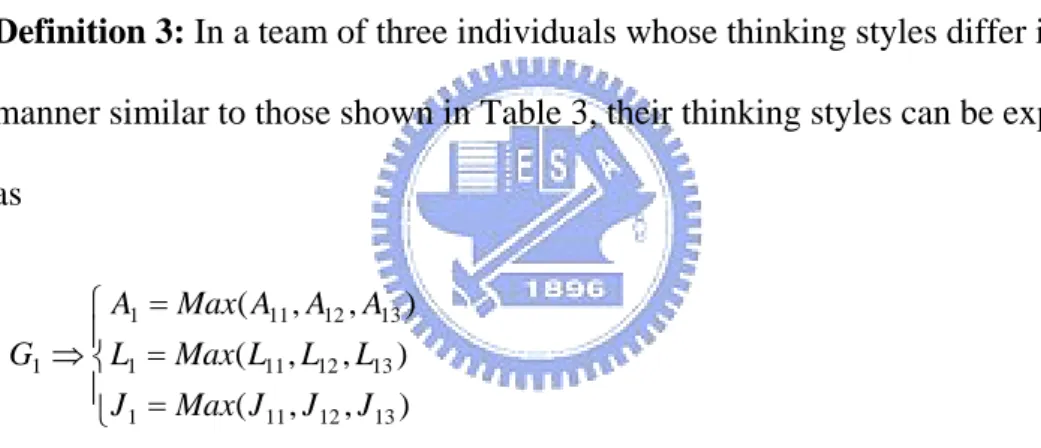
(32) works industriously and who knows how to follow rules (executive style), but the group also needs the balancing effect of an innovative individual (legislative style) in order to achieve breakthroughs that are often based on rule-breaking insights. As a mediating force, the group can benefit from a member who keeps an eye on rules while comparing and evaluating their characteristics (judicial style). The second grouping method proposed in this dissertation, FUTS, was designed to implement Sternberg’s theory. The guiding principle for this method is ensuring that each group has “substantial features” of chosen psychological factors.. Based on this background, the third definition is presented as follows:. Definition 3: In a team of three individuals whose thinking styles differ in a manner similar to those shown in Table 3, their thinking styles can be expressed as ⎧ A1 = Max( A11 , A12 , A13 ) ⎪ G1 ⇒ ⎨ L1 = Max( L11 , L12 , L13 ) ⎪ J = Max( J , J , J ) 11 12 13 ⎩ 1. Table 3. Thinking styles of the three individuals used in Definition 3. Thinking Style Executive Legislative Judicial. Member 1. Member 2. Member 3. A11 L11 J11. A12 L12 J12. A13 L13 J13. Group members with different thinking style profiles are more likely express reciprocal influences and introduce working preference dynamics that may in turn lead to greater chances of success. The group compositional goal should be to ensure that there is a comprehensive and salient mix of executive, legislative, and judicial thinking styles on each team. A particular style may be contributed by more than one 24.
(33) member or a single member may express more than one thinking style. While the ideal group will have thinking styles distributed equally among different members, such distribution cannot be predicted or controlled. The framework designers therefore adopted a priority mechanism, with highest priority given to combinations in which each group member expresses a single style. The least favorable scenario has one group member expressing all three thinking styles.. The names Ai, Li and Ji are used to represent characteristic values for members of team i. In a scenario consisting of n teams, their value set can be written as: ⎧ ( A1 , A2 , A3 ,......, An ) ⎪ ( G 1 ~ G n ) ⇒ ⎨ ( L1 , L 2 , L3 ,......., L n ) ⎪ ( J , J , J ,......, J ) n ⎩ 1 2 3. The design goal was to find combinations with the largest possible characteristic values for each team—in other words, to identify groups with maximum A, L, and J (the minimum characteristic values for all teams). A = Min ( A1 , A2 , A3 ,......, An ). L = Min ( L1 , L2 , L3 ,......., Ln ) ÆFind a combination that has maximum A, L, and J J = Min ( J 1 , J 2 , J 3 ,......, J n ). Based on this analysis, the optimal grouping condition is to find Max A( p ), L( p ), J ( p ) , where p represents a grouping result. p. 25.
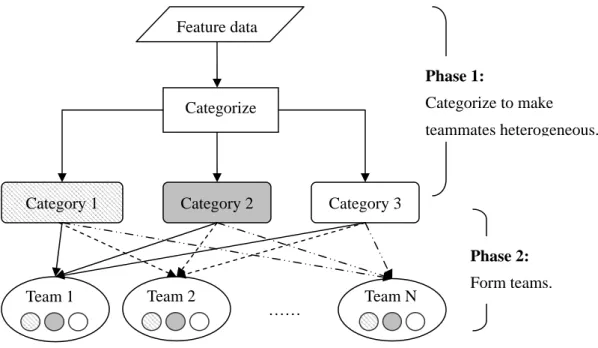
(34) Chapter 4 Two-phase Grouping Framework As stated in chapters 2 and 3, two issues need to be addressed regarding grouping as a fundamental cooperative learning issue. First, multiple psychological variables (as opposed to single demographic variables) must be measured and used as grouping factors, keeping in mind that these variables consist of continuous data and are strongly related to learning performance. Second, the guiding strategic goal is to assign students to the most suitable group so that all groups have similar capacities for success. The novel computer-assisted grouping framework described in this paper has been designed so as to address these two problems. It is hoped that the final product will help teachers use psychological features as grouping factors for assigning students to suitable groups, and help researchers find optimal combinations for cooperative learning.. Assume the formation of N triad teams. The flow of the two-phase grouping framework is shown as Fig. 3. The first phase of the proposed grouping framework entails categorizing individuals in terms of thinking style inclinations. The number of teammates will determine the number of categories—that is, choosing one person from each category to form heterogeneous groups. As a result, teammates’ TSs are heterogeneous and can fit in with our grouping goals, DIANA and FUTS, according to different methodologies in the second phase.. 26.
(35) Feature data Phase 1: Categorize to make. Categorize. teammates heterogeneous.. Category 1. Category 2. Category 3 Phase 2:. Team 1. Team 2. ……. Team N. Form teams.. Fig. 3 A two-phase grouping framework.. 4.1 First phase—categorization In this phase, students are separated into several categories. The number of categories is decided by the number of group members. In this example the goal is to assign students to groups of three, therefore the sample pool requires three separate categories. The categories are formed naturally by recursion, thus leading to suitable categorization for the entire class. As part of the goal of creating heterogeneous teams, an important task for this stage is finding a prototypical group shape that reflects a certain degree of diversity within each group and maintains a certain degree of balance across all groups. An equal emphasis on individual and global performance helps to prevent the problem of having a high level of diversity in one group at the expense of other groups.. In this example, group members thinking styles are visualized as three points in a two-dimensional space. The key here is to find triangular shapes for all groups that. 27.
(36) are as similar as possible in order to maintain similarity in terms of within-group diversity. The proposed grouping system defines diversity in terms of shape within a geometric space. This requires defining a “typical” shape—a task that is dependent on the characteristics and diversity of the persons in a sample. A typical shape (or group) can be defined as follows: Definition 4: Let S = {s1 , s 2 ,K, s m } be a set of m students forming c categories in an n-dimensional feature space, with ci standing for the ith category containing Ni students with centroid vi. The typical group can be expressed as V = (v1 , v 2 , K v n ) , where vi =. 1 Ni. ∑ F (s. s j ∈ci. j. ).. 4.2 Second phase—grouping The most important task in the second phase is to select suitable students for each group. Since they have different theoretical principles, the DIANA and FUTS grouping techniques have different ways of defining suitability. Forming DIANA groups requires categorical separation and a definition of a typical group shape (as described for the first phase), after which single students from each category can be selected to form groups whose shapes are similar to the defined typical shape. Inter-group diversity is eventually controlled by this shape. An illustration of the steps required to separate nine students into three groups of three members each according to two psychometric features is presented in Fig. 4.. 28.
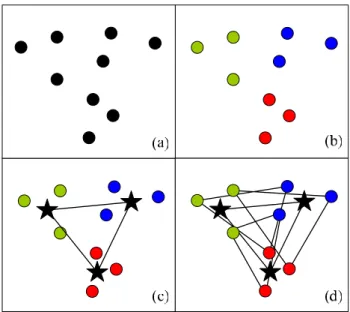
(37) Fig. 4. An example of a two-phase grouping model. a, nine students as represented by nine dots in a two-dimensional space; b, splitting students into three categories (one color per category); c, connecting the centers (black stars) of each category to form a “typical” group; d, selecting one student from each category to form group shapes that resemble the typical group shape. To form FUTS groups, teammates were selected based on the analysis discussed in section 3.3.. 29.
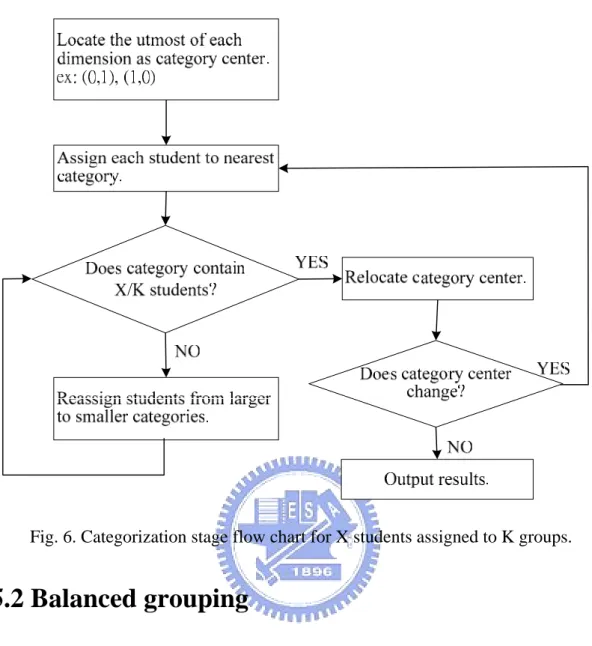
(38) Chapter 5 Methodology 5.1 Categorization As stated in the preceding chapter, the number of categories for any group is determined by group size and the requirements that no one should be left out and all category sizes should be the same. These requirements contradict the principle of traditional clustering, which maintains similarity within groups and differences between or among groups.. I therefore took the k-means algorithm (Duda & Hart, 1973) and added a reallotment function to the while-loop to identify static categories. This function can take some students from an oversized category and redistribute them to the next closest category.. The categorization algorithm is presented in Fig. 5. Its four steps are a) determining the initial locations of all category centers, b) allocating individual students to their nearest category, c) reapportioning students to maintain categories with equal numbers of members, and d) computing category centers and returning to step b whenever a category center changes (Fig. 6). This method organizes students around category centers. A small number of individuals are situated between categories, thus creating a high level of dispersal.. In this phase an algorithm was adopted for controlling teammate count, like the K-means algorithm being used to set a precise cluster number. Users who form teams of different sizes must adjust the K parameter accordingly. I also added a control 30.
(39) Algorithm reallot () begin for while category sizes are not equal do begin compute the distance between each student in the over-sized category and other categories reallot the student who’s distance is shortest to his second nearest, unfilled category end Algorithm categorization (features of students) begin set the initial category center at the utmost of each dimension for while the new category centers aren’t the same as the old ones do begin dispatch each student to his nearest category reallot() end compute new category centers end. Fig. 5. The categorization algorithm. mechanism to ensure equal numbers in each category, thus controlling heterogeneity. However, sample distribution cannot be controled. Since all individuals need to be assigned to teams of equal size, this phase runs continuously in an attempt to find better categorizations and uses the second phase to improve grouping solutions.. Teachers and researchers prefer categorization results that indicate optimum diversity. The most distinct types can be produced by setting the initial category center at the utmost value of each dimension. Also during this phase, teachers can consider more than one learning characteristic and assign them equal value.. 31.
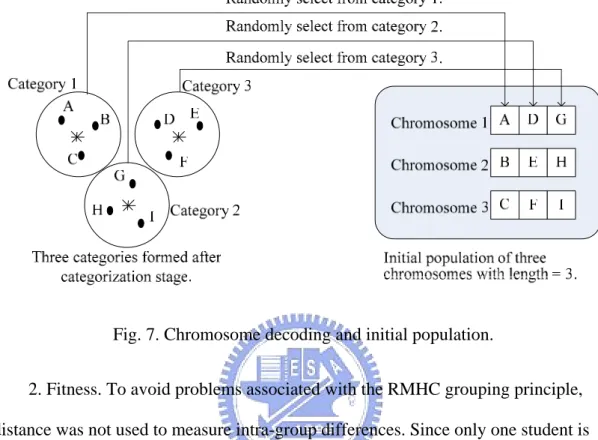
(40) Fig. 6. Categorization stage flow chart for X students assigned to K groups.. 5.2 Balanced grouping After phase 1, the triangular shape of the final category centers is considered a prototype representing the desired structure of all heterogeneous groups. Once a group structure is defined, every effort is made to make all group shapes identical or very similar to the prototype. A genetic algorithm (Holland, 1975) was adopted for evolving an approximate solution for this combination problem. Geneticists use three operators (crossover, mutation, and inversion) to create new chromosome populations from existing populations, with individual solutions evaluated after a predetermined number of generations have evolved. The main components of the GA process are:. 1. Chromosomes. In the present study, one chromosome represents one group and each gene within a chromosome represents a single student in each category. 32.
(41) Chromosome length equals category number (i.e., group size); population size equals the number of students divided by group size. An example is given in Fig. 7.. Fig. 7. Chromosome decoding and initial population. 2. Fitness. To avoid problems associated with the RMHC grouping principle, distance was not used to measure intra-group differences. Since only one student is selected from each category to form a group, the final category center shape is viewed as the prototype shape for all heterogeneous groups (Fig. 8). Differences between actual and targeted chromosome shapes are computed, with chromosome fitness equaling the inverse of the absolute value of the difference. The higher the fitness value, the better the performance. The fitness function is formulated as follows: Definition 4: If a chromosome is composed of ( s1 , s 2 ,L, sc ) students selected from c different categories to form a team, chromosome fitness can be expressed as. 1. [sort ( D(v , v )) − sort ( D(s , s ))]. 2. i. j. i. , where. j. i, j = 1 ~ c, i ≠ j , and sort is a sorting function. 33.
(42) 3. Crossover. Two chromosomes randomly selected from a population can be crossed at a randomly chosen point to form two offspring. In this project, crossovers were performed only when the fitness of the offspring exceeded that of its parents.. d) Mutation. This operator allows for a crossover of two chromosomes even if doing so does not improve the fitness value. Again, the higher the fitness value, the better the performance.. DIANA’s optimal formation stage consists of five GA steps:. 1) Start with a randomly generated population based on classification stage results.. 2) Calculate the fitness of each chromosome in the population.. 3) Randomly select two chromosomes and check to see if fitness will increase following a crossover. If yes, perform the crossover; if no, perform a mutation with a probability of 0.001.. 4) Replace the current population with the new population.. 5) Return to step 2.. In the present study the iteration number was 1,000.. 5.3 Full thinking style grouping A stated goal is to find groupings with maximum A, L and J values; as discussed earlier, different groupings can affect those values. Fig. 9 presents an illustration of this problem in terms of the search concept, with computing complexity expressed as 34.
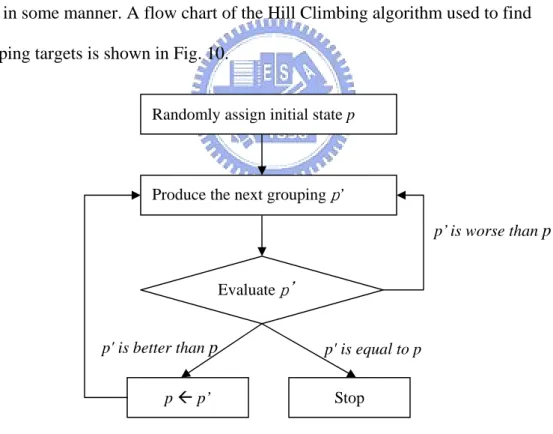
(43) O(n!)m for forming n m-person teams. Therefore, Hill Climbing and Simulated Annealing (two iterative improvement algorithms that search for targets from an initial state) were used to find an optimal solution. A, L , J. Goal. Fig. 9. Grouping problem search space. Hill Climbing algorithms always move toward a state that exceeds the current state in some manner. A flow chart of the Hill Climbing algorithm used to find grouping targets is shown in Fig. 10.. Randomly assign initial state p. Produce the next grouping p’ p’ is worse than p. Evaluate p'. p' is better than p. p' is equal to p. p Å p’. Stop. Fig. 10. Flow chart for the Hill Climbing algorithm used in this study. To find the next best p’, current grouping was used to find a near grouping (defined as a single exchange of teammates). Exchanges only occur among members. 35.
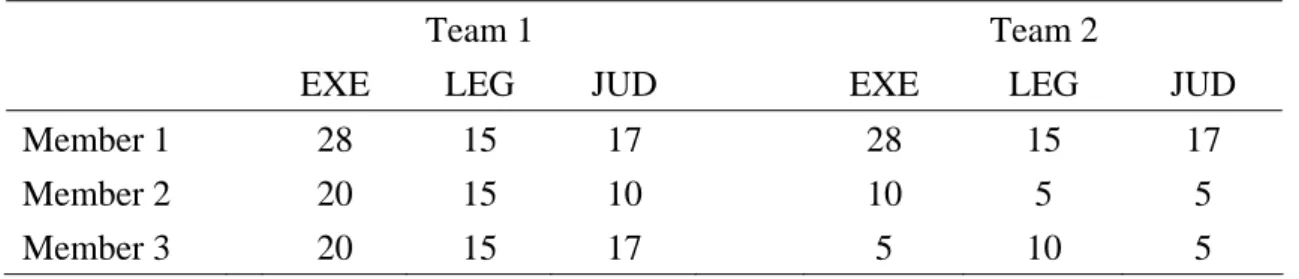
(44) in the same category—a condition that ensures the maintenance of phase 1 heterogeneity. An exchange example is shown in Fig. 11. For N teams there are 3 × C2N possibilities of near solutions, from which the best one is selected.. …… show the category. Search by swapping. Fig. 11. Method used to find next grouping. A comparison among the A, L, and J values (discussed in section 3.3) is performed to evaluate whether a near grouping is better than the current grouping.. ⎧ A1 ≥ A2 ⎪ If ⎨ L1 ≥ L2 and ( A1 − A2 ) + ( L1 − L2 ) + ( J 1 − J 2 ) > 0 , p1 is better than p2. ⎪J ≥ J 2 ⎩ 1 A more complex comparison is required when the A, L, and J values are equal. Table 4 presents an example for two teams produced from two groupings with TS values listed. Table 4. Thinking Style distributions for two teams.. Member 1 Member 2 Member 3. EXE. Team 1 LEG. JUD. 28 20 20. 15 15 15. 17 10 17. EXE. Team 2 LEG. JUD. 28 10 5. 15 5 10. 17 5 5. Both teams have one member with the same TS values (28, 15, 17). However, when teammate diversity, the effect of entirety, and the potentiality of finding a better solution are considered, the formation of Team 2 is better than that of Team 1. For this reason, Evalgroup was introduced to the process for the purpose of forming teams 36.
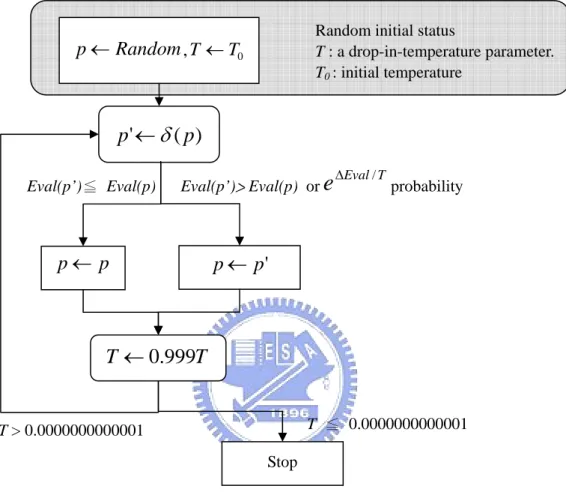
(45) with significant TS variation; larger Evalgroup values are desirable.. Evalgroup( Team i) = ( Ai1 − Ai 2 + Ai1 − Ai 3 + Ai 2 − Ai 3 ) + ( Li1 − Li 2 + Li1 − Li 3 + Li 2 − Li 3 ) + ( J i1 − J i 2 + J i1 − J i 3 + J i 2 − J i 3 ) Evalgroup (Team 1) = (8 + 0 + 0) + (0 + 0 + 0) + (7 + 7 + 0) = 30 Evalgroup (Team 2) = (18 + 23 + 5) + (10 + 5 + 5) + (12 + 0 + 12) = 90 Evalgroup (Team 2) = 90 > Evalgroup (Team 1) =30, therefore the Team 2 formation is considered better than that of Team 1.. Extended to n teams, the formula is defined as. n. [( Ai1 − Ai 2 + Ai1 − Ai 3 + Ai 2 − Ai 3 ). Eval2(p) = ∑ + ( Li1 − Li 2 + Li1 − Li 3 + Li 2 − Li 3 ) , where p is a grouping result. i =1. + ( J i1 − J i 2 + J i1 − J i 3 + J i 2 − J i 3 )]. If Eval2(p’) > Eval2(p), then p’ is better than p, therefore, Eval2(p) becomes the second evaluation.. In this study, a Hill Climbing algorithm with a dual evaluation mechanism was repeatedly used to identify better grouping results. The algorithm stopped when it could not find a better solution, but there was potential for it to get stuck in local maxima. Simulated Annealing algorithms were incorporated to deal with this problem. These algorithms can accept less optimal solutions by jumping over local maxima, thus the probability of tolerating a worse solution decreases exponentially. A flow chart describing this Simulated Annealing method is shown in Fig. 12. As shown, the. δ (Perturbation Rule) is designed to randomly select the next status (as opposed to selecting the next best status, as in Hill Climbing). Similar to the Hill Climbing. 37.
(46) method, teammates are exchanged to produce the next grouping, but the number of exchanges are limited: only two teams (out of the entire number of teams) can exchange single members, and only one time.. Random initial status T : a drop-in-temperature parameter. T0 : initial temperature. p ← Random , T ← T0. p' ← δ ( p ) Eval(p’)≦ Eval(p). Eval(p’)> Eval(p) or e. p← p. ∆Eval / T. probability. p ← p'. T ← 0.999T T ≦ 0.0000000000001. T > 0.0000000000001. Stop. Fig. 12. A flow chart of the Simulated Annealing method. The evaluation function in the Simulated Annealing algorithm is similar to that of the Hill Climbing algorithm (which combines two evaluation mechanisms). The Simulated Annealing algroithm evaluation function formula is defined as: ∆ Eval = [ A ( p ' ) − A ( p ) ] + [L ( p ' ) − L ( p ) ] + [J ( p ' ) − J ( p ) ] + 0 . 1 × [Eval 2 ( p ' ) − Eval 2 ( p ) ]. If ∆Eval > 0, meaning p’ is better than p, then p is replaced by p’, otherwise the current status will be kept. To avoid falling into a local optimal, p’ was allowed to. 38.
(47) replace p with a probability of. e ∆Eval / T. when ∆Eval ≦ 0. T decreased gradually in. tandem with increasing iterations, thus reducing the probability of accepting a worse solution. In this manner the searching problem is converged. A threshold of .0000000001 was set to stop this algorithm.. Two iterative improvement algorithms were integrated into the process described in this paper to achieve the stated grouping goals and to provide each team with strong thinking styles. Hill Climbing is used to find an approximate solution quickly, and Simulated Annealing is used to avoid falling into a local optimal.. 39.
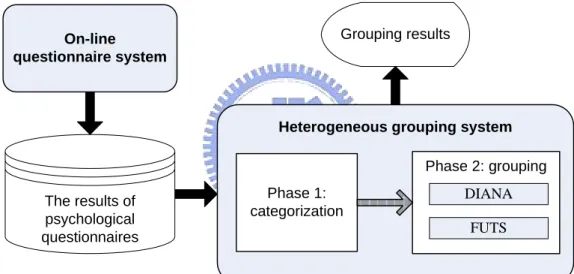
(48) Chapter 6 Implementation An online questionnaire was designed to make it easier for teachers to identify and collect data on the psychological features of their students. The questionnaire system was connected to a heterogeneous grouping system that combined DIANA (Differences In And Non-differences Among groups) and FUTS (Full Thinking Styles groups) (Fig. 13).. Grouping results. On-line questionnaire system. Heterogeneous grouping system Phase 2: grouping The results of psychological questionnaires. Phase 1: categorization. DIANA FUTS. Fig. 13. The computer-supported grouping system.. 6.1 On-line questionnaire system The online questionnaire system interface is shown in Fig. 14. The system was designed to allow researchers or teachers to collect psychological data from any sample, and to store the information in a database. As previously discussed, student characteristics are often multiple and continuous in nature.. 40.
(49) Fig. 14. Screen from the On-line Thinking Style Questionnaire used in this study. Lift frame shows guides and meaning of each point along a 5-point scale (A: not at all similar, B: a little similar, C: cannot judge, D: somewhat similar, D: all similar). Right frame shows the questionnaire content. Chinese version is for Taiwanese students.. 6.2 Heterogeneous grouping systems The interface for the heterogeneous grouping system is shown in Fig. 15. The first step entails loading data on student characteristics collected via the psychological questionnaire. Next, a teacher determines optimal group size according to instructional objectives, then chooses the DIANA or FUTS grouping method to generate a report listing student characteristic(s) and team numbers for heterogeneous group composition. The DIANA grouping method performs computations before recommending heterogeneous groups that meet the limitations discussed in Chapter 2; as stated, the purpose of DIANA is to allocate students to the most suitable group on both individual and whole class levels. In contrast, FUTS is used to generate groups with thinking styles that are conducive to brainstorming. Teachers can also load different psychological variables according to task requirements or instructional goals. In its present form, the proposed grouping system can consider a maximum of seven variables for composing groups consisting of 3-7 members; minor system. 41.
(50) modifications can increase both parameters.. Fig. 15. Heterogeneous grouping system interface. A test of DIANA’s capabilities was performed using 46 freshmen participants enrolled in an introductory computer science class at a technical university in northern Taiwan. Mean, standard deviation, and correlation data on the students’ thinking styles are presented in Table 5. A significant correlation was identified between the executive and judicial styles—that is, individuals with high executive style scores also had high judicial style scores. This made it difficult to identify exclusive legislative, judicial, or executive thinkers, and therefore impossible to compose heterogeneous groups with members representing one distinct thinking style.. 42.
(51) Table 5. Descriptive Statistics and Correlation Matrix for Thinking Styles as Grouping Factors. Thinking Style. Mean. SD. Executive. Legislative. Judicial. Executive Legislative Judicial. 31.93 30.33 25.33. 3.42 3.73 4.56. -r = .247 r = .408**. -r =.200. --. ** p < .01 The proposed DIANA system was successfully used to address this problem. As shown in Fig. 16, DIANA classified students into three categories with centers of (0.82, 0.79, 0.59), (0.79, 0.87, 0.75) and (0.66, 0.74, 0.57). Category 1 groups consisted primarily of students with high legislative scores, category 2 with high executive and high judicial scores, and category 3 with the lowest scores in all three thinking styles.. CATEGORIZING RESULT. Category Category Category Categoty. 0.85. 1 2 3 Centers. 0.8. Judicial Thinking Style. 0.75 0.7 0.65 0.6 0.55 0.5 0.45. 0.9 0.8. 0.4. 0.7 0.5. 0.55. 0.6. 0.65. 0.7. 0.75. 0.8. 0.85. 0.9. Executive Thinking Style. 0.6. Legislative Thinking Style. Fig. 16. Classification results for a sample of 36 students. The three category centers form a triangle. 43.
(52) In this project the mutation rate was set at 0.001. The average fitness during the evolutionary process is shown in Fig. 17. As indicated, the curve increases sharply for the first 28 generations, keeps rising, and remains steady after the 171st generation.. Fig. 17. Average fitness values during the evolutionary process.. 44.
(53) Chapter 7 Experiment An experiment was designed and conducted to evaluate the effectiveness of the grouping process described in the preceding chapters and the capabilities of DIANA and FUTS. The primary research questions were:. 1. Which group type (DIANA, FUTS, or randomly assigned) performs best in a cooperative learning situation?. 2. Which group type receives more positive subjective comments from its members concerning group partners and the cooperative learning process?. The treatment in this experiment was the grouping method (DIANA, FUTS, or random assignment); student participants attended an elementary or junior high school, thus calling for a 3 by 2 factorial design. Dependent variables were cooperative learning achievement and participant perceptions concerning member attitudes and the cooperative process. Based on the suggestions of a large number of researchers that heterogeneous grouping promotes positive interdependence, better group performance, and more effective interactions, heterogeneity was chosen as the grouping goal. A comparison was made among groups formed according to suggestions by DIANA (designed to form balanced groups based on educational equity), by FUTS (designed to form complete thinking style groups based on Sternberg’s suggestions), and by random selection.. 45.
數據
+7
相關文件
(1) Western musical terms and names of composers commonly used in the teaching of Music are included in this glossary.. (2) The Western musical terms and names of composers
The WG also conducted three open seminars, two student forums and a school questionnaire survey to collect views from the public, school principals, teachers,
This glossary aims to provide Chinese translations of those English terms commonly used in the teaching of Business, Accounting and Financial Studies at secondary level
The academic achievement of math of high-grade elementary school students is significant related to their SES and the self-concept in math, but is non-related to their
The study applies Discriminate Analysis to discuss the aspects of Junior high school students living Adjustment Scale and then develops a scale to be the standard of Junior
In different gender、time for study、time for cram、the parents education level and household income of junior high school students , some aspects of the academic stress were
The objective of this research was to investigate the major factors for choose Vocational College from Taiwanese Vocational High School students, and to identify any differences
The research objectives lie in the effects of real situated mobile learning on local culture education for students.. Methodologically speaking, 23 students at an elementary school
