Intra-Industry Effects of Corporate
Capital Investment Announcements
Sheng-Syan Chen, Lan-Chih Ho, andYi-Cheng Shih'
We examine how announcements of corporate capital investments by one firm affect the stock prices of its competitors. We find that on average, rivals experience a significantly negative
valuation effect. The results suggest that for the sample as a whole, the competitive effect dominates the contagion effect. We further examine various factors that could potentially explain the heterogeneous intra-industry effects of capital investment announcements. We find that rivals' share prices are more adversely affected when the announcer experiences a higher announcement effect or is the first mover in the industry. We also show that rivals experience a greater wealth loss when they have poorer investment opportunities or higher financial leverage.
Announcements of corporate capital investments are associated with significant positive stock retums for industrial firms. Many researchers attribute these valuation efFects to the signaling of new and positive information about the announcing firm's fiature cash flow prospects.' However, a look at the stock price reaction for the capital investment firm does not disclose whether the information in the investment announcement is firm-specific or industry-wide, nor does it tell us whether other firms in the same industry suffer fi-om changes in the competitive structure ofthe industry. To address these issues, we examine how announcements of capital investments by one firm affect the stock prices of its competitors.
Lang and Stulz (1992), Laux, Starks, and Yoon (1998), and other studies suggest that the impact of capital investment announcements on the investing firm's competitors depends on the interaction of two effects: the competitive effect and the contagion effect. The competitive effect suggests that capital investment announcements by one firm result in negative valuation effects on other firms in the same industry. Capital investments permit a firm to gain a competitive advantage over other firms in the industry. A firm can gain a competitive advantage, for example, by becoming the low-cost producer and/or by differentiating its product or service (Porter, 1980). The net effect of capital investments increases the investing firm's profits and market share, and those of its rivals suffer a reduction. The competitive intra-industry effect implies that the firm announcing capital investments should experience a positive stock valuation impact at the expense of its industry rivals.
The authors wish to thank Dosoung Choi, Dan Ervin. Frank C. Jen, Cheng-few Lee, Lemma Senbet, Alex Triantis, and especially an anonymous referee for helpful eomments and suggestions. Seminar participants at the 2002 FMA Annual Meeting, the Tenth Annual Conference on Paeifie Basin Finance, Economics and Accounting Conference, National Taiwan University, National Central University, National Sun Yat-sen University, Feng Chia University, and Chung Yuan Christian University provided many valuable comments. The views expressed do not represent those ofthe Central Bank of China. Sheng-Syan Chen acknowledges funding from the National Science Council in Taiwan (NSC91-2416-HI55-006).
' Sheng-Syan Chen is a Professor at National Taiwan University in Taipei, Taiwan. Lan-Chih Ho is a Senior Economist at The Central Bank of China in Taipei, Taiwan. Yi-Cheng Shih is a Ph.D. Student at National Taiwan University in Taipei, Taiwan.
'See, for example, McConnell and Muscarella (1985), Woolridge and Snow (1990), Chan, Gau, and Wang (1995), Chen and Ho (1997), and Vogt( 1997).
126 Financial Management • Summer 2007 In contrast, the contagion effect suggests that capital investment announcements by one firm result in positive spillover effects on other firms in the same industry. The positive stock price reaction to announcements of capital investments reveals positive news about the investing firm's eamings prospects. The enhanced eamings potential of the investing firm may refiect positive changes in the industry as a whole such that the positive announcement effect is contagious within the industry. The contagion effect implies that industry rivals should experience a positive impact associated with the announcements of corporate capital investments.
For a sample of 250 announcements of corporate capital investments in 66 industries from 1989 to 1998, we show that on average, rival firms experience significantly negative share price responses. The results suggest that for the sample as a whole, the competitive effect dominates the contagion effect. The average results in our study differ from many ofthe previous studies on the stock price reactions of industry rivals, which dealt with different types of corporate announcements. Laux et al. (1998) indicate that most ofthe previous studies generally find evidence of net contagion effects. That is, rival firms' stock price reactions on average tend to be in the same direction as the announcing firm's price reaction. For example, net contagion effects are found upon announcements of eamings (Foster, 1981), merger proposals (Eckbo, 1983), management eamings forecasts (Baginski, 1987), going-private transactions (Slovin, Sushka, and Bendeck, 1991), bankruptcy (Lang and Stulz, 1992), and dividends (Firth, 1996). In contrast to these studies, we find evidence of net competitive effects for announcements of corporate capital investments. Our evidence indicates that capital investment announcements reveal changes in the competitiveness ofthe announcing firm such that the expected increase in the firm's future cash flows appears to occur at the expense of its rivals.
To determine whether announcements of corporate capital investments have heterogeneous intra-industry effects, we examine various factors that may influence the competitive and contagion effects. Lang and Stulz (1992) provide the important result that these effects can differ across industries. Laux et al. (1998) show that diverse rivals' reactions can also occur within an industry. They find that firm characteristics can infiuence whether rival firms have a competitive or a contagion reaction. In this study, we relate rivals' share price responses to a number of potentially important explanatory factors: 1) the announcing firm's characteristics, 2) industry characteristics, and 3) rival firms' characteristics.
We find that rivals' share price responses are significantly negatively related to the announcing firm's abnormal retum. Our evidence suggests that industry rivals' share prices are more adversely affected when the valuation effect on the announcing firm is more favorable. This finding provides further support that the competitive effect dominates the contagion effect in our sample. Our results also confirm previous findings that the greater the effect on the share price ofthe announcing firm, the more pronounced is the intra-industry effect (see Hertzel, 1991 and Firth, 1996).
We also show that industry rivals are more adversely affected by the first-movers' announcements than by the followers' announcements. First announcers of capital investments are at a competitive advantage over the competitors, because of the entry barriers that the first movers can erect (Jovanovic and MacDonald, 1994 and Bemardo and Chowdhry, 2002). The losses or lost opportunities for the competitors that are due to the first mover's monopolist advantages should have a negative impact on rivals. When followers make capital investments, rival firms could also be adversely affected because the imitators share some ofthe monopolist profits. However, the adverse effect on the rivals at the time of imitation should be smaller than that at the time of capital investments by first movers, since the announcing firms have more monopolistic advantages in the latter case than in the former case (Lee, 1995).
We further find that the industry rivals' share price response associated with capital investment announcements is significantly positively related to their investment opportunities. Rivals with better investment opportunities are likely to have worthwhile investments and make better
Chen, Ho, & Shih »Intra-industry Effects of Corporate Capital Investment Announcements 127 investment deeisions (Lang, Stulz, and Walkling, 1989 and 1991). They are also expected to respond more effectively to competitive challenges in the industry (Laux et al., 1998). On the other hand, rivals without extensive growth options in their future operations are not as well prepared to respond to competitive threats and could experience large negative competitive effects. Therefore, the valuation impact of capital investment announcements on rivals is less favorable for those with poor investment opportunities.
We show that rival firms with higher financial leverage experience a more adverse valuation effect associated with the announcements of capital investments than do those with lower leverage. A firm's debt overhang may prevent it from raising funds to finance positive net present value (NPV) projects (Myers, 1977; Phillips, 1995; Lang, Ofek, and Stulz, 1996; and Kovenock and Phillips, 1997). Financial leverage may also limit a firm's ability to make investments to respond to competitive challenges (Stulz, 1990). Therefore, industry rivals with higher leverage incur more negative competitive effects, because of their limited ability to compete expeditiously.
The paper proceeds as follows. Section I develops the hypotheses on the potentially important determinants that could explain the cross-sectional variation of the valuation effects of capital investment announcements on industry rivals. Section II describes our sample selection and methodology. Section III reports the results on the stock price response for the announcing firms and the industry rivals, as well as the results of the cross-sectional analysis. Section IV concludes.
I. The Determinants of the Industry Effects of Capital ,
Investment Announcements
In this section, we investigate the factors that could explain the cross-sectional variation of the valuation impact of capital investment announcements on industry rivals.
A. Announcing Firm's Characteristics
1. Stock Price Response for the Announcing Firm
The intra-industry effects of corporate announcements may depend on the magnitude of the announcing firm's signal (Hertzel, 1991; Firth, 1996; and Erwin and Miller, 1998). Capital investment announcements that convey little or no information about the announcing firm are not likely to convey information about the industry in which the firm operates. On the other hand, capital investment announcements that are accompanied by significant share price reactions for the announcing firms are more likely to have intra-industry information effects. The competitive effect suggests that when the share price response to a firm's announcement of capital investments is more favorable, the industry rivals experience a more pronounced negative share price response, in which case we expect a negative relation between the announcement effects on the announcing firms and the abnormal retums of the rival portfolios. However, the contagion effect suggests a positive relation, as rivals are expected to benefit more in terms of stock price response when the announcing firm experiences a more favorable abnormal retum.
2. iVIarket Share of the Announcing Firm
Capital investment announcements of firms that are dominant in the industry are expected to have more pronounced intra-industry effects. These firms are more likely to be perceived as leaders in the industry and normally receive more publicity than other firms (Akhigbe, Madura,
128 Financial Management • Summer 2007 and Whyte, 1997). In contrast, announcements of capital investments by firms with relatively small market shares are less likely to be important for rivals. Firms with smaller market shares typically serve narrower markets which may not be representative ofthe markets served by other firms in the industry (Hertzel, 1991). Furthermore, announcements by small market share firms are unlikely to convey important information about the competitive balance within the industry. Therefore, the intra-industry impact of capital investment announcements is expected to be less pronounced when the investing firm has a smaller market share.
3. Growth Opportunities ofthe Announcing Firm
Firms with high growth opportunities are more likely to have positive NPV projects and gain a competitive advantage over other firms in the industry (Woolridge and Snow, 1990). Chen and Ho (1997) and Chung, Wright, and Charoenwong (1998) find that capital expenditures by firms with good growth opportunities are generally regarded as worthwhile, but those by firms with poor growth opportunities are not. This suggests that capital investments create more opportunities for competitive advantage for announcing firms with better growth opportunities. Therefore, we hypothesize that the valuation impact of capital investment announcements on rivals should be less favorable when the announcing firm has higher growth opportunities.
4. Entry Timing of the Announcing Firm
First announcers of capital investments are at a competitive advantage over their competitors, because ofthe entry barriers that the first movers can erect, which can serve to deter responses by rivals and enhance the first movers' ability to earn excess profits. For example, Jovanovic and MacDonald (1994) study the life cycle ofthe U.S. automobile tire industry and find that firms that scale up early enjoy higher rents during the early phases ofthe industry life cycle and hence have higher market values. Bernardo and Chowdhry (2002) also show that among the firms that expand, those that expand early have higher valuations. The losses or lost opportunities for the competitors due to the first mover's monopolist advantages should have a negative impact on rivals. When followers make capital investments, they (i.e. the imitators) also share some ofthe monopolist profits. Therefore, when imitative responses take place, rival firms could also be adversely affected. However, the adverse effect on the rivals at the time of imitation by followers should be smaller than that at the time of capital investments by first movers, since the announcing firms have more monopolistic advantages in the latter case than in the former case (Lee, 1995). Therefore, industry rivals are expected to be more adversely affected by the first-movers' announcements than by the followers' announcements.
B. Industry Characteristics 1. Degree of Relatedness
Previous studies show that the intra-industry effects of corporate events may also depend on the announcing firm's degree of relatedness to the industry (Lang and Stulz, 1992 and Akhigbe and Martin, 2000). Capital investment announcements of firms having a performance more closely related to other firms in the same industry are expected to elicit more pronounced intra-industry contagion efFects. The positive prospects of the firm that announces capital investments are more likely to be transmitted throughout the industry when the firm's performance is closely linked to its competitors. Therefore, rivals are expected to experience better share price responses associated with investment announcements when the announcer is closely related to the industry.
Chen, Ho, & Shih • Intra-industry Effects of Corporate Capital Investment Announcements 129
2. Degree of Industry Competition
Capital investment announcements may signal an unexpected improvement in the investing firm's cash fiows that are derived from an increase in the investing firm's market share (Woolridge and Snow, 1990). With imperfect competition, the investing firm may gain at the expense of rival firms such that the investment announcement will have a negative effect on competing firms in the same industry. Moreover, the less competitive the industry is, the greater are the rents that can be extracted from the rival firms, because ofthe change in the competitive position ofthe investing firm (Lang and Stulz, 1992). Therefore, the intra-industry stock price reaction for rivals is expected to be more negative in industries with a lower degree of competition.
C. Rivals' Firm Characteristics 1. Rivals' Relative Size
Scherer and Ross (1990) argue that large firms are generally more established and diversified, and hence they are more able to withstand competitors' moves. When large firms are threatened by competitors' moves in the industry, the market expects them to respond to the challenge. In addition, large firms usually have a wider range of products, and thus they should be less adversely affected by any single move by their industry competitors (Hendricks and Singhal, 1997). On the other hand, small firms are less established and diversified, and therefore they are more vulnerable to competitors' challenges. We expect that the intra-industry effects of capital investment announcements are more negative for relatively small rivals.
2. Rivals' Investment Opportunities
The valuation impact of capital investment announcements on rivals is expected to be positively related to their investment opportunities. Rival firms with better investment opportunities are likely to have more worthwhile projects and are generally perceived by the market as firms that have better investment strategies (Lang et al., 1989 and 1991). They are also better prepared to respond effectively to any new industry environment (Laux et al., 1998). In contrast, rival firms without extensive growth options in their future operations are not as well prepared to respond effectively to competitive challenges in the industry. They hence incur more negative intra-industry stock price reactions.
3. Rivals' Free Cash Flow
The availability of intemal funds has an impact on corporate investment (Fazzari, Hubbard, and Petersen, 1988 and Hoshi, Kashyap, and Scharfstein, 1991). High free-cash-fiow firms have better ability to invest and more fiexibility to respond to changes in market conditions. Bolton and Scharfstein (1990) provide an explicit model in which an important determinant of product-market success is the degree to which firms can finance investment with intemally-generated funds. They suggest that while extemal financing disciplines management, it makes the firm vulnerable in its product markets. Therefore, rival firms with high free cash fiow are expected to experience less negative competitive effects.
4. Rivals' Financial Leverage
Jensen (1986) suggests that debt can reduce free cash fiow that may otherwise be allocated to inefficient investment. However, a firm's debt overhang could be large enough to prevent it from
130 Financiai Management • Summer 2007 raising funds to finance positive NPV projects (Myers, 1977; Phillips, 1995; Lang et al., 1996; and Kovenock and Phillips, 1997). Financial leverage may also limit a firm's ability to make investments to respond to competitive threats in the industry (Stulz, 1990). Therefore, rivals with higher degrees of financial leverage incur more negative competitive effects, because of their limited ability to compete expeditiously. This suggests that the intra-industry stock price reaction is expected to be more negative for rival firms with higher degrees of financial leverage. 5. Rivais' R&D intensity
Firms with high R&D intensity are expected to have greater technological capability and opportunities for product-market success (Kelm, Narayanan, and Pinches, 1995). They can also be expected to respond more effectively to competitive challenges in the industry (Chan, Martin, and Kensinger, 1990 and Mauri and Michaels, 1998). On the other hand, firms with low R&D intensity are not as well prepared to respond to competitive threats and could experience large negative competitive effects. Therefore, the valuation impact of capital investment announcements on rivals is expected to be positively related to their R&D intensity.
II. Sample Selection and Methodology
In this section, we describe our sample and how we measure announcement-period abnormal retums. We also provide details on the proxy variables we use for our cross-sectional analysis. A. Sample
We obtain our sample of initial announcements of capital investments by firms listed on the New York Stock Exchange (NYSE), the American Stock Exchange (AMEX), or the Nasdaq from UMI's Wall Street Journal {WSJ) Ondisc database. We use the words and phrases and their synonyms, commonly used to describe corporate capital investments as keys for a database search routine. Examples are "business investments," "capital budget," "capital expenditures," "capital investments," "capital outlays," "capital spending," "long-term expenditures," "planned expenditures," along with other pertinent words and phrases.^ Our sample period is from January 1989 to December 1998.
To avoid any confounding events that could distort the measurement of the valuation effects on the announcing firms or the measurement of the intra-industry effects, we exclude those announcements by firms that made other announcements three days before or three days after the initial announcement date. We also exclude those announcements if there is no rival firm in the announcing firm's industry. We define the industry by the primary four-digit Standard,Industrial Classification (SIC) code in Compustat.^ Finally, we exclude the announcing firms or their rivals if they do not have data available from the retums files on the Center for Research in Securities Prices (CRSP) tape.
Our final sample comprises 250 capital investment announcements by 153 different firms in 66 industries. Table I provides the sample distribution by year of announcement, by category of capital
^Any announcements we use must be directly pertinent to coq^orate capital investment deeisions. Therefore, we exclude from the sample announcements of inter-corporate acquisitions, R&D, strategic alMances, and product strategies. 'As indicated by Guenther and Rosman (1994) and Kahle and Walkling (1996), CRSP SIC codes are not very representative of the industries in which firms actually operate, which can lead to imprecise inferences. Compustat SIC codes appear to be more reliable.
Chen, Ho, & Shih • Intra-Industry Effects of Corporate Capital Investment Announcements 131
Table I. Sample Distribution of Capital Investment Announcements
This table summarizes the sample distribution of capital investment announcements by firms listed on the New York Stock Exchange (NYSE), the American Stock Exchange (AMEX), or the Nasdaq from 1989 to 1998. We obtain our sample from the Wall Street Journal. There are 250 announcements by 153 different firms in 66 industries. The industries are based on the primary four-digit SIC code in Compustat.
Panel A. Sample Distribution by Year
Year Number of Announcements Percent of Sample
T989 ^8 Ti
1990 25 10.0 1991 16 6.4 1992 26 10.4 1993 27 10.8 1994 41 16.4 1995 49 19.6 1996 27 10.8 1997 15 6.0 1998 6 2.4 Total 250 100.0Panel B. Sample Distribution by Category
Category General Capacity Plant Capital Budget Increases Expansion Modernization
Construction Construction
Number of Announcements 127 29 94
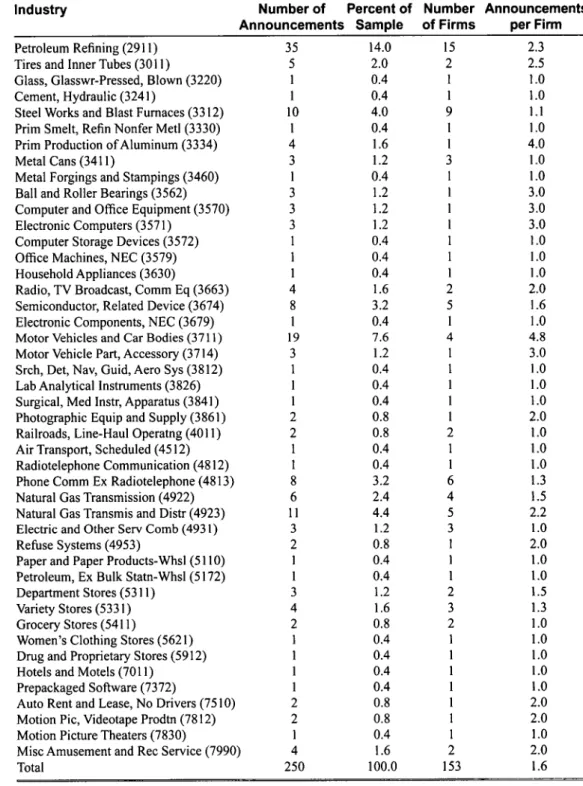
Panel C. Sample Distribution by Industry
Industry Number of Percent of Number Announcements Announcements Sample of Firms per Firm
Gold and Silver Ores (1040)
Crude Petroleum and Natural Gas (1311) Oil and Gas Field Services, NEC (1389) Bakery Products (2050)
Beverages (2080)
Textile Mill Products (2200)
Knitting Mills (2250)
Carpets and Rugs (2273)
Apparel and Other Finished Pds (2300) Lumber and Wood Pds, Ex Fum (2400) Paper and Allied Products (2600) Paper Mills (2621)
Paperboard Mills (2631)
Paperboard Containers, Boxes (2650) Newspaper: Pubg, Pubg and Print (2711) Indl Inorganic Chemicals (2810) Plastc, Synth Matls, Ex Glass (2820) Plastics, Resins, Elastomers (2821) Pharmaceutical Preparations (2834) Soap, Detergent, Toilet Preps (2840) Industrial Organic Chemicals (2860)
1 29 4 1 7 1 1 1 1 2 2 8 2 1 4 4 2 1 2 1 4 0.4 11.6 1.6 0.4 2.8 0.4 0.4 0.4 0.4 0.8 0.8 3.2 0.8 0.4 1.6 1.6 0.8 0.4 0.8 0.4 1.6 1 19 1 1 2 1 1 1 1 2 1 ; 5 2 1 4 3 2 1 2 1 3 1.0 1.5 i.O 1.0 3.5 .0 .0 .0 .0 .0 l.O .6 .0 .0 .0 .3 .0 .0 .0 .0 .3
132 Financial Management • Summer 2007 Table I. Sample Distribution of Capital Investment Announcements
{Continued)
Industry Number of Percent of Number Announcements
Announcements Sample of Firms per Firm
Petroleum Refining (2911) Tires and Inner Tubes (3011)
Glass, Glasswr-Pressed, Blown (3220) Cement, Hydraulic (3241)
Steel Works and Blast Furnaces (3312) Prim Smelt, Refin Nonfer Metl (3330) Prim Production of Aluminum (3334) Metal Cans (3411)
Metal Forgings and Stampings (3460) Ball and Roller Bearings (3562) Computer and Ofifice Equipment (3570) Electronic Computers (3571)
Computer Storage Devices (3572) Office Machines, NEC (3579) Household Appliances (3630)
Radio, TV Broadcast, Comm Eq (3663) Semiconductor, Related Device (3674) Electronic Components, NEC (3679) Motor Vehicles and Car Bodies (3 711) Motor Vehicle Part, Accessory (3714) Srch, Det, Nav, Guid, Aero Sys (3 812) Lab Analytical Instruments (3826) Surgical, Med Instr, Apparatus (3841) Photographic Equip and Supply (3861) Railroads, Line-Haul Operatng (4011) Air Transport, Scheduled (4512) Radiotelephone Communication (4812) Phone Comm Ex Radiotelephone (4813) Natural Gas Transmission (4922) Natural Gas Transmis and Distr (4923) Electric and Other Serv Comb (4931) Refuse Systems (4953)
Paper and Paper Products-Whsl (5110) Petroleum, Ex Bulk Statn-Whsl (5172) Department Stores (5311)
Variety Stores (5331) Grocery Stores (5411)
Women's Clothing Stores (5621) Drug and Proprietary Stores (5912) Hotels and Motels (7011)
Prepackaged Software (7372)
Auto Rent and Lease, No Drivers (7510) Motion Pic, Videotape Prodtn (7812) Motion Picture Theaters (7830)
Mise Amusement and Rec Service (7990) Total 35 5 1 1 10 1 4 3 1 3 3 3 1 1 1 4 8 1 19 3 1 1 1 2 2 1 1 8 6 11 3 2 1 1 3 4 2 1 1 1 1 2 2 1 4 250 14.0 2.0 0.4 0.4 4.0 0.4 1.6 1.2 0.4 1.2 1.2 1.2 0.4 0.4 0.4 1.6 3.2 0.4 7.6 1.2 0.4 0.4 0.4 0.8 0.8 0.4 0.4 3.2 2.4 4.4 1.2 0.8 0.4 0.4 1.2 1.6 0.8 0.4 0.4 0.4 0.4 0.8 0.8 0.4 1.6 100.0 15 2 1 1 9 1 1 3 1 1 1 1 1 1 1 2 5 1 4 1 1 1 1 1 2 1 1 6 4 5 3 1 1 1 2 3 2 1 1 1 1 1 1 1 2 153 2.3 2.5 1.0 1.0 1.1 1.0 4.0 1.0 1.0 3.0 3.0 3.0 1.0 1.0 1.0 2.0 1.6 1.0 4.8 3.0 1.0 1.0 1.0 2.0 1.0 1.0 1.0 1.3 1.5 2.2 1.0 2.0 1.0 1.0 1.5 1.3 1.0 1.0 1.0 1.0 1.0 2.0 2.0 1.0 2.0 1.6
Chen, Ho, & Shih • Intra-industry Effects of Corporate Capital Investment Announcements 133 investments, and by industry. There is no concentration of announcements in any particular year or particular period. Our sample of capital investment announcements shows 127 announcements of general capacity expansion construction, 29 announcements of plant modernization construction, and 94 announcements of capital budget increases. Most of the announcements come from five industries: crude petroleum and natural gas (1311), petroleum refining (2911), steel works and blast furnaces (3312), motor vehicles and car bodies (3711), and natural gas transmission and distribution (4923). These five industries constitute about 42% of the total sample, with petroleum refining having the most announcements (about 14% of the total sample). The motor vehicles and car bodies industry has the highest frequency of capital investment announcements per firm. On average, each firm in this industry makes about five announcements in the ten-year sample period.
B. Measuring Announcement-Period Abnormal Returns
We use standard event-study methods to examine stock price responses to announcements of corporate capital investments. We define day 0 as the initial announcement date. We calculate the abnormal retum as the difference between the actual retum and an expected retum generated by the market model. We use the value-weighted CRSP index as a proxy for market retums and estimate the parameters of the market model using the data over the period from 200 to 60 days before the announcement date. The two-day (-1, 0) announcement-period abnormal retum captures the price reaction to the capital investment announcement.
We also generate abnormal retums for each rival firm that is in the same four-digit SIC code as the announcing firm. However, because industry competitors for each announcing firm have a common event date, there is a potential cross-sectional correlation of retums problem leading to biased statistical tests of significance (see Szewczyk, 1992 and Firth, 1996). To overcome this problem, we group the industry competitors into value-weighted portfolios, with the weights equal to the market value of equity for the fiscal year preceding the announcement." We then calculate the competitors' two-day (-1,0) announcement-period abnormal retums, using industry-grouped portfolio retums. We conduct significance tests using the z-statistic, as described in Dodd and Wamer (1983), and the Wilcoxon signed-rank test.
C. iVIeasuring Proxy Variables for the Cross-Sectional Analysis
We collect data on the proxies for the cross-sectional factors from the CRSP and Compustat files and the ^^57 articles. We measure the announcement effect on the announcing firm by its two-day announcement-period abnormal retum. We define the market share of the announcing firm as total sales of the announcing firm divided by total industry sales for the fiscal year prior to the announcement. We estimate the growth opportunities of the announcing firm by a simple measure of Tobin's q: the ratio of the market value of the firm's assets to the book value of the firm's assets for the fiscal year preceding the announcement, where the market value of assets equals the market value of equity plus the liquidating value of preferred stock plus the book value of long-term debt minus the net working capital. We create an entry timing dummy that is equal
••Previous studies use either value-weighted or equally-weighted methods to form rival portfolios (see, e.g., Slovin et al., 1991; Lang and Stulz, 1992; and Szewczyk, 1992). Lang and Stulz (1992) find little difference between the results based on value-weighted or weighted portfolios. Our conclusions in this study remain unchanged when the equally-weighted method is used.
134 Financial Management • Summer 2007 to one if the announcing firm is the first mover, and zero otherwise. For each investment category, we define the first firm to announce a capital investment in the industry as the first mover.
As for the industry characteristics, the announcing firm's degree of relatedness to the industry is measured by the correlation of stock retums between the announcer and its competitors for the year preceding the announcement. We use the Herfindahl index as a proxy for the degree of industry competition, where the Herfindahl index equals the sum of the squared fraction of industry sales by all firms in the industry for the fiscal year prior to the announcement. Although this index is a measure of concentration, it is widely used as a proxy for competitiveness, because the degree of concentration and the degree of competition are generally inversely related.
Finally, to obtain a single rival portfolio's characteristics we group all the rival firms' characteristics in the same industry into a value-weighted portfolio. We measure the relative size ofthe rivals by the market value of equity ofthe rivals divided by the announcer's market value of equity for the fiscal year preceding the announcement.' We estimate the investment opportunities of the rivals by the simple measure of Tobin's q as described above. We define rivals' free cash fiow ratio as operating income before depreciation minus interest expense, taxes, preferred dividends, and common dividends, divided by the book value of total assets, for the fiscal year preceding the announcement. We measure rivals' financial leverage by the ratio ofthe book value of total debt to the market value of total assets for the fiscal year prior to the announcement. We define rivals' R&D intensity as the ratio of R&D expenditures to net sales for the fiscal year prior to the announcement.
Table II reports the information on several cross-sectional factors used in this study. The number of observations varies because of data availability. The average (median) announcer's market share and growth opportunities are 0.15 (0.09) and 1.32 (1.08), respectively. The mean (median) retums correlation is 0.4 (0.4) and the mean (median) Herfindahl index is 0.21 (0.15). The rivals' size is, on average, smaller than that ofthe announcers'. The average (median) rivals' growth opportunities, free cash fiow, and financial leverage are 1.35 (1.18), 0.13 (0.12), and 0.55 (0.38), respectively. The rivals' R&D intensity averages 0.05 (0.01 at the median).
III. Results
In this section, we first report stock price responses for the announcing firms and industry rivals. We then report evidence on industry rivals' abnormal retums by dividing the sample according to the announcer's characteristics, industry characteristics, and rivals' characteristics. Finally, we discuss the results on the cross-sectional regression analysis of the announcement-period abnormal retums of industry rivals.
A. Stock Price Response for the Announcing Firms and Industry Rivals
Table III provides estimates of two-day announcement-period abnormal retums associated with the announcement of corporate capital investments. The announcers of capital investment experience a significantly positive average (median) abnormal retum of 0.46% (0.17%) for the two-day announcement period. Therefore, announcements of corporate capital investments are associated with significantly positive valuation effects. This finding is consistent with previous evidence.
^Our results are similar if we use a dummy variable that takes a value of one if the relative size of the rivals is greater than one, and zero otherwise.
Chen, Ho, & Shih • Intra-industry Effects of Corporate Capital Investment Announcements Table II. Descriptive Statistics for the Explanatory Variables
135
We define the market share of the announcing firm as total sales of the announcing firm divided by total industry sales for the fiscal year prior to the announcement. We use a simple measure of Tobin's q to estimate the growth opportunities ofthe announcing firm: the ratio ofthe market value ofthe firm's assets to the book value ofthe firm's assets for the fiscal year preceding the announcement, where the market value of assets equals the market value of equity plus the liquidating value of preferred stock plus the book value of long-term debt minus the net working capital. We measure the retums correlation by the correlation of stock retums between the announcer and its competitors for the year preceding the announcement. The Herfindahl index is the sum ofthe squared fraction of industry sales by all firms in the industry for the fiscal year prior to the announcement. We group all the rival firms' characteristics in the same industry into a value-weighted portfolio to obtain a single rival portfolio's characteristics. We measure the relative size of the rivals by the market value of equity ofthe rivals divided by the announcer's market value of equity for the fiscal year preceding the announcement. Again, we use Tobin's q to develop the proxies for the investment opportunities ofthe rivals. We define rivals' free cash flow ratio as operating income before depreciation minus interest expense, taxes, preferred dividends, and common dividends, divided by the book value of total assets, for the fiscal year preceding the announcement. We measure rivals' financial leverage by the ratio of the book value of total debt to the market value of total assets for the fiscal year prior to the announcement. We define rivals' R&D intensity as the ratio of R&D expenditures to net sales for the fiscal year prior to the announcement. The number of observations varies because of data availability.
Variable Announcer's Market Share Announcer's Growth Opportunities Returns Correlation Herfindahl Index Relative Size ofthe Rivals
Rivals' Investment Opportunities Rivals' Free Cash Flow Rivals' Financial Leverage
Rivals' R&D Intensity
N 250 250 250 250 250 250 250 249 219 Mean 0.15 1.32 0.40 0.21 0.82 1.35 0.13 0.55 0.05 Median 0.09 1.08 0.40 0.15 0.86 1.18 0.12 0.38 0.01 Standard Deviation 0.19 1.12 0.23 0.17 0.32 0.74 0.05 0.58 0.16
Table III also presents the results for rival portfolios. The evidence shows that industry rivals experience small, but significatitly negative, abnonnal retums for the tvi^o-day announcement period. For the two-day announcement period, the rivals experience an average (median) value loss of 0.28% (0.19%). Our results suggest that on average, the negative competitive effect dominates the positive contagion effect. Therefore, capital investment announcements indicate changes in the competitiveness of the announcing firm such that the expected increase in the firm's future cash flows appears to occur at the expense of its rivals.
To explore the question of how much ofthe market value gains ofthe capital investment firms represent a wealth transfer from rivals, we calculate the dollar value of gains to the announcing firms and the dollar losses experienced by rival firms. Using the two-day (-1, 0) announcement-period abnormal retum and the firms' market value of equity for the fiscal year preceding the announcement, we find that at 1989 prices, the average dollar gain to a capital investment firm is $49 million and the average total dollar loss experienced by an industry rival firm corresponding
136 Financiai Management • Summer 2007 Table III. Two-Day Announcement-Period Abnormal Returns Associated with
Capital Investment Announcements
We estimate two-day announcement-period abnormal retums by using the standard market model procedure with the parameters estimated for the period 200 days to 60 days before the announcement. The sample includes all announcements of capital investments made between 1989 and 1998 for firms for which a pri-mary four-digit SIC code is available from the Compustat data file (250 capital investment announcements). A rival portfolio is a value-weighted portfolio of firms with the same primary four-digit SIC code for which retums are available from the CRSP files. We conduct significance tests by using the z-statistic described in Dodd and Wamer (1983) and the Wilcoxon signed-rank test.
Mean Abnormal Retum (%) z-statistic
Median Abnormal Retum (%) Wilcoxon p-value
*** Significant at the 0.01 level. ** Significant at the 0.05 level.
Announcing Firms 0.46** 2.21 0.17*** 0.01 Industry Rivals -0.28*** -2.56 -0.19*** 0.01
to each capital investment is $16 million.* At 1998 prices, the corresponding average dollar gain to an announcer and the average dollar loss experienced by an industry rival firm are $64 million and $19 million, respectively. The results suggest that a substantial portion (about 30% to 33%) of the dollar gain to the announcers represents a wealth transfer from the rival firms.
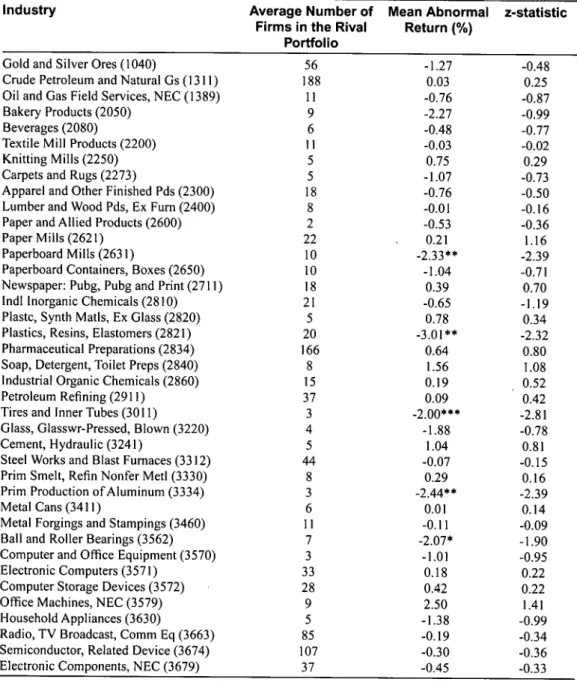
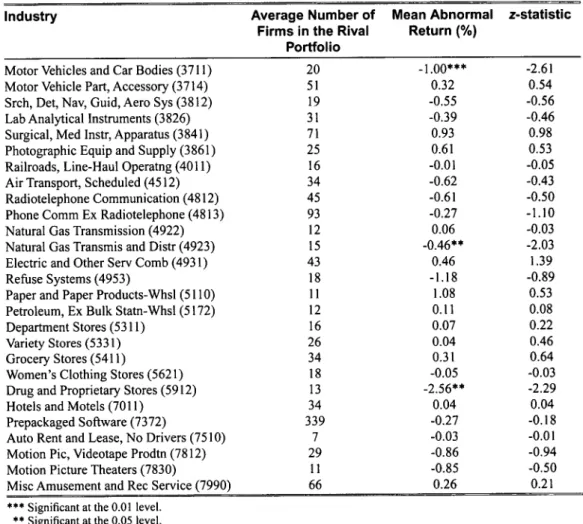
We further classify the rival portfolios' two-day announcement-period abnormal retums by industry in Table IV. If an industry in our sample has more than one capital investment announcement, we report the average of the industry portfolio abnormal retums across all capital investment announcements. We compute z-statistics for each industry by using the standardized rival portfolio abnormal retum for each capital investment announcement. Of the 66 industries, 39 (about 59%) have negative average two-day announcement-period abnormal retums, which is significantly more than we would expect under the null hypothesis of no abnormal retums.
An examination of the z-statistics in Table IV shows that rivals in industries such as paperboard mills (2631), plastics, resins, and elastomers (2821), tires and inner tubes (3011), primary production of aluminum (3334), ball and roller bearings (3562), motor vehicles and car bodies (3711), natural gas transmission and distribution (4923), and dmg and proprietary stores (5912) experience significantly unfavorable share price responses. Capital investments by firms in these industries seem to give them a greater competitive advantage over other firms in the same industry, and hence their rivals experience more negative share price responses. However, we note that these eight industries constitute only about 12% of the industries in the sample. The z-statistics for the remaining industries indicate that the rivals have responses indistinguishable from zero. Therefore, the normal rival reaction to announcements of corporate capital investments is weak. B. Abnormal Returns for Subsampies of Industry Rival Portfolios Grouped by
Various Characteristics
Table V reports the industry rivals' announcement-period abnormal retums, which we obtain by dividing the sample according to the announcer's characteristics, industry characteristics, and
'The average dollar loss for a rival firm in rival portfolio / is estimated by (rival portfolio ("s announcement-period abnormal retum) x (mean market value of firms' equity in rival portfolio /).
Chen, Ho, & Shih • Intra-Industry Effects of Corporate Capital Investment Announcements 137
Table IV. Rivals' Abnormal Returns over the Two-Day Announcement-Period for Each Industry in the Sample
The sample includes all capital investment announcements made between 1989 and 1998 for firms for which a primary four-digit SIC code is available from the Compustat data file (250 capital investment announcements). For each announcing firm, we form a value-weighted portfolio of rivals with the same four-digit SIC code for which retums are available from the CRSP files. For each industry, the mean abnormal retum is the average of the rival portfolio market model residual computed for each capital investment over the two-day (-1, 0) announcement period. We compute z-statistics for each industry by using the standardized rival portfolio abnonnal retum for each capital investment.
Industry Average Number of
Firms in the Rival Portfolio
Mean Abnormal Return (%)
z-statistic
Gold and Silver Ores (1040)
Crude Petroleum and Natural Gs (1311) Oil and Gas Field Services, NEC (1389) Bakery Products (2050)
Beverages (2080)
Textile Mill Products (2200) Knitting Mills (2250) Carpets and Rugs (2273)
Apparel and Other Finished Pds (2300) Lumber and Wood Pds, Ex Fum (2400) Paper and Allied Products (2600) Paper Mills (2621)
Paperboard Mills (2631)
Paperboard Containers, Boxes (2650) Newspaper: Pubg, Pubg and Print (2711) Indl Inorganic Chemicals (2810) Plastc, Synth Matls, Ex Glass (2820) Plastics, Resins, Elastomers (2821) Pharmaceutical Preparations (2834) Soap, Detergent, Toilet Preps (2840) Industrial Organic Chemicals (2860) Petroleum Refining (2911)
Tires and Inner Tubes (3011)
Glass, Glasswr-Pressed, Blown (3220) Cement, Hydraulic (3241)
Steel Works and Blast Fumaces (3312) Prim Smelt, Refin Nonfer Metl (3330) Prim Production of Aluminum (3334) Metal Cans (3411)
Metal Forgings and Stampings (3460) Ball and Roller Bearings (3562) Computer and Office Equipment (3570) Electronic Computers (3571)
Computer Storage Devices (3572) OfTice Machines, NEC (3579) Household Appliances (3630)
Radio, TV Broadcast, Comm Eq (3663) Semiconductor, Related Device (3674) Electronic Components, NEC (3679)
56 188 11 9 6 11 5 5 18 8 2 22 10 10 18 21 5 20 166 8 15 37 3 4 5 44 8 3 6 11 7 3 33 28 9 5 85 107 37 -1.27 0.03 -0.76 -2.27 -0.48 -0.03 0.75 -1.07 -0.76 -0.01 -0.53 0.21 -2.33** -1.04 0.39 -0.65 0.78 -3.01** 0.64 1.56 0.19 0.09 -2.00*** -1.88 1.04 -0.07 0.29 -2.44** 0.01 -0.11 -2.07* -1.01 0.18 0.42 2.50 -1.38 -0.19 -0.30 -0.45 -0.48 0.25 -0.87 -0.99 -0.77 -0.02 0.29 -0.73 -0.50 -0.16 -0.36 1.16 -2.39 -0.71 0.70 -1.19 0.34 -2.32 0.80 1.08 0.52 0.42 -2.81 -0.78 0.81 -0.15 0.16 -2.39 0.14 -0.09 -1.90 -0.95 0.22 0.22 1.41 -0.99 -0.34 -0.36 -0.33
138 Financial Management» Summer 2007 Table IV. Rivals'Abnormal Returns over the Two-Day Announcement-Period
for Each Industry in the Sample {Continued)
Industry Average Number of
Firms in the Rival Portfolio
Mean Abnormal Return (%)
z-statistic
Motor Vehicles and Car Bodies (3711) Motor Vehicle Part, Accessory (3714) Srch, Det, Nav, Guid, Aero Sys (3812) Lab Analytical Instruments (3826) Surgical, Med Instr, Apparatus (3841) Photographic Equip and Supply (3861) Railroads, Line-Haul Operatng (4011) Air Transport, Scheduled (4512) Radiotelephone Communication (4812) Phone Comm Ex Radiotelephone (4813) Natural Gas Transmission (4922) Natural Gas Transmis and Distr (4923) Electric and Other Serv Comb (4931) Refuse Systems (4953)
Paper and Paper Products-Whsl (5110) Petroleum, Ex Bulk Statn-Whsl (5172) Department Stores (5311)
Variety Stores (5331) Grocery Stores (5411)
Women's Clothing Stores (5621) Drug and Proprietary Stores (5912) Hotels and Motels (7011)
Prepackaged Software (7372)
Auto Rent and Lease, No Drivers (7510) Motion Pic, Videotape Prodtn (7812) Motion Picture Theaters (7830)
Mise Amusement and Rec Service (7990)
20 51 19 31 71 25 16 34 45 93 12 15 43 18 11 12 16 26 34 18 13 34 339 7 29 11 66 -1.00*** 0.32 -0.55 -0.39 0.93 0.61 -0.01 -0.62 -0.61 -0.27 0.06 -0.46** 0.46 -1.18 1.08 0.11 0.07 0.04 0.31 -0.05 -2.56** 0.04 -0.27 -0.03 -0.86 -0.85 0.26 -2.61 0.54 -0.56 -0.46 0.98 0.53 -0.05 -0.43 -0.50 -1.10 -0.03 -2.03 1.39 -0.89 0.53 0.08 0.22 0.46 0.64 -0.03 -2.29 0.04 -0.18 -0.01 -0.94 -0.50 0.21
*** Significant at the 0.01 level. ** Significant at the 0.05 level. * Significant at the 0.10 level.
rivals' characteristics. Panel A shows the results partitiotied according to whether the announcer's characteristics are above or below their sample medians. We find that the valuation impact of capital investment announcements on industry rivals is -0.47% and is statistically significant at the 1% level when the announcing firm experiences a high abnormal return. In contrast, the rivals experience an insignificant abnormal retum of-0.09% when the announcer has a low stock price response. Furthermore, the mean difference between the abnormal retums for these two groups of rivals is -0.38% and is statistically significant at the 5% level. Our results suggest that industry rivals' share prices are more adversely affected when the valuation effect on the announcing firm is more favorable.
Panel A also shows that for the announcing firm with a high market share, industry rivals experience a significantly negative announcement-period abnormal retum, whereas for the announcing firm with a low market share, the rivals experience an insignificant abnonnal retum. However, the difference between the abnonnal retums of these two subsamples is not statistically significant at the conventional levels. Therefore, there is not strong support for the hypothesis
Chen, Ho, & Shih • Intra-industry Effects of Corporate Capital Investment Announcements 139 Table V. Announcement-Period Abnormal Returns for Subsampies of Industry
Rival Portfolios Grouped by Various Characteristics
Our sample includes 250 announcements of corporate capital investments between 1989 and 1998. For each announcing firm, we form a value-weighted portfolio of rivals with the same Compustat four-digit SIC code^ for which retums are available from the CRSP files. We measure the announcer's abnormal retum over the interval beginning one day before the capital investment announcement and ending on the day of the capital investment announcement. The announcer's entry timing dummy is equal to one if the announcing firm is the first mover, and zero otherwise. We identify 124 announcements that involve first movers. The an-nouncer's market share and growth opportunities, the industry characteristics, and the rivals' characteristics are defined in Table II. The z-statistics are in parentheses.
Characteristics Announcer's Abnormal Retum Announcer's Market Share Announcer's Growth Opportunities Announcer's Entry Timing Retums Correlation Herfindahl Index
Relative Size of the Rivals
Rivals' Investment Opportunities Rivals' Free Cash Flow Rivals' Financial Leverage Rivals' R&D Intensity *•* Significant at the 0.01 ** Significant at the 0.05 * Significant at the 0.10 # of Industry Rival Portfolios with Characteristics Jbove/below the Sample Median Panel A.. 126/124 125/125 126/124 124/126 Panel t 125/125 126/124 Mean Abnormal Subsample of
Returns for the Industry Rival Portfolios with the Value of Characteristics iabove/below the
Sample Median (%) Above Below Announcer's Characteristics -0.47*** (-3.42) -0.35* (-1.89) -0.37*** (-2.78) -0.48*** (-3.45) -0.09 (-0.19) -0.21 (-1.11) -0.19 (-0.84) -0.08 (-0.72) ?. Industry Characteristics -0.22 (-1.05) -0.41*** (-2.73) -0.34* (-1.72) -0.16 (-0.89)
Panel C. Rivals' Characteristics
126/124 126/124 125/125 125/124 110/109 level. level. level. -0.32* (-1.76) -0.18 (-1.00) -0.16 (-0.70) -0.37*** (-2.57) -0.22 (-1.16) -0.24 (-1.22) -0.39*** -(2.63) -0.40*** (-2.92) -0.20 (-1.06) -0.34* (-1.75) Mean Difference (%) -0.38** (-2.47) -0.14 (-0.83) -0.18* (-1.93) -0.40*** (-2.79) 0.12 (0.85) -0.25* (-1.88) -0.08 (-0.82) 0.21* (1.82) 0.24* (1.86) -0.17* (-1.75) 0.12 (0.88)
140 Financial Management • Summer 2007 that the intra-industry impact of capital investment announcements is more pronounced when the investing firm is relatively dominant within the industry.
Panel A shows that the valuation impact of capital investment announcements on industry rivals is negative and statistically significant at the 1% level when the announcing firm has high ^growth opportunities or when it is a first mover.' On the other hand, the impact on rivals is not significantly different from zero when the announcing firm has low growth opportunities or when it is a follower. Our results support the theoretical predictions that rivals' share prices are more adversely affected when the announcing firm has higher growth opportunities or is the first to make investments in the industry.
In Panel B, we report the results partitioned by whether the industry characteristics are above or below the sample medians. We find that industry rivals characterized by a low degree of relatedness to the announcer experience a significantly negative abnonnal retum of-0.34%, and those characterized by a high degree of relatedness experience an insignificant abnonnal return of-0.22%. However, the abnonnal retums for these two groups of rivals are not significantly different at the conventional levels. Therefore, there is not strong support for the hypothesis that the intra-industry effects of capital investment announcements depend on the announcing firm's degree of relatedness to the industry. Our results are in contrast to Lang and Stulz (1992), who find that contagion effects are significantly larger for industries in which the announcer's performance is closely related to its competitors.
Panel B also shows that the abnormal retum for the high Herfindahl index subsample is negative and statistically significant at the 1% level. However, for the low Herfindahl index subsample, the abnonnal retum is not significantly different from zero. Furthermore, the mean difference between the abnormal retums for these two subsamples is statistically significant at the 10% level. Our results are consistent with Lang and Stulz (1992), who find that competitive effects are more important in industries with a higher degree of concentration.
In Panel C, we report evidence on the abnormal retums partitioned by whether rivals' characteristics are above or below the sample medians. We find that the average abnormal retums are significantly lower for rivals with poorer investment opportunities, lower free cash flow, or higher financial leverage. Our results suggest that negative competitive effects are greater for industry rivals with relatively low growth options, consistent with Laux et al. (1998). Our findings also suggest that rivals with limited internal funds or high debt over-hang experience more negative competitive effects associated with capital investment an-nouncements. In contrast, the abnormal returns for industry rivals that are small or have low R&D intensity are not significantly different from those that are large or have high R&D inten-sity. Therefore, our findings do not provide support for the theoretical predictions that the intra-industry effects of capital investment announcements depend on the rival firms' size and R&D intensity.
C. Cross-Sectional Regression Analysis
Although the univariate results in Table V support the notion that corporate capital investment announcements have significant intra-industry effects infiuenced by various characteristics, the tests do not capture the possible interaction among the characteristics we examine. A multivariate analysis incorporates the interaction between these variables and captures the overall effect of the distinguishable characteristics that affect the intra-industry effects of capital investment
Chen, Ho, & Shih • Intra-industry Effects of Corporate Capital Investment Announcements 141 announcements. To further examine the effect of these factors, we estimate a multivariate cross-sectional regression ofthe announcement-period abnonnal retums ofthe industry rival portfolios. We present the results of the regression in Table VI, including all of the potential explanatory variables. We compute /-values with heteroskedasticity-consistent standard errors if tests reject homoskedasticity at the 10% significance level (White, 1980).*
Model 1 includes the announcing firm's characteristics, industry characteristics, and rival firms' characteristics as the explanatory variables. It shows that industry rivals' share price responses are significantly negatively related to the announcement effect on those firms that make capital investments. The finding is consistent with our earlier result that for the sample as a whole, the competitive effect dominates the contagion effect. The result shows that the negative competitive effect on industry rivals is greater when the announcement effect on the capital investment firm is more favorable. This evidence supports the notion that the intra-industry effects of capital investment announcements are more pronounced when the share price ofthe announcing firm is affected to a greater degree.
Model 1 also shows that industry rivals' share price responses are significantly negatively related to the announcing firm's entry timing. That is, industry rivals are more adversely affected by the first-movers' announcements than by the followers' announcements. This finding, which is consistent with that in Table V, suggests that the adverse effect on the rivals at the time of capital investment announcements by first movers is greater than that at the time of imitation by followers, because the announcing firms have more monopolistic advantages in the former case than in the latter.
We also find in Model 1 that industry rivals' share price responses are significantly positively related to their investment opportunities and are significantly negatively related to their financial leverage. This finding is consistent with the results in Table V. Rival firms with better investment opportunities or lower financial leverage are likely to have more worthwhile investments and are better prepared to respond effectively to competitive challenges in the industry than are those with poorer investment opportunities or higher financial leverage. Therefore, the valuation impact of capital investment announcements on rivals is less favorable for those with lower growth options or higher debt overhang.
Model 1 shows that industry rivals' share price responses are not significantly affected by: 1) the announcing firm's market share and growth opportunities, 2) the industry characteristics, and 3) the rivals' relative size, free cash flow, and R&D intensity. The results suggest that these factors are relatively unimportant in assessing the valuation effects of capital investment announcements on industry rivals.
In Model 2, we add a utility dummy to Model 1 that is equal to one if announcements are made by public utility firms (with SIC codes of 4922, 4923, 4931, and 4953), and zero otherwise. McConnell and Muscarella (1985) examine the valuation impact of capital expenditure announcements for industrial and public utility firms and find a differential impact on the announcing firms. Since the intra-industry effects depend on the magnitude of the announcing firm's signal, we also include the utility dummy as a potentially infiuential variable. The results are similar to those when we exclude the utility dummy. The announcers' announcement-period abnormal returns and entry timing, as well as the rivals' investment opportunities and financial leverage, have a significant impact on rivals' share price responses, but the utility dummy does not.
"The number of observations in Table VI is smaller than that in Table I because of missing data on some ofthe explanatory variables.
142 Financiai Management • Summer 2007 Table VI. Cross-Sectional Regression Analysis of Factors Affecting
Announcement-Period Abnormal Returns of Rivals in Response to Capital Investment Announcements
The dependent variable is the two-day announcement-period abnormal retums of industry rival portfolios. We measure the announcer's abnormal return over the interval beginning one day before the capital investment announcement and ending on the day of the capital investment announcement. The announcer's entry timing dummy is equal to one if the announcing firm is the first mover, and zero otherwise. The announcer's market share and growth opportunities, the industry characteristics, and the rivals' characteristics are defined in Table II. The utility dummy is equal to one if announcements are made by public utility firms (with SIC codes of 4922,4923,4931, and 4953), and zero otherwise. We compute r-values, which appear in parentheses, with heteroskedasticity-consistent standard errors if tests reject homoskedasticity at the 10% significance level (White, 1980). The number of observations in Table VI is smaller than that in Table I because of missing data on some of the explanatory variables.
Variable Model
(1) (2)
Intercept
Announcer's Characteristics Announcer's Abnormal Retum
Announcer's Market Share
Announcer's Growth Opportunities
Announcer's Entry Timing
Industry Characteristics Retums Correlation
Herfindahl Index
Rivals' Characteristics Relative Size of the Rivals
Rivals' Investment Opportunities
Rivals' Free Cash Flow
Rivals' Financial Leverage
Rivals' R&D Intensity
Utility Dummy N Adjusted R^ F-value -0.0040 (-0.84) -0.0751** (-2.05) -0.0071 (-1.07) 0.0005 (0.32) -0.0034** (-1.99) 0.0010 (0.19) -0.0002 (-0.03) 0.0015 (0.37) 0.0025** (2.20) 0.0153 (0.80) -0.0035** (-2.32) 0.0010 (0.19) 219 0.0942 3.06*** -0.0039 (-0.83) -0.0718** (-1.98) -0.0072 (-1.08) 0.0006 (0.64) -0.0033** (-1.98) 0.0017 (0.46) -0.0003 (-0.04) 0.0017 (0.43) 0.0023** (2.02) 0.0174 (0.89) -0.0035** (-2.34) 0.0010 (0.17) 0.0043 (0.68) 219 0.0919 2.84*** **• Significant at the 0.01 level.
** Significant at the 0.05 level. * Significant at the 0.10 level.
Chen, Ho, & Shih • Intra-Industry Effects of Corporate Capital Investment Announcements 143
IV. Conclusion
In this study, we examine the effects of firms' announcements of capital investments on their industry rivals' stock prices. The competitive effect predicts that industry rivals should experience a negative valuation effect, whereas the contagion effect predicts that they should experience a positive valuation effect. We show that rival firms overall experience a significantly negative share price response. This evidence suggests that for our sample as a whole, the competitive effect dominates the contagion effect.
We also relate rivals' share price responses to a number of potentially important explanatory factors: the announcing firm's characteristics, industry characteristics, and rival firms' characteristics. We examine the abnormal retums for subsamples of industry rival portfolios grouped by these characteristics. We find that rivals' share prices are more adversely affected when: 1) the announcing firm experiences a higher abnormal retum, has higher growth opportunities, or is a first mover in the industry, 2) the industry is less competitive, or 3) the rivals have poorer investment opportunities, lower fi-ee cash fiow, or higher financial leverage. However, when we estimate a multivariate cross-sectional regression ofthe announcement-period abnormal retums ofthe industry rival portfolios, we find that only four factors are statistically significant in explaining the abnormal retums: the announcer's share price response and entry timing, and the rivals' investment opportunities and financial leverage. Industry rivals' share price responses are significantly negatively related to the announcer's announcement effect and entry timing as well as the rivals' financial leverage, and are significantly positively related to the rivals' growth opportunities. Our results suggest that these four factors are relatively important in explaining the heterogeneous intra-industry effects of corporate capital investment announcements. •
References
Akhigbe, A., J. Madura, and A.M. Whyte, 1997, "Intra-Industry EfFects of Bond Rating Adjustments,"
Journal of Financial Research 20, 545-561.
Akhigbe, A. and A.D. Martin, 2000, "Information-Signaling and Competitive Effects of Foreign Acquisitions in the US," Journal of Banking and Finance 24, 1307-1321.
Baginski, S.P., 1987, "Intraindustry Information Transfers Associated with Management Forecasts of Eamings," Journal of Accounting Research 25,196-219.
Bernardo, A.E. and B. Chowdhry, 2002, "Resources, Real Options, and Corporate Strategy," Journal of
Financial Economics 63, 211-234.
Bolton, P. and D.S. Scharfstein, 1990, "A Theory of Predation Based on Agency Problems in Financial Contracting," American Economic Review 80, 93-106.
Chan, S.H., G.W. Gau, and K. Wang, 1995, "Stock Market Reaction to Capital Investment Decisions: Evidence from Business Relocations," Journal of Financial and Quantitative Analysis 30, 81 -100. Chan, S.H., J.D. Martin, and J. Kensinger, 1990, "Corporate Research and Development Expenditures and
Share Value," Journal of Financial Economics 26, 255-276.
Chen, S.S. and K.W. Ho, 1997, "Market Response to Product-Strategy and Capital-Expenditure Announcements in Singapore: Investment Opportunities and Free Cash Flow," Financial Management 26, 82-88.
Chung, K.H., P. Wright, and C. Charoenwong, 1998, "Investment Opportunities and Market Reaction to Capital Expenditure Decisions," Journal of Banking and Finance 22, 41-60.
144 Financial Management • Summer 2007
Dodd, P. and J.B. Wamer, 1983, "On Corporate Govemance: A Study of Proxy Contexts," Journal of
Financial Economics 11, 401-438.
Eckbo, B.E., 1983, "Horizontal Mergers, Collusion, and Stockholder Wealth," Journal of Financial
Economics 11, 241-273.
Erwiti, G.R. and J.M. Miller, 1998, "The Intra-industry Effects of Open Market Share Repurchases: Contagion or Competitive?" Journal of Financial Research 21, 389-406.
Fazzari, S.M., R.G. Hubbard, and B.C. Petersen, 1988, "Finance Constraints and Corporate Investment,"
Brookings Papers on Economic Activity 1, 141-195.
Firth, M., 1996, "Dividend Changes, Abnormal Retums, and Intra-industry Firm Valuations," Journal of
Financial and Quantitative Analysis 31, 189-211.
Foster, G., 1981, "Intra-industry Information Transfers Associated with Earnings Releases," Journal of
Accounting and Economics 3, 201-232.
Guenther, D.A. and A.J. Rosman, 1994, "Difference Between Compustat and CRSP SIC Codes and Related Effects on Research," Journal of Accounting and Economics 18, 115-128.
Hendricks, K.B. and V.R. Singhal, 1997, "Delays in New Product Introductions and the Market Value ofthe Firm: The Consequences of Being Late to the Market," Management Science 43, 422-436.
Hertzel, M.G., 1991, "The Effects of Stock Repurchases on Rival Firms" Journal of Finance 46, 707-716.
Hoshi, T., A. Kashyap, and D. Scharfstein, 1991, "Corporate Structure, Liquidity, and Investment: Evidence from Japanese Panel Data," Quarterly Journal of Economics 106, 33-60.
Jensen, M., 1986, "Agency Costs of Free Cash Flow, Corporate Finance, and Takeovers," American
Economic Review 76, 323-329.
Jovanovic, B. and G.M. MacDonald, 1994, "The Life Cycle of a Competitive Industry," Journal of Political
Economy 102,322-347.
Kahle, K.M. and R.A. Walkling, 1996, "The Impact of Industry Classifications on Financial Research,"
Journal of Financial and Quantitative Analysis 31, 309-335.
Kelm, K.M, V.K. Narayanan, and G.E. Pinches, 1995, "Shareholder Value Creation during R&D Innovation and Commercialization Stages," Academy of Management Journal 38, 770-786.
Kovenock, D. and G.M. Phillips, 1997, "Capital Structure and Product Market Behaviour: An Examination of Plan Exit and Investment Decisions," Review of Financial Studies 10, 767-803.
Lang, L.H.P., E. Ofek, and R.M. Stulz, 1996, "Leverage, Investment, and Firm Growth," Journal of
Financial Economics 40, 3-29.
Lang, L.H.P. and R.M. Stulz, 1992, "Contagion and Competitive Intra-industry Effects of Bankruptcy Announcements," Journal of Financial Economics 32, 45-60.
Lang, L.H.P., R.M. Stulz, and R.A. Walkling, 1989, "Managerial Performance, Tobin's Q, and the Gains from Successful Takeovers," Journal of Financial Economics 24, 315-335.
Lang, L.H.P., R.M. Stulz, and R.A. Walkling, 1991, "A Test ofthe Free Cash Flow Hypothesis: The Case of Bidder Retums," Journal of Financial Economics 29, 315-335.
Laux, P., L.T. Starks, and P.S. Yoon, 1998, "The Relative Importance of Competition and Contagion in intra-lndustry Information Transfers: An Investigation of Dividend Announcements," Financial
Management 27, 5-16.
Lee, H., 1995, "Shareholder Wealth Effects of New Product Rivalry: First Movers, Second Movers, and Laggards," University of Maryland, Ph.D. Thesis.
Chen, Ho, & Shih • Intra-industry Effects of Corporate Capital Investment Announcements 145
Mauri, A.J. and M.P. Michaels, 1998, "Firm and Industry Effects within Strategic Management: An Empirical Examination," Strategic Management Journal 19, 211-219.
McConnell, J.J. and C.J. Muscarella, 1985, "Corporate Capital Expenditure Decisions and the Market Value of the Firm," Journal of Financial Economics 14, 399-422.
Myers, S.C, 1977, "Determinants of Corporate Borrov/'mg," Journal of Financial Economics 5, 147-175. Phillips, G.M., 1995, "Increased Debt and Industry Product Markets: An Empirical Analysis," Journal of
Financial Economics 37, 189-238.
Porter, M.E., 1980, Competitive Strategy, New York, NY, Free Press.
Scherer, F.M. and D. Ross, 1990, Industrial Market Structure and Economic Performance, Boston, MA, Houghton MifPlin.
Slovin, M.B., M.E. Sushka, and Y.M. Bendeck, 1991, "The Intra-industry Effects of Going-Private Transactions," Journal of Finance 46, 1537-1550.
Stulz, R.M., 1990, "Managerial Discretion and Financing Policies," Journal of Financial Economics 26, 3-27.
Szewczyk, S.M., 1992, "The Intra-industry Transfer of Information Inferred from Announcements of Corporate Security Offerings," Jowrna/o/Fwa«ce 47, 1935-1945.
Vogt, S.C, 1997, "Cash Flow and Capital Spending: Evidence from Capital Expenditure Announcements,"
Financial Management 26, 44-57.
White, H., 1980, "A Heteroskedasticity-Consistent Covariance Matrix Estimator and a Direct Test for Heteroskedasticity," Econometrica 48, 817-838.
Woolridge, J.R. and C C Snow, 1990, "Stock Market Reaction to Strategic Investment Decisions," Strategic