Research Topic
以診斷學習困難為考量之測驗與評
量系統
Reporter: 朱蕙君 Professor: 黃國禎教授 Report day: 2006,11,152
Relevant Research
Gwo-Jen Hwang (2003), “A conceptual map for
developing intelligent tutoring systems”, Computers &
Education, Vol. 40, No.3, pp. 217-235. (SSCI)
Gwo-Jen Hwang, Jia-Lin Hsiao and Judy C.R. Tseng
(2003), “A Computer-Assisted Approach for Diagnosing Student Learning Problems in Science Courses”, Journal
of Information Science and Engineering, Vol. 19, No.2,
pp. 229-248. (SCI Expanded, EI)
Gwo-Jen Hwang (2005), “A Data Mining Approach to Diagnosis Student Learning Problems in Science
Courses”, Journal of Distance Education Technologies, Vol. 3, No. 4, pp.35-50. (EI)
3
A conceptual map for developing
intelligent tutoring systems (2003)
Conventional testing systems simply give students
a score, but don’t give them the opportunity to
learn how to improve their learning performance.
Students would benefit more if the test results
could be analyzed and hence advice could be
provided accordingly.
This study proposes a conceptual map model,
which provides learning suggestions by analyzing
the subject materials and test results.
4
Concept Effect Relationships (CER)
McAleese (1994, 1998) indicated that students
learn new concepts and new relationships among
previously learned concepts.
Salisbury (1998)that indicate the effect of learning
one concept on the learning of other concepts.
ex: The names and abbreviations of chemical
elements and their atomic weights must be
thoroughly learned to comprehend scientific
writings or chemical formulae.
Such conceptual relation has been defined as
5
Conventional subject materials
Structure
Subject materials was viewed as a tree diagram comprising chapters, sections, sub-sections and key concepts to be learned.
6
New Structure: Concept effect
Relationships
conceptual map
previously learned concepts Hi-level concepts
Next, how to get the “Concept effect graphs” ?
7
Concept effect table (CET)
Two-dimensional table.
If CET(Ci,Cj)=1, it is said that ‘‘Ci is one of the
prerequisites of Cj’’.
“Division” 的 prerequisites concepts (NP)=2
Positive integers
Subtraction Multiplication
8 Qi Cj C1 C2 C3 C4 C5 C6 C7 C8 C9 C10 Q1 Q2 Q3 Q4 Q5 Q6 Q7 Q8 Q9 Q10 SUM ERROR ER(Cj) 5 0 0 0 0 1 0 0 0 0 6 1 0.16 =1/6 1 4 0 0 0 0 0 0 0 0 5 0 0 =0/5 0 2 3 0 0 0 0 0 0 0 5 3 0.6 =3/5 0 0 1 5 0 0 0 0 0 0 6 1 0.16 =1/6 0 0 2 0 5 0 0 0 0 0 7 2 0.28 =2/7 0 0 0 0 0 4 0 0 0 2 6 4 0.66 =4/6 0 0 0 0 0 0 5 0 0 0 6 4 0.63 =5/8 0 0 2 0 0 2 0 0 0 1 5 4 0.8 =4/5 0 0 0 0 0 0 0 1 4 0 5 4 0.8 =4/5 0 0 0 0 0 0 0 0 5 0 5 5 1.0 =5/5 ER(C1) ER(C2) ER(C3)
Illustrative example of a
test item relationship table (TIRT)
test item relationship table (TIRT)
wrong
wrong wrong
wrong
TIRT(Qi, Cj): ranging from 0~5, 0:no relationships
SUN(Cj): total strange of Cj (Cj)
ERROR(Cj) SUM(Cj)
θ-9
Concept effect graph
C1 C9 C8 C7 C6 C2 C4 C5 C3 C10
θ= The acceptable error rate
ER(Cj)<θ: have learned Cj
ER(Cj)>θ: Add in “To-Be-Enhanced
learning path”
Θ: average error ratio of Cj for the students who get the bottom 50% of test scores.
10 PATH 3: Addition Multiplication Division Prime numbers Weight=Max(ER(C3), ER(C7), ER(C9), ER(C10))=1.0 PATH 1:
Addition SubtractionNegative integers Weight=Max(ER(C3), ER(C6), ER(C8))=0.8
PATH 2:
Addition Subtraction Division Prime numbers
Weight=Max(ER(C3), ER(C6), ER(C9), ER(C10))=1.0 C1 C9 C8 C7 C6 C2 C4 C5 C3 C10
11
Fuzzy output for learning guidance
Fuzzy sets on ER(Cj)
ER(Cj) 0 0.5 1.0 Well- Learned Very well- Learned More or less well-Learned poorly-Learned Very poorly- Learned More or less poorly-Learned 1.0 0.5 0 0.3 0.55 0.2 ER(C1)=0.16 ER(C1)=0.16 Very well-learned0.3 Well-learned0.55
12
Illustrative example of a learning
guidance (To Student)
Concept Learning status of the concept
C1 Zero You have learned the concept well.
C2 Positive integers You have learned the concept very well.
C3 Addition It seems that you more or less misunderstood this concept.
C4 Odd You have learned the concept well.
C5 Even You have learned the concept well.
C6 Subtraction. It seems that you misunderstood this concept
C7 Multiplication It seems that you more or less misunderstood this concept. C8 Negative integers It seems that you seriously misunderstood this concept. C9 Division It seems that you seriously misunderstood this concept. C10 Prime numbers It seems that you seriously misunderstood this concept.
misunderstood concepts “Addition”, ‘‘Subtraction’’, ‘‘Negative integers’’, ‘‘Division’’, ‘‘Multiplication’’ and ‘‘Prime numbers’’,
13
Comments for the student
Comments for the student:1. According to the diagnosis from the system, we found that you have
misunderstood concepts ‘‘Subtraction’’, ‘‘Negative integers’’, ‘‘Division’’, ‘‘Multiplication’’ and ‘‘Prime numbers’’, which perhaps results from the
misunderstanding of ‘‘Addition’’. In other words, the major learning problem of yours is the misunderstanding of concept ‘‘Addition’’, which affects the learning of other concepts.
2. Suggestion: enhance the study in
‘‘Addition Subtraction Division Prime numbers’’
and
‘‘Addition Multiplication Division Prime numbers’’ sequences.
PATH 2
14
15
Intelligent testing and diagnostic
system (ITES)
Windows NT platform. CLIPS format. (a
well-known expert system shell developed by NASA
(Giarratano & Riley, 1989)) ITES comprises:
student profile database item bank
Java-based interface
testing and diagnostic unit fuzzy interface.
WWW and Java-Based User Interface
Fuzzy Interface Expert System Inference Engine Teachers Students WWW Browsers Knowledge Base Item Bank Student Profile Testing and Diagnostic Unit System Log
16
Experiment
Experiment period: 2001.9.~2001.12. (3 months)
Material: An elementary school’s natural science course. Conditions:
The same teacher
Sixty K-6 students from two classes
Group-A (Control group): 30 students,
received regular on-line tutoring
testing without learning guidance
Group-B (Experimental group) : 30 students
received regular on-line tutoring
17
Pre-test
樣本變異數同質性 t 檢定 t-test α=0.05, tα(29)=1.699 Group-A Group-B Group diff.(1-2)Grade Pooled Equal 58 2.32 Grade Satterthwaite Unequal 56.7 2.32 Variable Method Variances df t Value
Equality of variances
Grade Folded F 29 29 1.36 < 0.4079
Group A > Group B: performance
of Groups A and B in the pre-test differs significantly.
Variable Method Num df Den df F value Pr > F
| t |= 2.32 > t (α=.05) = 1.699 the performance of Groups A and B in the pre-test differs significantly
18
Post-test
t-test α=0.05, tα(29)=1.699 Group-A Group-B Group diff.(1-2)GRADE Pooled Equal 58 -2.47 GRADE Satterthwaite Unequal 56.7 -2.47 Variable Method Variances df t Value
Equality of variances
Grade Folded F 29 29 1.95 > 0.0782 Variable Method Num df Den df F value Pr > F
Group B > Group A: performance
of Groups A and B in the post-test differs significantly.
| t |= 2.47 > t (α=.05) = 1.699
a significant difference between
19
A graphical user interface is provided for
constructing the conceptual effect graph
20
A Computer-Assisted Approach for Diagnosing Student Learning Problems in Science Courses (2003, SCI
Expanded, EI)
Unfamiliar with computer programming, time-consuming, friendly user interface for teachers to apply it unaided.
CER Generator: Generating concept effect relationships based on
21
CER-builder- Define support/belief
values to generate a set of CER
22
The generated CER can be edited by
the teacher
23
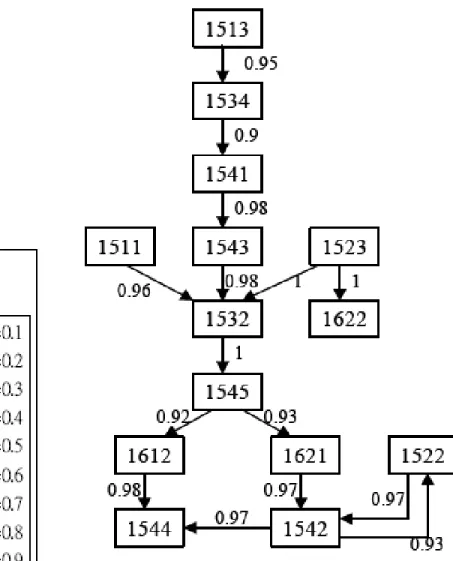
Physics course
The final concept effect graph with support = 0.2 and belief = 0.9.
24
Evaluation of the Efficacy of the CER
Builder
Experimental period: March 2001 to June 2001.
Material: Natural Science course at an elementary school 60 students
Group A (Control group)(V1): received regular on-line
testing without learning guidance.
Group B (experimental group)(V2): received learning
suggestions and relevant homework after each on-line
test.
Pre-test, post-test: The statistical results obtained by applying SPSS.
25
Post-test & Pre-test
p-value(Sig.2-tailed) = .024 > (α=.01) =>Ho 成立
∴the mean score of
Group A = Group B.
p-value (Sig.2-tailed) =.009 < (α=.01)
=>Ho 不成立
∴the mean score of
26
A Data Mining Approach to Diagnosis Student
Learning Problems in Science Courses
(2005, Journal of Distance Education Technologies)
A data mining approach that is capable of assisting teachers to
provide information needed for
guiding students during the learning process.
Data Mining for Constructing Concept-Effect Relationships. Input Data-Answer Sheet
28
Similar experimental results have
been derived on three courses
29
Evaluation for efficacy of the data
mining approach
30
Conclusion
This study proposes a conceptual map method for
modeling the prerequisite relationships among concepts to be learned.
Several experiments have been conducted, which indicate that the group of students who received the learning
guidance can make significant progress compared with the control group.
Two different approaches have been proposed to assist the teachers in constructing the concept-effect relationships. More experiments on Social Science or Language courses