國立交通大學
電子工程學系 電子研究所碩士班
碩士論文
整合於可攜式腦心監護系統之高能源效率
4 通道獨立成份分析處理器
A Power-Efficient VLSI Design of a 4-Channel Independent Component
Analysis Processor for Portable Brain-Heart Monitoring Systems
研 究 生 : 傅致中
指導教授: 方偉騏 教授
整合於可攜式腦心監護系統之高能源效率
4 通道獨立成份分析處理器
A Power-Efficient VLSI Design of a 4-Channel Independent Component
Analysis Processor for Portable Brain-Heart Monitoring Systems
國立交通大學 電子工程學系
電子研究所碩士班
碩士論文
A Thesis
Submitted to Department of Electronics Engineering & Institute of Electronics College of Electrical and Computer Engineering
National Chiao Tung University In partial Fulfillment of the Requirements
for the Degree of Master of Science
in
Electronics Engineering October 2010
Hsinchu, Taiwan, Republic of China
中華民國九十九年十月
研究生:
傅致中
Student :
Chih-Chung Fu
i
整合於可攜式腦心監護系統之高能源效率
4 通道獨立成份分析處理器
學生:傅致中 指導教授:方偉騏 教授 國立交通大學電子工程學系 電子研究所碩士班 中文摘要 近年來快速增加的老年人口比例已然成為各國必需面臨的重要問題,整合型 健康照護系統已經成為電子領域發展的重點。本論文由三個應用情境包括緊急醫 療需求(如救護車上之緊急量測)、長期觀測與照護(老年退化性疾病)與腦認知科 學的研究為出發點,提出一針對腦電訊號(EEG)、心電訊號(EKG)處理分析與擴 散光學腦部影像重建(DOT)所構成之整合型系統之雛型設計,進以推動針對此三 類系統的可攜性整合型醫療儀器之發展。 由於生理電信號中最微弱的腦電信號通常與肌電信號(EMG)中的眼動信號 與眨眼信號一起混合並量測,以獨立成份分析為方法的人工雜訊濾除技術已發展 許久。但由於獨立成份分析的運算複雜度過高,腦波的應用通常受到離線運算的 嚴重限制。本論文針對所提出整合型系統中的腦電信號處理所使用的四通道即時 獨立成份分析器之設計與實作以一完整章節加以詳述。由於可攜式儀器的基本需 求即為低功率與低成本,多種設計技巧與最佳化規格分析如三重循環記憶體的配 置、鏡像非線性查表單元的設計與 ICA 訓練、成份萃取間的管線排程皆被用來 降低功率消耗與硬體成本。此 ICA 硬體設計已由聯電 90 奈米製程下線並測試。 晶片的核心面積為 0.58 平方毫米。量測數據顯示若使用 80 Hz 的取樣頻率,並 使用 0.5 MHz 的工作頻率與 0.6 V 的核心電壓時,可達到最低 0.312 毫瓦的功率 消耗。 此獨立成份分析模組也與一心率變異率分析器、一擴散光學影像重建模組一ii 同整合於一實驗性腦心監護系統之中。由前端訊號擷取模組所得到的生醫訊號被 傳送至相應的即時運算引擎進行分析處理,處理完的結果與原始訊號皆由一無損 失性生醫信號壓縮模組進行資料壓縮,再以一商業藍牙模組傳至臨近的生醫資訊 工作站進行 3D 顯像與遠端觀察與診斷。此生醫訊號壓縮模組的平均壓縮率可達 2.5,此壓縮率可被視為在無線傳輸上面的功率節省。系統中的資料流順序主要 由一固定優先權資料選擇器與一三級向後資料流控制機制所影響,而這樣的設計 也能提高各模組的輸出緩衝記憶體使用率,如此一來可以造成較少的傳輸緩衝記 憶體使用。獨立成份分析與心率變異率分析引擎皆以真實生理訊號驗證,並顯示 優良的分析結果。而腦影像重建引擎則以一模型來顯示其分析與真實情況的一致 性。 關鍵字:資訊最大化、獨立成份分析、腦波訊號處理、心率變異率分析、擴散式 光學影像重建、整合型生醫系統、藍牙傳輸、可攜式系統、數位信號處 理
iii
A Power-Efficient VLSI Design of a 4-Channel Independent
Component Analysis Processor for Portable Brain-Heart Monitoring
Systems
Student: Chih-Chung Fu
Advisor: Dr. Wai-Chi Fang
Department of Electronics Engineering and Institute of Electronics
National Chiao Tung University
Abstract
Since the twenty-first century, the fast increment of an aged population has become a worldwide problem. Therefore, integrated health-care systems have become an important topic for electrical engineers. In this thesis, focusing on three application scenarios including emergency medical care (e.g. EEG, EKG measurements on ambulance or DOT for fast cerebral hemorrhage check), long-term observation and monitoring (for patients suffer from chronic ailment) and researches on brain and cognitive science, we propose a preliminary design of an integrated health-care system comprising electroencephalogram (EEG) and electrocardiogram (EKG) signal analysis and processing together with diffuse optical tomography for brain imaging. The significance of this system is to enable the practical development of such portable health-care devices for brain heart monitoring.
Since the EEG is the feeblest one of all physiological electrical signals usually contaminated by ocular artifacts (e.g. eye-blink artifact and eye-movement artifact), the artifact removal techniques using independent component analysis (ICA) has been developed for a long time. Because of the compelling computation complexity of ICA
iv
algorithm directly inherits from the possible dependency in each channel, applications that analyze EEG signals are usually heavily restricted by the off-line ICA computation. One complete chapter is used to describe the design and implementation of the 4-channel ICA processor employed in the proposed integrated system as the EEG processing element. Since the two basic requirements for portable instruments are low-power and low-cost, various design techniques and optimized specification analyses like three-bank circular memory allocation, an mirrored non-linear lookup unit and the operation pipelining between the ICA training and component extraction are all adopted to reduce the power consumption and hardware cost. The designed ICA processor is fabricated using UMC 90 nm CMOS technology, and the core area of the chip is 0.58 mm2. Performance measurements done by Agilent 93000 SoC Tester have shown that when using 80 Hz sample rate, 0.5 MHz operation frequency and 0.6 V core power, the lowest power consumption of 0.312 mW is achieved under the worst cast of 512 training iterations.
Together with an HRV and fNIR-DOT processor, the designed ICA processor is integrated in an experimental brain heart monitoring system. EEG, EKG and near-infrared signals acquired from the analog front-end IC are processed in real-time or bypassed according to user configurations. Processed data and raw data are compressed by a lossless biomedical data compressor and sent to a remote science station by a commercial Bluetooth module for further analysis, 3-D visualization and remote diagnosis. The biomedical signal compressor achieves an average compression ratio (CR) of 2.5 which is translated into power saving during wireless transmission. The data flow in the system is mainly controlled by a prioritized data selector and a three-stage backward handshaking mechanism, and the design can increase the utilization of the output buffers inside each processor so that the data transmission
v
buffer can be reduced. The ICA and HRV processor are verified by real EEG and EKG signals while the DOT processor is verified by an experimental model.
Keywords: Infomax, Independent Component Analysis, EEG processing, Heart Rate
Variability, Diffuse Optical Tomography, Integrated Health-Care System, Bluetooth Data Transmission, Portable System, Digital Signal Processing
vi
誌謝
本論文的完成要感謝許多背後支持的力量,首先是兩年以來我的指導老師方 偉騏教授在研究上的關心與指導。謝謝方老師特別從 NASA 回到母校交大來從 事教職。方老師提供了理想的研究環境與豐富的資源,使得研究能夠很快的進入 狀況。除了課業上的支持外,老師也讓我學習到諸多寶貴的經驗如與人相處之道 與團體合作的技巧。另外,要感謝我的口試委員:林進燈教務長與范倫達教授, 他們所提出的建議與指教使得本論文更為完整與充實。而林老師與范老師實驗室 中的學長姊們也給予了非常寶貴的經驗。 研究的過程中,陳秋國博士提供了最直接的支持。無論是生活上的問題或是 學業上的困難,秋國學長都給與非常實在的建議與指導。學長對學弟們的關心使 的實驗室的運作順暢與和諧。感謝實驗室中一起幫忙完成 ICA 設計的同學:秋 國、Ericson、少彥、適揚以及兩位宗翰。有了你們的幫助,晶片的設計、整合、 測試才能夠順利完成。另外,實驗室中的學弟們:康適、世揚、偉業、佳慶、敬 儒、奕仲、瑞傑,在學業的最後階段你們真的提供了非常大的助力。如果之後有 我幫的上忙的地方,我也一定不遺餘力地提供協助。 最後,我的爸爸、媽媽、姊姊、姊夫所給予的支持與關心使我能在研究時沒 有後顧之憂,並且渡過所有難關。特別感謝我的女友軒念,少了妳的陪伴我可能 無法如此順利的達成這艱難的任務。 謹以本論文獻給我的家人及所有關心我的師長、同學與朋友們。vii
Contents
中文摘要 ... i Abstract ... iii 誌謝 ... vi Contents ... vii List of Figures ... ixList of Tables ... xii
Chapter 1 Introduction ... 1
1.1 Three Common Human Health Indicators ... 1
1.1.1 Electroencephalogram... 1
1.1.2 Near-Infrared Spectrogram on Human Tissue ... 4
1.1.3 Electrocardiogram ... 5
1.2 The Need for an Integrated Health-Care Solution ... 8
1.3 Application Scenarios ... 9
1.3.1 Emergency Use ... 10
1.3.2 Long-term Observation and Monitoring ... 10
1.3.3 Research on Brain and Cognitive Science ... 12
1.4 Importance of This Work ... 12
1.5 Organization of the Thesis ... 13
Chapter 2 4-Channel Independent Component Analysis Processor ... 15
2.1 Independent Component Analysis ... 15
2.1.1 Blind Source Separation ... 15
2.1.2 Entropy and Mutual Information ... 17
2.1.3 Infomax ICA ... 19
2.2 Design of the 4-Channel ICA Processor ... 25
2.2.1 Overall Architecture of the ICA Processor ... 26
2.2.2 Stage1 Unit and the Data Windowing Technique ... 28
2.2.3 Whitening Unit... 34
2.2.4 Infomax ICA Training Unit ... 35
2.2.5 ICA Computation Unit ... 41
2.3 Performance Analysis of the 4-Channel ICA Processor ... 42
2.3.1 Performance Analysis Using Super-Gaussian Pattern ... 43
2.3.2 Performance Analysis Using Real EEG Patterns ... 44
2.3.2.1 Pattern 1 – Stable EEG without Artifact ... 45
2.3.2.2 Pattern 2 – Stable EEG without Artifact ... 47 2.3.2.3 Pattern 3 – EEG Contaminated by Eye-Blink Artifact 49
viii
2.3.2.4 Pattern 4 – EEG Contaminated by Eye-Blink Artifact 51
2.3.3 Comparisons with Other Works ... 53
2.4 UMC 90nm 4-Channel ICA Processor Tape-out ... 54
2.4.1 Functional Verification ... 55
2.4.2 Power Consumption Analysis ... 56
2.4.3 A FPGA Based-Testbed ... 59
Chapter 3 Experimental Brain-Heart Monitoring System ... 63
3.1 Overall System Architecture ... 63
3.2 The Interface of the Analog Front-End Circuitry ... 64
3.3 Three Bio-Signal Processors ... 66
3.3.1 4-Channel ICA Processor ... 66
3.3.2 Heart-Rate Variability Analysis Processor ... 68
3.3.3 Near-Infrared Diffuse Optical Tomography Processor ... 71
3.4 System Control Unit ... 73
3.5 Front-End Interface Control Unit... 74
3.6 Three-Stage Backward Handshaking Mechanism ... 78
Chapter 4 Conclusion and Future Works ... 79
4.1 Conclusions ... 79
4.2 Future Works ... 81
ix
List of Figures
Figure 1.1 A typical EKG waveform ... 6
Figure 1.2 Traditional EEG measuring equipment (b) Traditional EEG System enlargement at head part (c) Frequency Domain DOT System (d) Frequency domain DOT system enlargement at head part ... 11
Figure 1.3 Application scenario for the proposed wearable brain monitoring system ... 11
Figure 2.1 Problem definition of the blind source separation (BSS) ... 16
Figure 2.2 The concept of using ICA for speech separation in a cocktail party .... 16
Figure 2.3 Entropy relationship presented by the concept of set ... 18
Figure 2.4 Adaptive learning independent component analysis ... 22
Figure 2.5 Overall architecture of the designed four-channel ICA processor ... 26
Figure 2.6 The architecture of STAGE1 unit ... 28
Figure 2.7 The precise timing plot of the sliding window scheme and pipeline scheduling scheme ... 29
Figure 2.8 Iteration number the training unit takes to achieve conversion in each sliding window ... 31
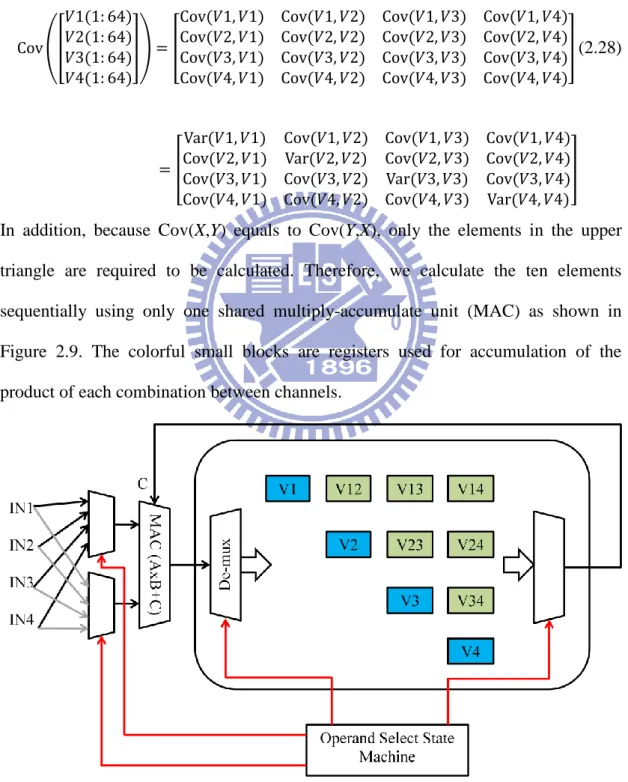
Figure 2.9 Covariance matrix calculation using only one shared MAC operator . 32 Figure 2.10 The architecture of the centering unit (CTR) ... 33
Figure 2.11 The architecture of the whitening unit (WU) ... 34
Figure 2.12 Operation pipelining for singular value decomposition ... 35
In the Figure, “S” represent for the start of calculation while the “F” means the finish of the calculation. Operations marked with different color are using different part of the covariance matrix shown in Figure 2.13. ... 35
Figure 2.13 Operands for pipelined CORDIC operations ... 35
Figure 2.14 State transfer char of the main state machine in ICA training unit (TU) ... 38
Figure 2.15 Hardware architecture of the ICA training unit... 39
Figure 2.16 (a) The original non-linear function g(u) used in Infomax ICA training algorithm (b) 1-2*g(u) ... 40
Figure 2.17 The architecture of the mirrored non-linear lookup unit in TU ... 41
Figure 2.18 Calculation flow char for the final ICA result ... 42
Figure 2.19 (a) 4-channel super-gaussian random sources (b) Probability density functions ... 43
Figure 2.20 (a) Original source signals (b) Mixed signals (c) Extracted ICA signals . ... 44
Figure 2.21 Correlation variation of each 32 outputs compared with EEGLab result ... 44
x
Figure 2.22 Time domain comparison between the off-line result from EEGLab and on-line results for pattern 1 with original source EEG shown in the first
column ... 46
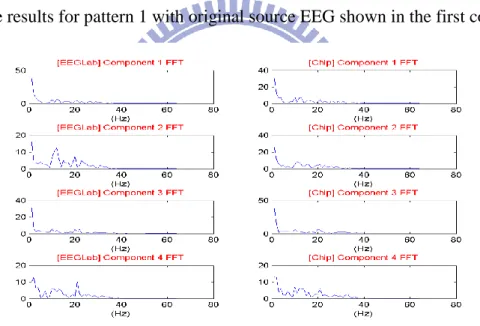
Figure 2.23 Frequency domain comparison between the off-line result from EEGLab and on-line results for pattern 1 ... 46
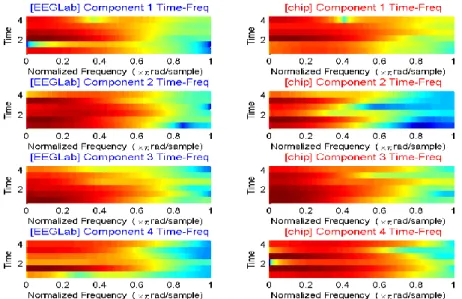
Figure 2.24 Time-frequency analysis comparison between the off-line result from EEGLab and on-line result for pattern 1 ... 47
Figure 2.25 Time domain comparison between the off-line result from EEGLab and on-line results for pattern 2 with original source EEG shown in the first column ... 47
Figure 2.26 Frequency domain comparison between the off-line result from EEGLab and on-line results for pattern 2 ... 48
Figure 2.27 Time-frequency analysis comparison between the off-line result from EEGLab and on-line result for pattern 2 ... 48
Figure 2.28 Time domain comparison between the off-line result from EEGLab and on-line results for pattern 3 with original source EEG shown in the first column ... 49
Figure 2.29 An artifact removal example used to compare the off-line performance using EEGLab and the on-line performance using the designed chip . 50 Figure 2.30 Frequency domain comparison between the off-line result from EEGLab and on-line results for pattern 3 ... 50
Figure 2.31 Time-frequency analysis comparison between the off-line result from EEGLab and on-line result for pattern 3 ... 51
Figure 2.32 Time domain comparison between the off-line result from EEGLab and on-line results for pattern 4 with original source EEG shown in the first column ... 51
Figure 2.33 Frequency domain comparison between the off-line result from EEGLab and on-line results for pattern 4 ... 52
Figure 2.34 Time-frequency analysis comparison between the off-line result from EEGLab and on-line result for pattern 4 ... 52
Figure 2.35 (a) Micrograph of the fabricated 4-channel ICA processor (b) Chip packaged by 68-pin LCC package (c) Bonding map ... 55
Figure 2.36 Chip testing using Agilent 9300 SOC Tester ... 56
Figure 2.37 Shmoo plot showing the boundary of the working condition using core voltage and frequency as its axes ... 57
Figure 2.38 Power minimization ... 58
Figure 2.39 The self-made PCB with the packaged chip soldered on it ... 59
Figure 2.40 Connection between the FPGA board and the PCB ... 59
Figure 2.41 Software controlled data exchange interface between the FPGA and a host computer connected by USB ... 60
xi
Figure 2.43 Waveform example for single cycle write operation ... 61
Figure 2.44 Hardware architecture of the FPGA-based Testbed ... 62
Figure 2.45 Flow char for the experiment for performance analysis using real EEG patterns recorded from the NeuroScan system ... 62
Figure 3.1 Digital signal processing chip architecture for the portable brain-heart monitoring system ... 63
Figure 3.2 Analog-to-digital conversion (ADC) simulation waveform ... 65
Figure 3.3 The top module view of the ICA processor ... 67
Figure 3.4 The IO sequence of the ICA processor ... 67
Figure 3.5 Architecture of the HRV analysis processor ... 68
Figure 3.6 Input and the resulting output from the QRS detection unit ... 69
Figure 3.7 Time-frequency HRV analysis of EKG data from MIT-BIH arrhythmia database using Lomb TFD ... 70
Figure 3.8 Top level module view of the HRV analysis processor ... 70
Figure 3.9 (a) The architecture of the DOT processor (b) Top level module view of the DOT processor ... 71
Figure 3.10 (a) An experimental model for the DOT processor (b) The reconstructed image on the LCD of the development platform ... 72
Figure 3.11 The bendable DOT sensor array board... 錯誤! 尚未定義書籤。 Figure 3.12 The timing chart of IO sequence of the DOT processor ... 72
Figure 3.13 Flow chart of the system initialization ... 73
Figure 3.14 The duration from the system reset is sent to the end of initialization inside the compression module ... 74
Figure 3.15 Interface connection between the front-end interface control unit and the analog front-end integrated chip ... 74
Figure 3.16 The scheme and state machine of FICU ... 75
Figure 3.17 A model of the DOT sensor board ... 76
xii
List of Tables
Table 1.1 Classification of the continuous rhythmic sinusoidal EEG activities .... 2
Table 1.2 Characteristics of the three main types of diffuse optical measurements5 Table 1.3 Different peaks in a typical EKG waveform ... 7
Table 1.4 Different types of peak interval that can be used to evaluate the health of the heart ... 7
Table 2.1 Memory Complexity Reduction ... 30
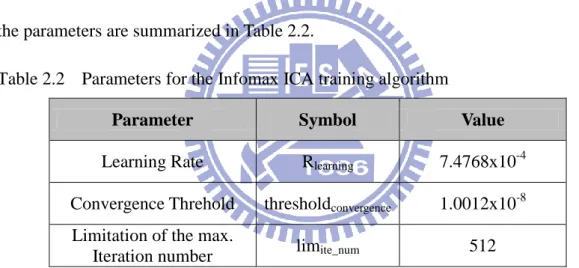
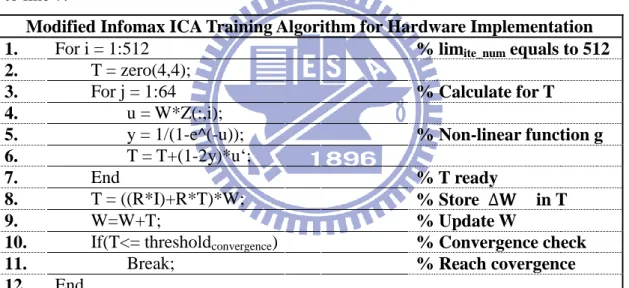
Table 2.2 Parameters for the Infomax ICA training algorithm ... 37
Table 2.3 State, operation and data control in ICA training unit ... 39
Table 2.4 The simulation result of different ROM sizes ... 41
Table 2.5 Detailed pattern information for the 4 EEG patterns recorded ... 45
Table 2.6 Comparisons using complexity and average correlation coefficient.... 53
Table 2.7 Physical information of the 4-channel ICA chip ... 54
Table 2.8 Power consumption table at different working conditions ... 58
Table 2.9 The data exchange functions provided by SMIMS SDK ... 60
Table 2.10 I/O port list for the FPGA interface ... 61
Table 3.1 Specifications of the front-end circuits and working modes for the system ... 64
Table 3.2 System activation command ... 73
Table 3.3 Channel and conversion mapping controlled by ADC_CHSEL, DOT_CHSEL and LED_SEL ... 77
1
Chapter 1 Introduction
Since the twenty-first century, the fast increment of an aged population is emerging as a preeminent worldwide phenomenon. Most of the elderly suffer from chronic ailments and illnesses related to central nervous system (CNS) in their later life. To ease the problems caused by insufficient nursing personnel, many health-care systems focusing on biomedical signal processing and monitoring have been developed. Traditional EEG measuring equipments require the patients to be confined to a small area due to their large size, bringing tremendous inconvenience to them. Therefore, integrated portable health-care systems have become an increasingly important topic.
1.1 Three Common Human Health Indicators
Recent studies have shown that combined analysis of EEG together with heart rate variability or brain fNIR can aid in better diagnosis and treatment. For example EEG and HRV data were jointly analyzed for the automatic detection of seizures in newborns [1] and sleep apnea in hospital patients [2], while the advantage of combined analysis of EEG and fNIR data for cognitive rehabilitation and post traumatic stress syndrome was presented in [3]. Despite these studies indicating the need for joint monitoring of brain fNIR, EEG and HRV, an integrated brain-heart monitoring SoC solution has not been developed.
1.1.1 Electroencephalogram
Human cerebral cortex has a large amount of neurons, and the activities of these neurons have some degree of regularity, so pairs of electrodes on the scalp can be recorded from the cerebral cortex on the next generation of potential changes. The potential changes are composed of the Electrical Rhythms and Transient Discharge. These changes of waveform are called brain potential signal.
2
Electroencephalogram (EEG) is a non-invasive tool for recording of electrical activity along the scalp produced by the firing of neurons within the brain. EEG measurement of different locations, frequency ranges, amplitudes, waveforms and periodicities can be used to distinguish different generation of EEG. The EEG provides important information about the health of the central nervous system (CNS), particularly in the newborn [4]. In medical application of neurology, it is common to use EEG to diagnose such as epileptic, coma, encephalopathy and brain death.
A typical voltage range of EEG signal is about 10 μVolt to 100 μVolt, and the frequency domain is less than 100 Hz. In addition, there are five major bands of continuous rhythmic sinusoidal EEG activity. They are recognized as δ (delta, below 4Hz), θ (theta, 4-8Hz), α (alpha, 8-12Hz), β (beta, 12-30Hz) and γ (gamma, above 30Hz) waves, and their characteristics are listed in Table 1.1. (activities below or above these range is likely to be taken artifactual noise, under standard clinical recording techniques)
Table 1.1 Classification of the continuous rhythmic sinusoidal EEG activities Type Frequency Range (Hz) Common Amplitude Range (V) Description Delta (δ) 0 ~ 4 -
Delta is often associated with the very young and certain encephalopathies and underlying lesions. It is seen in stage 3 and 4 sleep.
Theta (θ) 4 ~ 7 Below 20μ
Theta is associated with drowsiness, childhood, adolescence and young adulthood. This EEG frequency can sometimes be produced by hyperventilation. Theta waves can be seen during hypnagogic states such as trances, hypnosis, deep day dreams, lucid dreaming and light sleep and the preconscious state just upon waking, and just before falling asleep.
3
Alpha (α) 8 ~ 12 20μ ~ 80μ
Alpha is characteristic of a relaxed, alert state of consciousness. For alpha rhythms to arise, usually the eyes need to be closed. Alpha attenuates with drowsiness and open eyes, and typically come from the occipital (visual) cortex. An alpha-like normal variant called mu is sometimes seen over the motor cortex (central scalp) and attenuates with movement, or rather with the intention to move.
Beta (β) 12 ~ 30 Below 20μ
Beta rhythms with low amplitude or multiple and varying frequencies is often associated with active, busy or anxious thinking and active concentration. Rhythmic beta with a dominant set of frequencies is associated with various pathologies and drug effects, especially benzodiazepines.
Gamma
(γ) 30 ~ 100 -
Gamma rhythms may be involved in higher mental activity, including perception, problem solving, fear, and consciousness.
In clinical experiments, EEG signal is displayed based on the location of the electrode that affects the amplitude, phase and frequency. EEG measurements can be divided into monopolar derivation and bipolar derivation. The monopolar derivation uses a probe electrode and a reference electrode fixed on the scalp surface, and it measures the relative value of the probe electrode and reference electrode. The bipolar derivation is induced with two probe electrodes and a reference electrode fixed on the scalp. The potential difference between the two probe electrodes detects EEG signal reflects and acquires relatively small EEG amplitude.
4
EEG system is no longer limited to the interception and analysis of the signals. Today, there are many proposed identification systems and human brain wave techniques for medical diagnosis and treatments. For example, Fuzzy C-means (FCM) algorithm can be used to identify epileptic seizures and cerebral palsy [5]. However EEG signal is very sensitive, and very often may be contaminated by various disturbances like ocular artifact, EMG and electrical noise from nearby instruments [6], and they largely restricts the precision of the identifications and analysis.
Fortunately, this problem can be alleviated by algorithms the independent component analysis (ICA) algorithm [7], which separates artifacts and noise from the measured EEG signals. Wavelet [8] and Spatially-Constrained [9] techniques can be used to identify the artifacts and eliminate them. As a result, we can derive clean EEG signals after the noise channel is eliminated and remixed. However, the computation complexity is so intense that real-time ICA analysis is not feasible for pc-based bio-science station. Therefore, in recent years, the researches on hardware implementation of ICA engines are blooming.
1.1.2 Near-Infrared Spectrogram on Human Tissue
Since DOT (Diffuse Optical Tomography) technology is a kind of non-invasive and real-time radiography, it has been widely used to detect tumors in the breast and imaging the brain in recent years. Many researches are involved in DOT technology and have made rapid progress and development. DOT can be used to detect oxygenated hemoglobin (HbO) and deoxygenated hemoglobin (Hb) concentration and volume with bi-wavelength Near-Infrared. Therefore, in clinical application, the main uses of DOT are monitoring blood flow, blood volume, oxygen saturation, tumors within the brain, and detecting breast cancer [10]. By measuring different characteristics of the diffused near-infrared, DOT can be generally divided into three
5
main categories: the Continuous Wave (CW), Frequency Domain and Time Domain. Table 1.2 Characteristics of the three main types of diffuse optical measurements
Type Advantages Disadvantages Time
Domain (TD)
1. Spatial resolution 2. Penetration depth
3. Most accurate separation of absorption and scattering coefficients
1. High sampling rate
2. Instrument size and weight 3. Stabilization and cooling 4. Cost
Example Uses: Imaging cerebral oxygenation and breast imaging Frequency
Domain (FD)
1. Relatively low sampling rate 2. Relatively accurate separation of absorption and scattering coefficients
1. Penetration depth
2. Instrument size and weight 3. Cost
Example Uses: Cerebral and muscle oximetry, breast imaging Continuous
Wave (CW)
1. Low sampling rate
2. Instrument size, weight and simplicity
3. Low cost
1. Penetration depth
2. Difficult to separate absorption and scattering coefficients
Example Uses: Finger pulse oximeter, functional brain experiments, cerebral hemorrhage
Table 1.2 shows the characteristics of different DOT systems. The CW system provides advantages such as low cost, high portability, low power consumption and computation overhead, although lack of depth information [11]. The volume of the CW-DOT system can be miniaturized which is the biggest advantage than the other algorithms. Therefore, there exists the possibility of implementing hardware architecture for CW systems. However, little literature has been published on hardware architecture of CW-DOT signal processing. Most of CW-DOT systems post-process the signal by computer such as [12] and [13]. This will demolish the feature of portability, and make it difficult to miniaturize the system.
1.1.3 Electrocardiogram
Electrocardiography (EKG) is an interpretation of the electrical activity of the heart over time captured and externally recorded by skin electrodes [14]. It is a noninvasive recording produced by an electrocardiographic device. The EKG is an essential tool for health professionals in making a diagnosis of abnormal heart
6
rhythms when one is suspected.
The EKG works mostly by detecting and amplifying the tiny electrical changes on the skin that are caused when the heart muscle depolarizes during each heart beat. Usually more than 2 electrodes are used and they can be combined into a number of pairs. The output from each pair is known as a “lead”. Different types of EKG measurements can be referred to by the number of leads that are recorded, for example 3-lead, 5-lead or 12-lead EKGs. A 12-lead EKG is one in which 12 different electrical signals are recorded at approximately the same time and will often be used as a one-off recording of an EKG, typically printed out as a paper copy. 3- and 5-lead ECGs tend to be monitored continuously and viewed only on the screen of an appropriate monitoring device, for example during an operation or whilst being transported in an ambulance.
A typical EKG waveform shown in Figure 1.1 is composed of P peak, QRS peaks and T peak. How these peaks in the EKG are originated is explained in Table 1.3.
7
Table 1.3 Different peaks in a typical EKG waveform
Peak Origination and Description P Systole (depolarization) of the atrium.
QRS Systole (depolarization) of the ventricle. The amplitudes of QRS peaks are usually larger than P and T peaks, because the muscle of the ventricle is stronger.
T Repolarization of the ventricle.
Intervals between each peak can indicate the health of heart. The most common used three kinds of interval are listed in Table 1.4 with their usages and descriptions.
Table 1.4 Different types of peak interval that can be used to evaluate the health of the heart
Interval Description
RR interval Two adjacent R peaks can represent for the heart rate. The normal heart rate is between 50 bpm to 100 bpm (beat per minute). PR interval It is usually 120 to 200 ms long. The PR interval reflects the time
the electrical impulse takes to travel from the sinus node through the AV node and entering the ventricles. The PR interval is therefore a good estimate of AV node function.
A long PR interval (of over 200 ms) may indicate a first degree heart block. Prolongation can be associated with hyperkalemia or acute rheumatic fever.
A short PR interval may indicate a pre-excitation syndrome via an accessory pathway that leads to early activation of the ventricles, such as seen in Wolff-Parkinson-White syndrome.
A variable PR interval may indicate other types of heart block.
QT interval The QT interval generally represents electrical depolarization and repolarization of the left and right ventricles. A prolonged QT interval is a risk factor for ventricular tachyarrhythmias and sudden death.
Heart rate (HR) is a non-stationary value; it can vary as the body's need to absorb oxygen and excrete carbon dioxide changes, such as during exercise or sleep. The measurement of heart rate is used by medical professionals to assist in the diagnosis and tracking of medical conditions. It is also used by individuals, such as athletes, who are interested in monitoring their heart rate to gain maximum efficiency from their training.
8
Heart rate variation (HRV) may contain indicators of current disease, or warnings about impending cardiac diseases [14]; it has proved to be a valuable tool to investigate the sympathetic and parasympathetic function of the ANS, especially in diabetic and postinfarction patients [14]. Sympathetic activity is associated with the low frequency range (0.04–0.15 Hz) while parasympathetic activity is associated with the higher frequency range (0.15–0.4 Hz) of modulation frequencies of the HR. This difference in frequency ranges allows HRV analysis to separate sympathetic and parasympathetic contributions evidently [14].
On the other hand, time-frequency parameters calculated using wavelet transform and extracted from the nocturnal heart period analysis appeared as powerful tools for obstructive sleep apnoea syndrome diagnosis. Time-frequency domain analysis of the nocturnal HRV using wavelet decomposition could represent an efficient marker of obstructive sleep apnoea syndrome [15].
1.2 The Need for an Integrated Health-Care Solution
In recent years, many portable bio-signal acquisition systems are proposed in academic research, and in the business community, plenty of tiny bio-status recorder systems have already been sold in the health-care market for years. A major imperfection of such systems is that an integrated multiple bio-signals recording device, for example simultaneously recording EEG, ECG and fNIR, is not proposed lately. Data of multiple kinds of bio-signals recorded in synchronized timeline is much more useful than single kind recorded bio-signal. For example, modern people suffer more from the pressure living their life aberrantly, and many of them go to the hospital for evaluation of their sleeping quality, because they experience insomnia. In fact, according to one epidemiological study [16], about one-third of the adult population exhibit at least one symptom of insomnia. In the sleeping quality
9
evaluation process, the patients are required to be monitored by EEG, ECG, EMG, fNIR, respiration, posture and sound. When the observing target need to go to the restroom, he has to bring the EEG measuring headgear together with him, so it is very inconvenient, and at the same time the recording is interrupted although the information at the period is not really necessary. However, in such situation, an integrated portable system with the ability to wirelessly transmit data to the science station will bring the following advantages:
Much more comfortable for the observing target Short wiring for feeble physiological electrical signals
Decrease the chance of inaccurate measurement caused by the discomfort Decrease the chance of sensor fall off
Lower the cost
Extend the applicable range of the system
Such systems allow the observed target to move freely around an area with health-care science station service, while not losing the quality of the measurement. Therefore, the integrated portable health-care device has become an inevitable trend. In next section, three major target application scenarios will be point out, and in chapter 4, a complete architecture for portable brain-heart monitoring system will be proposed.
1.3 Application Scenarios
Before presentation of the detail design of the proposed system, three major target application scenarios are shown below. The system targets the usage in emergency condition, long-term medical observation and monitoring and potential researches on brain function and cognitive science, and the implemented chip can be integrated in portable devices in the following application scenarios.
10
1.3.1 Emergency Use
Current brain imaging technologies used in hospitals are not useful in emergency conditions. For example, we cannot equip a CT on an ambulance, but cerebral hemorrhage is a common case for the car accident victims. When we can use portable CW DOT devices on the ambulance to check if the patient suffers from cerebral hemorrhage, the medical personnel on the ambulance can inform the medical team in the hospital if cerebral hemorrhage happened on the patient.
Another common case happens when an infant falls over with his head knocking on the ground. Sometimes brain injury is hard to find out without the help of medical equipments, but people frequently ignore the possible dangerous behind this not to mention a baby that can barely talk. With the help of a cheap and portable DOT device, we can avoid many tragedies like this.
1.3.2 Long-term Observation and Monitoring
The traditional electroencephalogram acquisition systems and DOT systems are very large in size and also very heavy. Between the patient and the acquisition instruments, there are many connecting wires (one wire for each channel). Figure 1.2 in the next page shows the traditional electroencephalogram and DOT acquisition instruments.
11
(c) (d)
Figure 1.2 Traditional EEG measuring equipment (b) Traditional EEG System enlargement at head part (c) Frequency Domain DOT System (d) Frequency domain DOT system enlargement at head part
Such systems bring tremendous inconvenience to the patients especially in long-term monitoring cases, for example the patients suffer from seizure or the measuring object in the research of degenerative brain diseases. For these patients, wearing the wired headgear means the restriction of free movement. Furthermore, these equipments are always located in facilities like hospitals and health-care centers, so the patients and observing targets are required to stay in a restricted area. Figure 1.3 shows an advanced setup for our brain monitoring system.
Figure 1.3 Application scenario for the proposed wearable brain monitoring system
The system is interfaced with an analog front-end chip and a commercial Bluetooth module. NIR, EEG and ECG signal are acquired, processed and transmitted via the Bluetooth wireless link. Biomedical data received at the base station will be
12
decompressed, displayed in real-time on the screen of the science station, and finally stored into non-volatile storage media for further off-line processing, analysis and diagnosis. In addition, the data can be sent from the base station to a remote workstation for online monitoring and diagnosis by doctors in hospitals.
1.3.3 Research on Brain and Cognitive Science
The past researches have clearly shown that electroencephalogram (EEG) contains important information about human cognitive process. Human brain cognitive science has become a very important and challenging research direction since the twenty-first century, and the related topic includes brain computer interface [17], artificial intelligence, electronic prosthesis and even artificial neural tissues. Not only has the electroencephalogram shown its potential capabilities for human brain cognitive research, the information from functional near-infrared also provide cortical hemodynamic response and shows which area of the brain is currently active. The flexible nature of DOT, which uses a wearable imaging cap (Figure 1.2 (d)), makes it well-suited to human brain studies in enriched environments and for a wide range of behavioral paradigms and activations [18], including visual [19], during motor tasks [20], somatosensory system [21], auditory [22][23], and language [24][25] Although the instruments like Magnetic Resonance Imaging (MRI) and Positron Emission Tomography (PET) together with multiple channel EEG signal can provide significantly valuable brain activity information, but their high cost and huge size result in the low availability for academic research.
1.4 Importance of this Work
A power and area efficient 4-channel ICA processor involved with various design and optimization techniques is presented in this thesis. Low-power and low-cost make it possible to be used in portable devices, which are usually constrained by the limited
13
power consumption. Prolonged battery life also makes it possible to be integrated in portable long-term observation and monitoring systems.
An experimentally integrated system which comprises a novel functional near-infrared (fNIR) diffuse optical tomography system for taking brain image, an independent component analysis (ICA) processor for artifact removal from electroencephalogram (EEG) signal, and a heart rate variability (HRV) analysis processor for electrocardiogram (ECG) signal is implemented. The significance of this SoC is to enable practical developments of portable real-time brain-heart monitoring systems.
1.5 Organization of the Thesis
The organization goes as follows. In chapter 2, a hardware and power efficient 4-channel ICA processor is presented from the theory of ICA to the tape-out summary of the designed processor. Various design and optimization techniques including optimized data windowing, 3-bank circular memory allocation, an optimized mirrored non-linear lookup unit and operation pipelining between the ICA training and component extraction are all presented in section 2.2. Performance analysis of the 4-channel ICA processor using both certain super-gaussian random pattern and real EEG signal with or without eye-blink artifacts is demonstrated and compared with off-line result analyzed by EEGLab in section 2.3 with an example of eye-blink artifact removal. In section 2.4, the tape-out summary of the designed ICA processor using UMC 90nm CMOS technology is presented. In addition to functional verification and power consumption analysis, an FPGA-based Testbed built to provide an experiment and demonstration platform is shown in section 2.4.3.
In chapter 3, an experimental brain-heart monitoring system with the ICA processor integrated is shown. Overall system architecture and specifications are
14
documented in section 3.1 and 3.2. Three bio-signal processing processors that perform ICA, DOT and HRV function are briefly described in section 3.3. From section 3.4 to 3.6, designs and behaviors of the other system peripherals and data flow control units are described in detail. Finally we conclude the current achievements and the future works in chapter 4.
15
Chapter 2 4-Channel Independent Component Analysis Processor
In this chapter, the design of a 4-channel independent component analysis (ICA) processor adopted in the brain-heart monitoring system proposed in Chapter 3 is shown. It is employed to perform artifact removal from 4-channel EEG signals. First, the independent component analysis algorithm and the reason why the system comprises an ICA processor are introduced and described in section 2.1. The design of a hardware and power efficient 4-channel independent component analysis processor is then shown in section 2.2. In section 2.3, the performance analysis using super-gaussian random pattern and real EEG pattern recorded by NeuroScan system is presented and described in detail to prove the validity of the designed processor, and comparison with other hardware ICA implementation are also done In section 2.3. Finally in section 2.4, the physical information, tape-out summary, chip testing and power measurement of the fabricated chip using UMC 90nm CMOS technology is presented.
2.1 Independent Component Analysis
In recent years, independent component analysis (ICA) had been applied to different signal processing applications, such as speech enhancement, telecommunication, feature extraction and artifact removal from signals. In this section, we will define and explain blind source separation (BSS) problem and introduce the principles and the algorithm of ICA.
2.1.1 Blind Source Separation
Blind source separation (BSS), also known as blind signal separation, is the separation of a set of signals from a set of mixed signals, without the aid of information (or with very little information) about the source signals or the mixing process. Blind signal separation relies on the assumption that the source signals do not
16
correlate with each other. For example, the signals may be mutually statistically independent or decorrelated. Blind signal separation thus separates a set of signals into a set of other signals, such that the regularity of each resulting signal is maximized, and the regularity between the signals is minimized (i.e. statistical independence is maximized). In Figure 2.1, the problem definition of the blind source separation (BSS) is shown. The original source signals are mixed in the path transmitted to the sensors. Processed by the blind source separation, the unknown source signals may be revealed again.
Figure 2.1 Problem definition of the blind source separation (BSS)
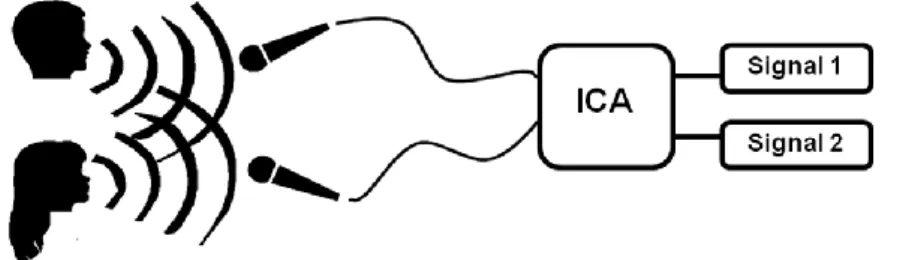
Blind source separation (BSS) problems are universal for signals acquired from natural sources for example light intensity, sound wave and electrical potential. The first problem of blind source separation (BSS) had been proposed to solve individual speech at a noisy cocktail party. It posed a serious problem that humans cannot understand their conversation when more than one person is speaking, and the concept using ICA to separate the two independent speeches is shown in Figure 2.2. There are also many similar problems, for example, EEG signals disturbed by artifacts, a speech in a noisy environment, and the signals include various sources that we want and do not want in the same location where sensors are placed.
17
2.1.2 Entropy and Mutual Information
Entropy and Mutual Information are the foundation of information maximization algorithms that includes the Infomax independent component analysis (Infomax ICA) algorithm chosen for the designed 4-channel ICA processor. Therefore, before introduction to Infomax ICA algorithm, the concept of Entropy and Mutual Information used are first clarified in this section.
The entropy is a function of random variable which tries to describe the “unpredictability” of a random variable with non-negative values, and the value of entropy becomes zero when the input random variable is “certain” when predicted. The entropy function of a random variable X is defined by:
(2.1)
The X in equation 2.1 is a random variable and P(X) is the probability distribution function (PDF) of X, also known as the probability density function. The value of entropy is not only influenced by the value territory of the random variable, but also influenced by the probability distribution.
The joint entropy is defined as the entropy of a joint probability distribution of two or more random variables, or a multi-valued random variable. For two random variables X and Y, the joint entropy is defined by
(2.2)
The conditional entropy is a statistics that summarizes the randomness of Y given knowledge of X. It is defined by:
(2.3)
The conditional entropy H(Y|X) is H(Y) without H(X) and the conditional entropy H(X|Y) is H(X) without H(Y). If there exists correlation between H(Y) and H(X),
18
then , and if two random variables X and Y are statistically independent, the joint entropy H(X,Y) equals to the sum of the independent entropies , that is H(X)+H(Y).
Mutual information is a quantity that measures a relationship between two random variables that are sampled simultaneously. The mutual information of two discrete random variables X and Y is defined by
(2.4)
Figure 2.3 Entropy relationship presented by the concept of set
From the concept to express entropy using set in Figure 2.3, we define the entropy defined both in H(X) and H(Y) to be mutual information I(X,Y), with
H(X,Y) = H(X)+H(Y|X) = H(Y)+H(X|Y)
=H(X)+H(Y)-I(X,Y) (2.5) Therefore the mutual information is then defined as
I(X,Y)=H(X)-H(X|Y) =H(Y)-H(Y|X) =H(X)+H(Y)-H(X,Y)
19
Minimization of the mutual information will lead to the maximization of the independence between the random variables, and if the mutual information between two random variables is zero, the two random variables are statistically independent. In the other hand, the smaller mutual information we derive, the more statistically independent two random variables we will have. With this conclusion, we will introduce the Infomax ICA algorithm using the concept in the next section.
2.1.3 Infomax ICA
Recently, blind source separation by Independent Component Analysis (ICA) has received attention because of its potential applications in signal processing such as in speech recognition systems, telecommunications and medical signal processing. The goal of ICA is to recover independent sources given only sensor observations that are unknown linear mixtures of the unobserved independent source signals. In contrast to correlation-based transformations such as Principal Component Analysis (PCA), ICA not only decorrelates the signals (2nd-order statistics) but also reduces higher-order statistical dependencies, attempting to make the signals as independent as possible.
There have been two different fields of research considering the analysis of independent components. On one hand, the study of separating mixed sources observed in an array of sensors has been a classical and difficult signal processing problem. The work on blind source separation by Jutten, Herault and Guerin (1988) where result in an adaptive algorithm using simple feedback architecture, and its learning rule was based on a neuromimetic approach that is able to separate simultaneously unknown independent sources. Furthermore, Comon (1994) introduced the concept of independent component analysis and proposed cost functions related to the minimization of mutual information between the sensors. On the other hand and in parallel to blind source separation studies unsupervised learning
20
rules based on information-theory have been proposed by Linsker (1992), Becker and Hinton (1992) and others. This idea is to maximize the mutual information between the inputs and outputs of a neural network. This approach is related to redundancy reduction which was suggested by Barlow (1961) as a coding strategy in neurons. Each neuron should encode features that are statistically independent from other neurons. This leads to the notion of factorial code that has been explored for the visual processing strategy by Attik (1992). Nadal and Parga (1994) showed that in the low-noise case, the maximum of the mutual information between the input and output of a neural processor implied that the output distribution was factorial. Roth and Baram (1996) and Bell and Sejnowski (1995) independently derived stochastic gradient learning rules for this maximization and applied them, respectively to forecasting and time series analysis, and the blind separation of sources. Bell and Sejnowski (1995) were the first explaining the blind source separation problem from an information-theoretic viewpoint and applying them to separation and deconvolution of sources.
Extensive simulations have been performed to demonstrate the power of the learning algorithm. However, instantaneous mixing and unmixing simulations are problems and the challenge lies in dealing with real world data. Makeig et al. (1996) applied the original Infomax algorithm to EEG and ERP data showing that the algorithm can extract EEG activations and isolate artifacts. Jung et al. (1997) show that the extended Infomax algorithm is able to linearly decompose EEG artifacts such as line noise, eye blinks, and cardiac noise into independent components with sub- and super-Gaussian distributions. McKeown et. al. (1997) have used the extended ICA algorithm to investigate task-related human brain activity in fMRI data. By determining the brain regions that contained significant amounts of specific
21
temporally independent components, they were able to specify the spatial distribution of transiently task-related brain activations.
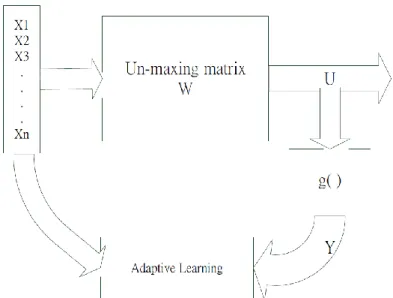
As previously described, ICA algorithm not only decorrelates a signal (second-order statistical independence), but also reduce the dependency in higher order statistics. In other words, the goal of independent component analysis is to find a linear but not necessarily for the orthogonal coordinate system which can express multi-dimensional data. The independent multivariate random processing is involved in the various components of all the order of the statistics. The computation complexity of the statistics over second-order is significantly high, so using an adaptive learning unit which replaces the higher order calculation with adding a non-linear function g( ) after each component make u(t) approaches to s(t). The g( ) can be single-tone non-decreasing functions with values between 0 and 1, such as sigmoid and hyperbolic tangent function. Bell and Sejnowski (1995) [26] presented the Infomax ICA algorithm, which is suitable for separation of super-Gaussian sources.
The Infomax method performs linear ICA based on a principle of maximum information preservation. However, it can also be seen as a maximum likelihood method, or as a method based on the minimization of mutual information between y = g(u)(g( ) is sigmod function) The goal of Infomax ICA is to find an unmixing weight W that can be used to estimate the independent component signals. The adaptive learning ICA algorithm is shown in Figure 2.4. The input X is the signal mixture, and U is calculated by
U = W*x (2.7) The output Y is expressed by
22
Figure 2.4 Adaptive learning independent component analysis The information which output Y includes X is defined in equation 2.6.
I(Y,X)=H(Y)-H(Y|X)
Where H(Y) is the entropy of the output, while H(Y|X) is whatever information the output has which didn‟t come from the input. In the case, we have no noise, the mapping between X and Y is deterministic and H(Y|X) has its lowest possible value. We differentiate equation 2.6 as shown in equation 2.9
,
( )I Y X H Y
w w
(2.9)
H(Y|X) do not rely on w, so the part H Y X( | )
w
is zero. The information transfer
between the input X and output Y is maximized by maximizing the joint entropy of the output, H(Y). As discussed above, finding a function Y=f(X) that maximizes I(X,Y) is equivalent to maximizing H(Y).
The equation for the joint entropy of the output Y is the sum of the individual entropies minus the mutual information between them, and it‟s a way of information maximization that reduces statistical dependence. The equation is expressed as
( 1) ( 2) ... ( ) ( 1, 2,.... )23
From Equation 2.10, maximizing the output entropy H(Y) is equivalent to minimizing the mutual information of the extracted components yi, and individual outputs will
move towards the statistical independence. The transformation between y and u is a monotonic transform, and information maximization uses this concept to achieve the goal of ICA. The coefficient of adjustment from Infomax algorithm which was proposed was based on the conventional rules of stochastic gradient method. Gradient method will be introduced as follow.
First, consider an input variable, x, which passed through a transforming function, g(x), to produce an output variable, y. The probability density function (PDF) of the output p(y) can be expressed as a function of the PDF of the input p(x).
( ) ( ) p x p y y x (2.11)
The entropy of the output, H(y), is given by
1 1 ( ) ( ) ( ) ln ln ( ) ln ( ) H y E p y dy p y p y
(2.12) From equation 2.11 and 2.12, H(y) can be expressed as( ) (ln y) [ln ( )] H y E E p x x (2.13)
In order to maximize the entropy of y by changing W, maximizing the first term which is the average log of how the input affects output need to be focused on. This can be done by considering the training set of x to approximate the density p(x), and deriving a stochastic gradient descent learning rule:
1 (ln ) ( ) ( ) H y y y w w w x x w x (2.14)
Y is the output of sigmoid function, 1 1 u
y
e
, and uwxw0 in which the input
24 (1 ) y wy y x (2.15) ( y) y(1 y)(1 wx(1 2 ))y w x (2.16)
Equation 2.15 and 2.16 are the learning rule, and equation 2.17 summarize it as
1
(1 2 )
w w x y
(2.17) To see the advantages of approach in artificial neural networks, the analysis of multi-input and multi-output can be described as follow. The input x is a vector in a network, and a weight matrix W and a monotonically transformed output vector
0
( )
yg Wx w , the multivariate probability density function of y can be written
( ) ( ) p x
p y J
(2.18) where J is the absolute value of the Jacobian of the transformation.
1 1 y x 1n y x 1 n y x nn y x (2.19)
For sigmoid function, 1 1 u y e , and uWxw0, and (1 ) y y y u , so equation 2.18 can be written (2.20) From equation 2.12, the joint entropy of the output is
1 ( ) [ln ] [ln ] [ln ( )] ( ) H y E E J E p x p y (2.21) Weights can be adjusted to maximize H(y), as before, and they only affect the
[ln ] E J . 1 ( ) (ln | |) ln det ln n | i(1 i) | i H y w J W y y w w W W
(2.22)25
For the full weight matrix, the definition of inverse of a matrix and the adjoint matrix, adj W , is the transpose of the matrix of cofactors.
1 ln detW [WT] W (2.23)
The product splits up into a sum of log-terms, only one of which depends on particular w. 1 1 1 1 ln n | i(1 i) | ln n | | n ( ) ( ) (1 2 ) T i i i y y y y y y x W W x x W x
(2.24)The resulting learning rules, equation 2.21 can be written
1
[( T) (1 2 ) T]
W W y x
(2.25) Equation 2.25 involves the calculation of inverse matrix, so the computation complexity is high. To solve this problem equation 2.25 is multiplied by WTW which
rescales the result and the new learning equation becomes
1
[( T) (1 2 ) T] T [ (1 2 ) T]
W W y x W W I y u W
(2.26)
Because it avoids the calculation of matrix inverse, the computation time is reduced significantly.
2.2 Design of the 4-Channel ICA Processor
In physiological electrical signal measurement, the observed signals are always the superposition of independent source signals. In addition, EEG signals are especially vulnerable and easily contaminated by artifacts such as eye movement, eye blink, power line noise and muscle (EMG) noise due to its signal strength of micro volt scale which pose serious problems in analyzing and interpreting the EEG recording [27]. ICA has already shown to be an effective, powerful and applicable method for EEG de-noising, which is able to separate EEG components and artifact components to different channels. Components recognized as the artifact can be removed easily by generating a mixing matrix with the weight to the artifact channel
26
set 0, and the remixed EEG signals will be clean with only small influence caused by the artifact due to the limitation of the algorithm. To acquire clean EEG signal for observation or analysis, a 4-channel ICA processor for artifact removal is designed and employed in the proposed brain-heart monitoring system. With the designed ICA processor, real-time applications using EEG signals become feasible and more robust.
2.2.1 Overall Architecture of the ICA Processor
Figure 2.5 shows the overall architecture of the four-channel ICA processor. It comprises four main processing units: a first stage buffering and calculation unit (S1), a whitening unit (WU) for calculation of the whitening matrix, an ICA training unit (TU) for unmixing weight training, and an ICA computation unit (CU) for constructing the whitened unmixing weight matrix and the resulting components extracted. Operation pipelining is applied between the data processing (S1, WU and TU) and the ICA output calculation (CU). Therefore, the hardware can be used efficiently.
27
The algorithm can be divided into three stages:
1. Pre-Processing Stage (performed by S1 and WU)
In the pre-processing stage, the raw EEG data is pre-processed by data centering and whitening transformation. The whitening transformation is a decorrelation method that converts the covariance matrix COV_X of a set of samples into the identity matrix I. This effectively creates new random variables that are uncorrelated and have the same variances as the original random variables. The method is called the whitening transform because it transforms the input matrix closer towards white noise. After the decorrelation, training iteration need to achieve convergence can be largely decreased. The pre-processing is done in S1 and WU.
2. ICA Unmixing Weight Training Stage (performed by TU)
The pre-processed data is then used by the TU to find the best unmixing matrix that achieves maximum independence between each component. The TU is designed using the Infomax ICA algorithm described in the section 2.1.3.
3. Component Computation Stage (performed by CU)
The components are extracted in this stage. The raw EEG data, the P matrix from whitening unit (WU) and the W matrix from ICA training unit (TU) are all required to perform the computation of the resulting components in ICA computation unit (CU). In addition, a handshaking mechanism is implemented to make the output interface flexible.
The calculation and the corresponding module designs are described in the following sections in detailed, and the decision of window size and the design of the training parameters will be explained and analyzed.
28
2.2.2 Stage 1 Unit and the Data Windowing Technique
The stage1 unit (S1) for buffering and data pre-processing shown in Figure 2.6 comprises an input buffering unit (IBU), a mean and covariance calculation unit (MeanCov), and a data centering unit (CTR).
Figure 2.6 The architecture of STAGE1 unit
The input buffering unit employs three interleaved SRAM modules to store and manage the raw EEG sampled data. The three memory modules inside IBU are identical with size equal to 32 words, and each word is 10 bits long. In Figure 2.6, the internal connections of different function are distinguished by their color. The green connections are the data input interface, and the blue connections are the data output interface, while the red ones are the control signal used to perform the pipeline scheduling scheme. The IBU functions as the data controller of the ICA processor that supports the sliding window scheme and pipeline scheduling. The timing plot of the sliding window scheme and pipeline scheduling scheme is shown in Figure 2.7.
29
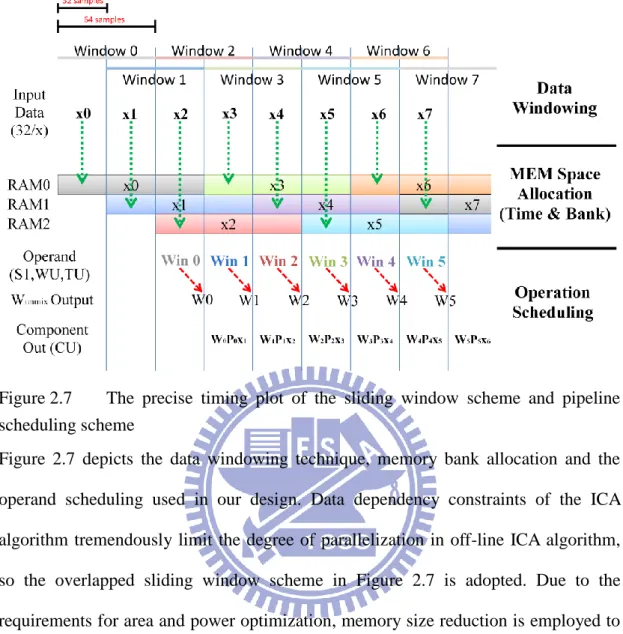
Figure 2.7 The precise timing plot of the sliding window scheme and pipeline scheduling scheme
Figure 2.7 depicts the data windowing technique, memory bank allocation and the operand scheduling used in our design. Data dependency constraints of the ICA algorithm tremendously limit the degree of parallelization in off-line ICA algorithm, so the overlapped sliding window scheme in Figure 2.7 is adopted. Due to the requirements for area and power optimization, memory size reduction is employed to minimize the chip area and power consumption to acceptable levels at minimal performance loss. As shown in Table 2.1, the option with window size of 512 with half overlapping sliding window achieves 0.9208 in correlation coefficient using super-gaussian random pattern sets. However, to implement the corresponding architecture using the same memory management scheme, it takes 30.72 Kilo-bits of memory size. It is not acceptable for portable devices that aims on low-power and low-cost design. Therefore, a window size of 64 with 50% overlap and 0.8401 correlation is chosen. Only 3.84 Kilo-bits memory size is required for the chosen window size, resulting 85% in savings compared with the one with window size of