中國自行車產業的發展 - 政大學術集成
85
0
0
全文
(2) 中國自行車產業的發展 The Development of Bicycle Industry in China 研究生: 林佩宜. Student: Lin, Pei-I. 指導教授: 黄仁德. Advisor: Dr. Hwang, Jen-Te. 國立政治大學 亞太研究英語碩士學位學程 治. 立. 政. 碩士論文 大. ‧. ‧ 國. 學 A Thesis. Nat. sit. y. Submitted to International Master’s Program in Asia-Pacific Studies. er. io. National Chengchi University. n. v In partiala fulfillment of the Requirement l ni Ch. engchi U. For the degree of Master in China Studies. 中華民國 102 年 7 月 July 2013. II.
(3) Acknowledgements. I would like to give my gratitude to the faculty of International Master’s Program in Asia-Pacific Studies for providing me this precious opportunity to study in National Chengchi University. It broadened my horizon and enriched my knowledge. Sincere thanks go to my advisor, Prof. Hwang, Jen-Te (黃仁德), for his dedication to always assist me in my thesis, and his critical comments aiming to enhance and improve the present research. I would also like to express my sincere respect to the final defense committee, professor Kao, An Pang (高安邦), and professor Hwang, Yu Ning (黄俞寧). They provide me many concrete and constructive suggestions.. 政 治 大 Studies), for suggesting me the detail about the thesis, and making me have a comfortable and 立. I would like to thank the staff of IMAS (International Master’s Program in Asia-Pacific. memorable experience in NCCU.. ‧ 國. 學. To colleague in NCCU, Ting-Hua, Yang, Hsiao-Yun Yen, Kelly Chiu, and Eric Tesng, thank you for assisting me in solving the problem encountered in research, and encouraging me. ‧. during the difficult period in my study.. y. Nat. Finally, sincere and special appreciation goes to my family, especially my father and my. io. sit. husband. My father helped me for collecting data about Chinese bicycles. Without his help, my. n. al. er. data of statistics of Chinese bicycle won’t contain so many details. I also thank for my husband,. i n U. v. his professional knowledge about bicycle industry and warmest support are the most precious. Ch. engchi. wealth I have. Thanks for his driving me to school for 4 hours during the time when I studied in NCCU.. III.
(4) Abstract The purpose of this paper was to review bicycle industry development in China from 1970s till now. The paper presented the trading statistics about China. As bicycle industry clusters moved from Japan and then to Taiwan and to China again, the statistics of Eastern and Asian countries can be discussed and to be analysis the role of China played in the global value chain. Given trading statistics about France, Germany, Italy, Japan and Taiwan, the role China plays in the global market can be easily displayed. Transforming from planned economy to free market economy, the overview on bicycle development in southern, central and northern region in China gave evidence that Chinese. 政 治 大 labor division, strategies and market orientation adopt by enterprises can be seen in the three 立 regions. Business decisions and costs are made in response to market signals, and without bicycle industry grew with the state owned enterprises and foreign funded enterprises. Different. ‧ 國. 學. significant state interference.. During the investigation, we reviewed the historical Taiwanese and Chinese bicycle. ‧. industry. Taiwan bicycle manufactures moved the low end production line to China and brought. sit. y. Nat. in investment on facility, technology, and special knowledge to China. Taiwan benefited from this labor division and gave China a chance to build a more defined bicycle industry cluster.. io. n. al. er. After the implementation of ECFA, the labor division between China and Taiwan will be more. i n U. v. subtle, concrete and clear. China may benefits from knowhow from the Taiwan funded. Ch. engchi. enterprises while Taiwan enterprises make profits from gaining the share of Chinese home market. On top of competition and dumping charge from other countries, China itself was a big bicycle ownership country. Upon favored by the national transportation could trigger another booming in the development of bicycle industry.. IV.
(5) Contents Chapter 1. Introduction………………………………………………………………………….1. 1.1 Motivation ..................................................................................................................1 1.2 Research Objectives ....................................................................................................2 1.3 Framework ..................................................................................................................3 Chapter 2. Bicycle Industry in the World .................................................................................5. 2.1 Bicycle Industry in France ...........................................................................................5 Production, Export, and Import of Bicycle ......................................................6. 2.1.2. Bicycle Domestic Sales ...................................................................................6. 2.1.3. Sales of Bicycles by Category ..........................................................................7. 2.2.1. Production and Sales of Bicycle .......................................................................9. 2.2.2. Exports and Imports of Bicycle ...................................................................... 10. 2.2.3. Sales of Cycles by Category .......................................................................... 11. 2.2.4. Bicycle Planning Policy ................................................................................ 12. 政 治 大 2.1.4 Bicycle Planning Policy ..................................................................................8 立 Bicycle Industry in Germany .......................................................................................8. 學. ‧. ‧ 國. Nat. y. 2.2. 2.1.1. sit. 2.3 Bicycle Development in Italy .................................................................................... 12. 2.3.2. Exports and Imports of Bicycle ...................................................................... 13. al. v i n C h ................................................................................ Bicycle Planning Policy 14 engchi U n. 2.3.3. er. Production and Sales of Bicycle… ................................................................. 13. io. 2.3.1. 2.4 Bicycle Industry in Japan .......................................................................................... 14 2.4.1. Production, Export, Import, and Domestic Sales of Bicycle .......................... 15. 2.4.2. Bicycle Planning Policy ................................................................................. 17. 2.5 Bicycle Industry in Taiwan........................................................................................ 17 2.5.1. Production, Export, Import, and Domestic Sales of Bicycle .......................... 18. 2.5.2. Bicycle Planning Policy ................................................................................. 23. 2.6 Summary................................................................................................................... 24 Chapter 3. Bicycle Industry in China ..................................................................................... 25. 3.1 Production Export and Import of Chinese Bicycle ..................................................... 25 3.1.1. Exports and Imports of Bicycle in China ........................................................ 26 V.
(6) 3.1.2. Production and Exports on Five Dominant Provinces ..................................... 28. 3.2 Bicycle Industry Development in China’s Southern Region....................................... 29 3.2.1. Production of Guangzhou and Guangzhou Wuyang ....................................... 30. 3.2.2. Branded Bicycle Companies in Southern China ............................................. 32. 3.3 Bicycle Industry Development in Central Region of China ........................................ 33 3.3.1. Development of Bicycle Groups in Shanghai, Zhejiang and Jiangsu............... 34. 3.3.2. Bicycle Components Companies in Central China ......................................... 35. 3.4 Bicycle Industry Development in Northern Region of China ..................................... 36 3.5 Summary................................................................................................................... 38 Chapter 4. Comparison Of Bicycle Industry in China and Taiwan.......................................... 39. 政 治 大 Historical Overview on Bicycle Industry Development in China .................... 40 立 Historical Overview on Taiwan Bicycle Industry ........................................... 42. 4.1 Historical Overview on Bicycle Industry Development in China and Taiwan ............ 39. 4.1.2. 學. ‧ 國. 4.1.1. 4.2 SWOT Analysis of Bicycle Industry in China and Taiwan ........................................ 44 Internal factors: Strength and Weakness ......................................................... 45. 4.2.2. External factors: Opportunities and Threats .................................................... 51. ‧. 4.2.1. y. Nat. 4.3 Public Bicycle Policies .............................................................................................. 56. 4.3.2. Chang on Governmental Cycling Policy ........................................................ 58. er. sit. Governmental Policy Restricting Usage of Bicycles ...................................... 57. io. 4.3.1. al. n. v i n C h................................................................................... Chapter 5 Conclusion and Suggestion 61 engchi U 5.1 Conclusion ................................................................................................................ 61 4.4 Summary................................................................................................................... 59. 5.2 Suggestion ................................................................................................................ 64 Reference………………………………………………………………………………………...70. VI.
(7) List of Tables Table 2-1 Production of Bicycle in France ...................................................................................6 Table 2-2 Import and Export of Bicycles in France ..................................................................... 6 Table 2-3 Bicycles Sales in France ............................................................................................. 7 Table 2-4 Average Selling Price per Cycle in France .................................................................. 7 Table 2-5 Sales of Bicycles by Category in France...................................................................... 8 Table 2-6 Bicycle Production and Sales in Germany ................................................................... 9 Table 2-7 Average Selling Price per Cycle in Germany............................................................... 9 Table 2-8 Top 10 Countries Importing Bicycles and Parts from Germany ..................................10 Table 2-9 Top 10 Countries Exporting Bicycles and Parts to Germany.......................................11 Table 2-10 Proportion of Sales of Cycles by Category in Germany ............................................12. 政 治 大 Table 2-12 Average Selling Price per Cycle in Italy ...................................................................13 立 Table 2-13 Exports and Imports of Bicycles in Italy...................................................................14 Table 2-11 Production and Sales of Bicycles in Italy..................................................................13. ‧ 國. 學. Table 2-14 Statistic Data of Bicycle in Japan .............................................................................15 Table 2-15 Countries Importing Bicycles from Japan .................................................................16. ‧. Table 2-16 Statistic Data of Bicycles in Taiwan .........................................................................19 Table 2-17 Proportion of Top 5 Countries Exporting Bicycles and Parts to Taiwan ....................20. Nat. sit. y. Table 2-18 Proportion of Top 5 Countries Importing Bicycles and Parts from Taiwan...............20. io. er. Table 2-19 List of Bicycle Parts.................................................................................................21 Table 2-20 Top 5 Countries Exporting Bicycle Parts to Taiwan .................................................22. n. al. i n U. v. Table 3-1 Sales of Bicycles by Category ....................................................................................26. Ch. engchi. Table 3-2 Countries Importing Bicycles and Parts from China ...................................................27 Table 3-3 Top 10 Countries Importing Electric Bicycles from China..........................................28 Table 3-4 Bicycle Production of Top 5 Provinces in China ........................................................29 Table 3-5 Production of Bicycle in Guangdong, Guangzhou, and Wuyang .................................31 Table 3-6 Domestic Sales of Three Branded Companies ............................................................33 Table 3-7 Numbers of Bicycle Firms in Tianjin .........................................................................37 Table 4-1 SWOT Analysis of Bicycle Industry in China ...........................................................46 Table 4-2 SWOT Analysis of Bicycle Industry in Taiwan .........................................................46 Table 4-3 Import Tax Rate on Bicycle and Parts in Taiwan and China .......................................54 Table 4-4 Timetable Anti-Dumping and Anti-Circumvention Measures .....................................57 Table 4-5 Number of New Bike Sharing Projects .......................................................................59. VII.
(8) C. HAPTER 1 Introduction. 1.1 Motivation Bicycle, textile products, and shoes are three industries which had contributed large foreign exchange reserve for Taiwan. I had worked in a bicycle company and my husband also. 政 治 大 various bicycle bags. The bicycle 立industry under the effects of globalization, in addition to has been working for more than 14 years in a bicycle accessory company which produces. ‧ 國. 學. concerns of environmental protection, exercise and leisure recreation, has become one of Taiwan’s economic developmental niches.. ‧. From 2009 through 2012 the Council for Economic Planning and Development (CEPD) promotes green bike-riding recreation and tourism in Taiwan, by allocating NTD4 billion for. Nat. sit. y. investment in the development of a recreational bikeway system. This will give Taiwan 3,823. al. er. io. kilometers of bikeways, divided into 17 regional networks, in 2012. Both government and. n. bicycle manufactures notice the relationship between the development of bicycles and tourist. Ch. i n U. v. industry. Giant’s slogan, “Ride Life, Ride Giant” commercializes its life philosophy as cycling. engchi. for life by riding Giant. Bicycle is not just a kind of two-wheel transportation anymore. It also symbolizes green and environment friendly means. Bicycle sharing system is highly welcome by countries. Several cities actually had an official policy to get rid of bicycles. Many others took actions to discourage bicycles. For example: Zhengzhou, with its “Smooth Traffic” initiative in 2004, changed some bicycle lanes into motor vehicle lanes and combined bicycle lanes with pedestrian lanes on sidewalks at both sides of the road. Kaohsiung’s public bicycle had been used 1,487,448 times from 2009 to February of 2013. China is a big market and competitor for Taiwanese manufactures. With advance technology and innovation, Giant and other branded bicycle producers expand their market not only in China but also on global market. China is one of these Taiwanese 1.
(9) manufactures’ production lines as well as Taiwanese manufactures’ market. To study China’s bicycle industry is to know where Taiwanese Chinese manufactures’ comparative advantages lie and see how Taiwanese leading bicycle manufactures can play an important role within the bicycle industry development in China.. 1.2 Research Objectives Taiwan was once the biggest bicycle supplier in the world after its place was taken by China. Now Taiwan’s bicycle export is fourth-ranked after China, India and the USA. Chinese bicycle makers now enjoy booming bicycle industry development. The objectives which this paper is going to achieve are as follows.. 政 治 大. 1. To explore Chinese bicycle industry in the global value chain. Export of Chinese. 立. bicycle is declining due to financial crisis and other countries’ trading policies. For the bicycle. ‧ 國. 學. makers, although anti-dumping affects its export market the local market is just going to grow. China local government prohibits motorcycles in the cities; it promotes the growth of bicycle. ‧. users. Taiwanese bicycle enterprises which set the factories in China are targeting the local market and expanding its local market share.. y. Nat. sit. 2. To study how the clusters formed in the regions in China by investigating exports and. n. al. er. io. imports of China’s bicycle industry. Business decisions and costs are made in response to market. iv n U the industry. of. signals, and without significant State interference. By cooperating with foreign funded. Ch. engchi. enterprises, China tripled bicycle use and production. Tianjin government. invested 20 billion RMB to build a “China Bicycle Kingdom Industry Zone” in Wuqing district to make Tianjin a bicycle producer leader in China aiming to make technical and innovational progress in bicycle industry within 5-10 years. 3. To analyze historical development of bicycle industry in China and the impact which state owned companies place on the bicycle industry. Following skyrocketing oil price, the green alternative transportation, bicycles, are catching the eyes of consumers. Countries are promoting bicycles for commuter’s alternative transportation by building an extensive network of interconnected city-level and district-level bike paths or lanes, complemented by networks of bicycle-friendly streets shared with cars (at low traffic speeds and volumes) and supporting 2.
(10) facilities like bike parking. Electric bicycle market in China is booming. China’s local governments are regulating safety standards of electric bicycle equipments and its public bike using policy, such as bike sharing system (BSS). 4. To investigate market and government policies for bicycle industry in China and provide a closer look into its competiveness of the bicycle industry in China. Since economic reforms introducing capitalist market principles began in 1978, China has been the second largest economy after United States. China could be a behemothic competitor as well as a hungry consumer in the global economic.. 1.3 Framework. 政 治 大. This paper is composed by 5 chapters. Chapter1 gives general introduction of the research.. 立. Chapter 2 discusses the bicycle industry in the developed countries, such as, France, Germany,. ‧ 國. 學. Italy, Japan and then Taiwan and compares the production and sales of bicycles in France, Germany, Italy, Japan and Taiwan. Germany, France, Italy, and Japan are in top 10 GDP of the. ‧. world and are also big oil and gas consumers. Policy makers of these countries face critical choices in reconciling energy, environmental and economic objectives so the related CO2. y. Nat. sit. emission reduction policies of these countries will be discussed. Chapter 3 is dedicated to bicycle. er. io. industry’s development in China. Due to early planned economic central government dominated. al. v i n C hwhich is induced U would be highly related to the network by the cooperation between complete engchi bike factories, its parts suppliers and local government. Such supplier chains are interconnected n. the hiring of employees, production and sales of bicycles. Thus bicycle industry development. and have its geographical development history. The bicycle cluster in the Southern, Central and Northern regions will be analyzed. The research for the industry cluster in Southern, Central and Northern China can exhibit how bicycle industry in China transferred its planned market economic industry into a market economic. Chapter 4 is to see the difference of bicycle industry between China and Taiwan. This part studied the development history in Taiwan and China and what kind of role government plays in the bicycle industry. On top of that the policy of bicycle usage in China is discussed. Bicycles had been been viewed as a transport which caused traffic congestion by Chinese government so the bicycles had been prohibited due to governmental policy. The government policy toward 3.
(11) bicycle usage affect consumer’s willing of buying bicycles. Till now bicycle usage gains the reverse reaction from the government because of green policy. Chapter 5 presents conclusions and the suggestion for the bicycle development in China.. 立. 政 治 大. ‧. ‧ 國. 學. n. er. io. sit. y. Nat. al. Ch. engchi. 4. i n U. v.
(12) C. HAPTER 2 Bicycle Industry in the World. Around middle of 1960s, world production of cars and bikes was nearly 20 million, but as of 2003 bike production had climbed to over 100 million per year compared with 42 million cars. In 2004 bicycle production was 105 million units, a 1.5% increase over 2003. In 2010 ratio of the. 政 治 大. vehicles in operation in the U.S.in 2010 was 1:1.3 among a population of almost 310 million –. 立. the highest vehicle-to-person ratio in the world. Italy was second with 1:1.45. France, Japan, and. ‧ 國. 學. the U.K. followed, all of which were in the 1:1.7 range (Sousanis, 2011). Regarding to the economic size, according to the World Bank (2011) the US ranked as the. ‧. first in GDP for 69,983,693 million. China ranked as the second, Japan as the third, Germany the fourth, France the fifth, and Italy the eighth. Since GDP of Germany, France and Italy are in top. Nat. sit. y. 10, they are also the top 5 energy consumers in EU27 according to a report, ENER23 (Eurostat,. io. er. 2011). Germany is the biggest consumer in EU27, followed by France, U.K. and Italy. According to a report 96% energy consumption of the 13,760 billion passenger-km. n. al. Ch. i n U. v. traveled in 2000 was attributed to the Europe of Fifteen, the U.S., Japan. Passenger transport. engchi. demand is closely related to household revenue, commuting distance and the distance between home and school or working place. Road transport totally dominates the energy balance in these developed countries. The Europe of fifteen, the U.S., and Japan are the main consumers of oil and consumed the share 75% of the 1.75 Gtoe by world transport (Eurostat, 2011). This chapter is to analysis bicycle development of the five countries, France, Germany, Italy, Japan and Taiwan from data of production export import domestic sales on varied bicycles and its governmental policy to promote bicycle using. 2.1 Bicycle Industry in France France has created cycling friendly environment for years. In urban areas was existed 14,000 km of cycling infrastructure. 8,000 km cycle routes and green ways have been built over 5.
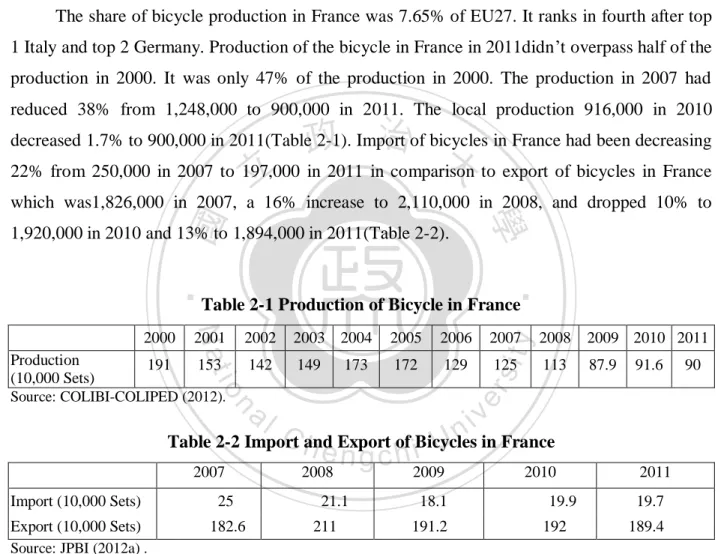
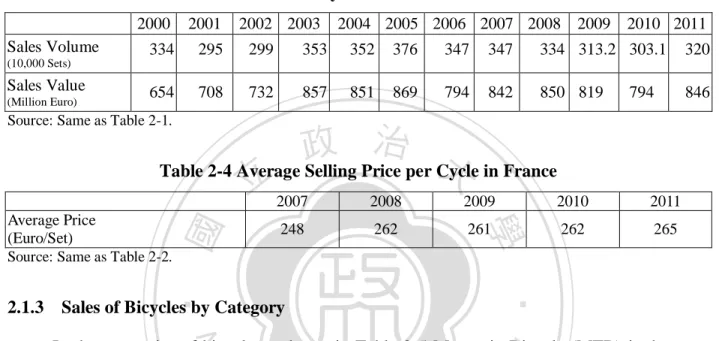
(13) the last 10 years. France found out that per EUR one million investment on bicycle economy creates 10 jobs compared to 2.5 jobs in automobile industry and EUR 500 million from state or local authorities created EUR4.2 billion economic activity, EUR 700 million in tax receipts and 35,000 jobs (Roche, 2010).. 2.1.1 Production, Export, and Import of Bicycle The share of bicycle production in France was 7.65% of EU27. It ranks in fourth after top 1 Italy and top 2 Germany. Production of the bicycle in France in 2011didn’t overpass half of the production in 2000. It was only 47% of the production in 2000. The production in 2007 had reduced 38% from 1,248,000 to 900,000 in 2011. The local production 916,000 in 2010. 政 治 大 22% from 250,000 in 2007 to 197,000 in 2011 in comparison to export of bicycles in France 立. decreased 1.7% to 900,000 in 2011(Table 2-1). Import of bicycles in France had been decreasing. which was1,826,000 in 2007, a 16% increase to 2,110,000 in 2008, and dropped 10% to. ‧ 國. 學. 1,920,000 in 2010 and 13% to 1,894,000 in 2011(Table 2-2).. ‧. Table 2-1 Production of Bicycle in France 2002. 2003 2004. 2005. 2006. 2007. y. 2008. 2009 2010 2011. Production 191 153 (10,000 Sets) Source: COLIBI-COLIPED (2012).. 142. 149. 172. 129. 113. 87.9. 173. 125. al. n. v i n C hand Export of Bicycles Table 2-2 Import e n g c h i U in France 2007. Import (10,000 Sets). 25. Export (10,000 Sets) Source: JPBI (2012a) .. 182.6. 91.6. 90. er. io. 2001. sit. Nat. 2000. 2008. 2009. 21.1. 18.1. 211. 191.2. 2010 19.9 192. 2011 19.7 189.4. 2.1.2 Bicycle Domestics Sales The share of bicycle sales in France was 16% of EU27, and ranked third after top 1 Germany and before top 4 Italy (COLIBI-COLIPED, 2012). The production in 2011 was slightly down 2%, its sales were risen 6% and the value also up 6.5% to EUR846 million compared to sales of 3,031,000 sets with 794 million in 2010 (Table 2-3). Sales quantities of bicycles in 2011 6.
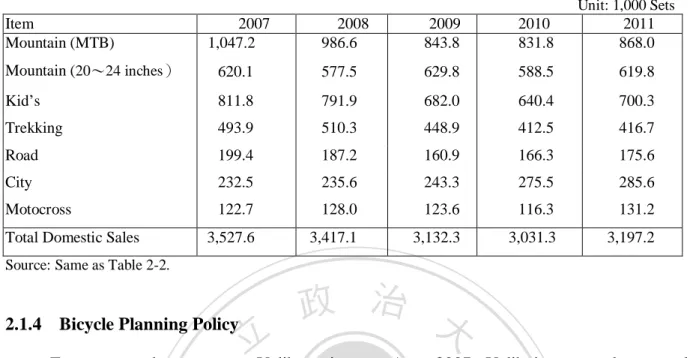
(14) had gone slightly down 4% than the year 2000, but the turnover of 2011 rose for 29% than that of 2000. The average selling price of bicycle sales in 2011 in France is EUR265, ranking 12th right after 11th-ranked Italy (COLIBI-COLIPED, 2012). The bicycle price, EUR265 in 2011, was 6% higher than the price EUR248 in 2007 (Table 2-4).. Table 2-3 Bicycles Sales in France Sales Volume. 2000. 2001. 2002 2003. 2004 2005 2006 2007 2008. 2009. 2010 2011. 334. 295. 299. 353. 352. 376. 347. 347. 334 313.2 303.1. 320. 654. 708. 732. 857. 851. 869. 794. 842. 850 819. 846. (10,000 Sets). Sales Value (Million Euro). 794. Source: Same as Table 2-1.. 政 治 大 Table 2-4 Average Selling Price per Cycle in France 立 2007 2008 2009 2010. ‧ 國. 248. 262. 學. Average Price (Euro/Set) Source: Same as Table 2-2.. 261. 262. 2011 265. ‧. 2.1.3 Sales of Bicycles by Category. Nat. sit. y. In the categories of bicycle as shown in Table 2-5 Mountain Bicycle (MTB) is the most. al. er. io. popular in France, and then Kid’s bike. The sales of whole categories of bicycles were up in. n. 2011. Kid’s bike had 9.4% up to 700,300 units in 2011. Bicycle Motocross or BMX is a bicycle. Ch. i n U. v. for a racing in motocross styles. It comes with a variety of specifications catering to the. engchi. numerous different BMX events from dirt track racing to the more artistic freestyle competitions. This is the only item which enjoyed the up-rising sales from 2007 to 2011, except for the year 2010. In 2009 sales on kid’s bikes, trekking bikes, and city bikes were all retreated over 10% in comparison with 2010 except for MTB and BMX. The bicycle market in France seemed not be effected by electric bicycles’ introduced to the market. Indifferent with Germany and Netherlands’ markets, the sales of sports and city bikes remained strong hold and folding bike was popular and enjoyed higher value in the market (COLIBI-COLIPED, 2012).. 7.
(15) Table 2-5 Sales of Bicycles by Category in France Item Mountain (MTB). 2007 1,047.2. 2008 986.6. 2009 843.8. 2010 831.8. Unit: 1,000 Sets 2011 868.0. Mountain (20~24 inches). 620.1. 577.5. 629.8. 588.5. 619.8. Kid’s. 811.8. 791.9. 682.0. 640.4. 700.3. Trekking. 493.9. 510.3. 448.9. 412.5. 416.7. Road. 199.4. 187.2. 160.9. 166.3. 175.6. City. 232.5. 235.6. 243.3. 275.5. 285.6. Motocross. 122.7. 128.0. 123.6. 116.3. 131.2. 3,527.6. 3,417.1. 3,132.3. 3,031.3. 3,197.2. Total Domestic Sales Source: Same as Table 2-2.. 2.1.4 Bicycle Planning Policy. 立. 政 治 大. France started to promote Velib project on Aug. 2007. Velib is to supplement other. ‧ 國. 學. methods of public transport and provide free bikes for citizens and tourists. After registering to use the system and paying a small fee, the registrar can borrow a bicycle from any station and. ‧. return it to any other station. In order to fight against traffic congestion and air-pollution the. y. Nat. Paris city council and outdoor advertiser JCDecaux cooperated and created a successful rental. sit. system that is regarded as the showcase to get more people biking. The bikers in Paris have. n. al. accounts for 2 to 3% of all traffic in Paris (Schaik, 2008).. Ch. engchi. er. io. increased by 94% during 2000 to 2007 while car traffic has dropped 20%. In 2008 the bike. i n U. v. 2.2 Bicycle Industry in Germany According to a analysis from European Cyclists’ Federation, Germany’s new national cycle master plan can promote annual sales by 260 million Euro by 2020. The report represented an average increase of 2.43 bikes sold per head of population for each percentage increase in people using bicycles as main mode of transport in EU27. It is also shown that a 13 Euro increase in the unit price per bike was accompanied with each percentage increase in bicycle share. This means if Germany market follows the bicycle sharing trend, Germany can expect an additional 800,000 bike sales and an increased price of 53 Euro per bike across the larger market. 8.
(16) of nearly 5 million bikes. France is promoting cycle usage higher and higher in the modal share and modal shift by adopting constructing cycle-friendly environment policies (Mayne, 2012).. 2.2.1 Production and Sales of Bicycle Bicycle production in Germany in 2011 was 2.2 million sets and its share of EU27 was 19.46% ranked after first Italy, 2.3 million unit sharing19.65% of EU27 market. The sales of bicycles in Germany in 2011 were 4.05 million sets, ranked top1, sharing 20% of EU27 market. The average selling price of bicycle in Germany in 2011 was 495 Euro per unit (Table 2-6), ranked top 2 right after the Netherlands 746 Euro (COLIBI-COLIPED, 2012). The production in 2011 was 2.28 million sets, 1.78% less than 2.22 million sets in 2010,. 政 治 大 4.05 million sets, 1% higher than 4 million sets in 2010, and 21% less than 5.1 million sets in 立 2000. The sale in value in 2011 was 2,004 million Euro, 8% higher than 1,842 million Euro in and 32.7% less than that in 2000. As presented in Table 2-6, the sales of bicycles in 2011 was. ‧ 國. 學. 2010. The quantity in 2011 was 21% less than that in 2000, but the value was 13% higher than that in 2000. The same situation happened in 2009 and 2010 in which the production and sales. ‧. were down but the turnover went up instead (Table 2-6). This may be accounted to the rising. y. sit. io. n. al. er. than 386 Euro in 2008.. Nat. price of bicycles. The average price per cycle in Germany in 2009 was 446 Euro, 15% higher. i n U. v. Table 2-6 Bicycle Production and Sales in Germany 2000. 2001. Production 340 300 (10,000 Sets) Sales Volume 512 470 (10,000 Sets) Sales Value 1,772 1,697 (Million Euro) Source: Same as Table 2-1.. 2002. Ch 2003. e2004 hi n g c2005. 2006. 2007. 2008. 2009. 2010. 2011. 305. 320. 294. 271. 249. 240. 242. 225. 223. 229. 460. 490. 470. 475. 443. 460. 435. 405. 401. 405. 1,624 1,686 1,603 1,620 1,542 1,688 1,679 1,806 1,842 2,004. Table 2-7 Average Selling Price per Cycle in Germany. Average Price. 2007. 2008. 2009. 2010. Unit: Euro 2011. 368. 386. 446. 460. 495. Source: JBPI (2012b).. 9.
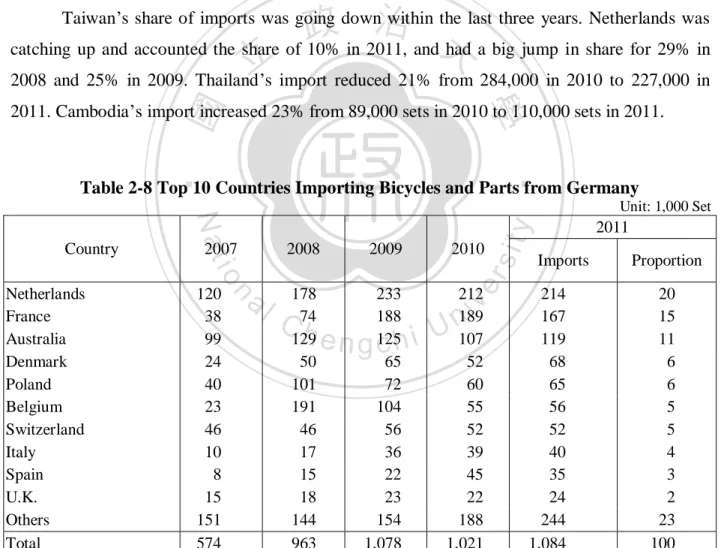
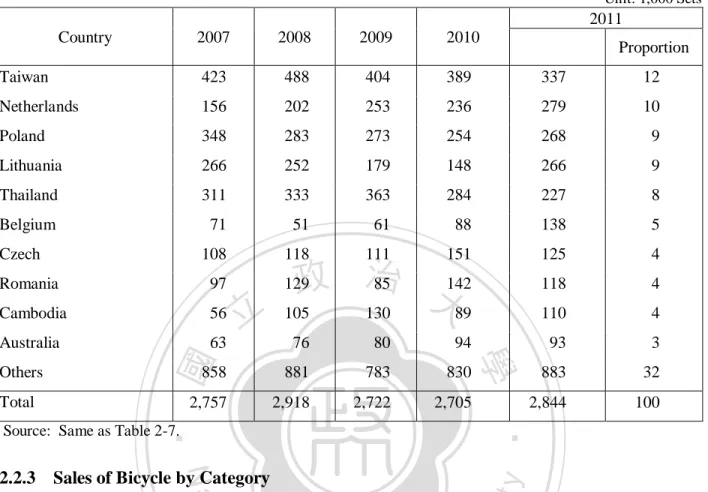
(17) 2.2.2 Exports and Imports of Bicycle Netherlands had been the biggest importer for Germany bicycles. The share of the volume in 2011 was 20% of Germany’s total exports, as displayed in Table 2-8. France imported 15%, to 167,000 units in 2011, Australia 11% to 119,000 units, and Denmark 6%. These five countries accounted over 50% of exports of Germany in 2011. The total imports in 2011 were 1,084,000 units, 47% of total production in Germany in 2011 and it was 6% higher than the exports in 2010. The exports in Germany in 2011 grew 89% within 5 years while the imports into Germany in 2007 grew only 3% within 5 years. As exhibited in Table 2-9, Taiwan has been the number one exporter for Germany bicycles, accounting 12% of imports in 2011. Taiwan’s imports in 2011 were 13% down than that in 2010.. 政 治 大 catching up and accounted the share of 10% in 2011, and had a big jump in share for 29% in 立 2008 and 25% in 2009. Thailand’s import reduced 21% from 284,000 in 2010 to 227,000 in Taiwan’s share of imports was going down within the last three years. Netherlands was. ‧ 國. 學. 2011. Cambodia’s import increased 23% from 89,000 sets in 2010 to 110,000 sets in 2011.. ‧. Table 2-8 Top 10 Countries Importing Bicycles and Parts from Germany. al. n. 120 38 99 24 40 23 46 10 8 15 151 574. 2009. 2010. 178 74 129 50 101 191 46 17 15 18 144 963. 233 188 125 65 72 104 56 36 22 23 154 1,078. 212 189 107 52 60 55 52 39 45 22 188 1,021. Ch. engchi U. 10. sit. 2008. er. 2007. io Netherlands France Australia Denmark Poland Belgium Switzerland Italy Spain U.K. Others Total Source: Same as Table 2-7.. y. Nat. Country. v ni. Unit: 1,000 Set. 2011 Imports. 214 167 119 68 65 56 52 40 35 24 244 1,084. Proportion 20 15 11 6 6 5 5 4 3 2 23 100.
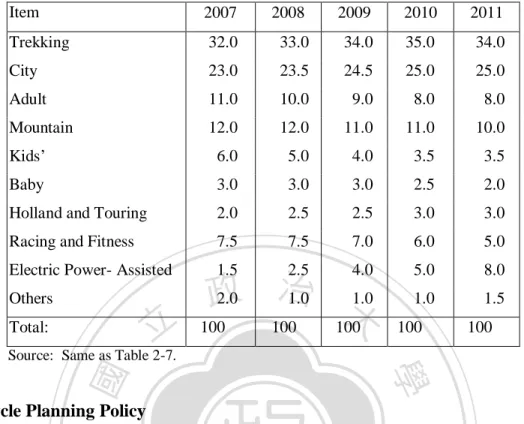
(18) Table 2-9 Top 10 Countries Exporting Bicycles and Parts to Germany Unit: 1,000 Sets. 2011 Country. 2007. 2008. 2009. 2010. Taiwan. 423. 488. 404. 389. 337. 12. Netherlands. 156. 202. 253. 236. 279. 10. Poland. 348. 283. 273. 254. 268. 9. Lithuania. 266. 252. 179. 148. 266. 9. Thailand. 311. 333. 363. 284. 227. 8. Belgium. 71. 51. 61. 88. 138. 5. 108. 118. 111. 151. 125. 4. Romania. 97. 129. 118. 4. Cambodia. 56. 110. 4. Australia. 63. 93. 3. 85 142 政 治 大 105 130 89. 立. 80. 94. Others. 858. 881. 783. 830. 883. 32. Total. 2,757. 2,918. 2,722. 2,705. 2,844. 100. 學. 76. ‧. ‧ 國. Czech. Proportion. Source: Same as Table 2-7.. Nat. sit. y. 2.2.3 Sales of Bicycle by Category. io. er. Trekking in Germany is the most popular item, unlike France, where the MTB is the most popular. The shares of trekking and city bikes were over 50% of total domestic market as shown. n. al. Ch. i n U. v. in Table 2-10. The share of Kids’ bicycles decreased only 1%, from 6% in 2007 to 5% in 2011.. engchi. Racing and Fitness bikes were losing their market share as well from 7.5% in 2007 to 5% in 2011. Electric Power Assisted Cycle (EPAC) is the only item which enjoyed the expanding market from 1.5% in 2007 to 8% in 2011. The transporting bikes, such as Trekking, City and Touring bikes have their steadily increasing market share, which may be attributed to their function different with others. The 2011 bicycle park in Germany has risen by 1 million units to a total 70 million units (COLIBICOLIPED, 2012).. 11.
(19) Table 2-10 Proportion of Sales of Cycles by Category in Germany Unit: %. Item. 2007. 2008. 2009. 2010. 2011. Trekking. 32.0. 33.0. 34.0. 35.0. 34.0. City. 23.0. 23.5. 24.5. 25.0. 25.0. Adult. 11.0. 10.0. 9.0. 8.0. 8.0. Mountain. 12.0. 12.0. 11.0. 11.0. 10.0. Kids’. 6.0. 5.0. 4.0. 3.5. 3.5. Baby. 3.0. 3.0. 3.0. 2.5. 2.0. Holland and Touring. 2.0. 2.5. 2.5. 3.0. 3.0. Racing and Fitness. 7.5. 7.5. 7.0. 6.0. 5.0. Electric Power- Assisted. 1.5. 2.5. 4.0. 5.0. 8.0. 1.0. 1.5. Others. 立. Total:. 治 政 2.0 1.0 1.0 大 100 100 100. 100. 100. Source: Same as Table 2-7.. ‧ 國. 學. 2.2.4 Bicycle Planning Policy. ‧. Bicycle sharing systems is a form of bicycle sharing that is available in numerous cities. y. Nat. in Europe. The system makes public bicycles accessible to people, with numerous pick-up and. sit. drop-off points, available to the general public for short-term uses for free or for a small fee.. er. io. Municipal governments and community groups have promoted bicycle sharing systems as part of. al. n. v i n C hin Germany was U again. In 1999, the biggest bicycle station e n g c h i opened in Münster.. intermodal transportation by allowing people to shift easily from transit to bicycle and back. Around seven million EUR were invested in this structure, with a capacity of 3,300. parking spots (Linden, 2011) . These parking spots are set next or near the train station for passengers to make a shift from train to bicycle. Germany has 70 million pieces bicycle park by 2012 (COLIBI-COLIPED, 2012).. 2.3 Bicycle Industry in Italy Derailleurs on bicycles play the function of a heart in a bicycle the same as an engine of cars. Italian Campagnolo is a world-known manufacturer that invented derailleurs, competing with the counterparts, Japanese Shimano, and a Chicago company, SRAM. These three component manufactures dominate the gear transmission system of bicycles in the global 12.
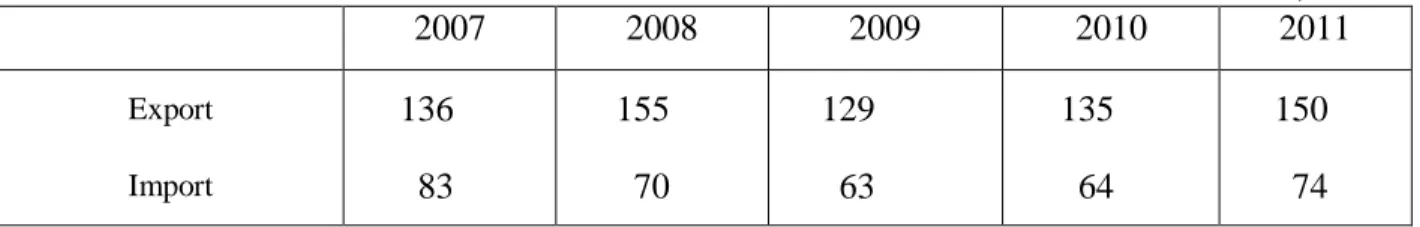
(20) markets. Italy, as the third largest in EU27, imports less than Germany and France but production is the highest in EU27.. 2.3.1 Production and Sales of Bicycle The production of bicycle in Italy In 2011 was 2,310,000, which topped the first in EU27 (COLIBI-COLIPED, 2012), but the quantity of 2011 was 29% less than that of 2000 as exhibited in Table 2-11. Its sales in 2007 were 1,998,000 sets, 2.83% less than 2,418,000 sets in 2006 but the value went up 27.5% than the sales in 2006. This was induced by high bicycle price in 2007. According to ANCMA (Table 2-11) the sales price of bicycles in 2007 was in high position EUR 320 but from 2007 the price did not stop its decreasing trend. The price was going down 18% to. 政 治 大. 260 Euro in 2011.. 立. 2.3.2 Exports and Imports of Bicycle. ‧ 國. 學. From the data of import, Italy imported the least compared to France and Germany since Italy produced more for its home market (COLIBI-COLIPED, 2012). The export of 2011 was. ‧. 1,500,000, 11% higher than 1,350,000 of 2010. The highest export volumes was in 2008,. y. Nat. 1,550,000 sets, which dropped 16% to 1,290,000 sets in 2009 and increased 5% to1,350,000 sets. sit. in 2010. The import in 2008 decreased 11% to 630,000 and increased 1.5% to 640,000 sets in. n. al. er. io. 2010. The import of 2010 increased 16% to 740,000 units in 2011(Table 2-13).. Ch. engchi. i n U. v. Table 2-11 Production and Sales of Bicycle in Italy. Production(10,000 sets) Sales Volume (10,000 Sets). Sales Value (Million Euro). 2000. 2001. 2002. 2003 2004 2005. 2006. 2007 2008 2009 2010 2011. 325. 265. 235. 255. 260. 240. 242. 252. 238. 259. 249. 231. 172. 168. 138. 142. 167. 188. 194. 200. 178. 193. 177. 175. 520. 442. 302. 306. 331. 360. 375. 478. 516. 539. 460. 455. Source: Same as Table 2-1.. Table 2-12 Average Selling Price per Cycle in Italy Unit: Euro. Average Price. 2007 320. 2008 290. Source: JBPI (2012c).. 13. 2009 280. 2010 260. 2011 260.
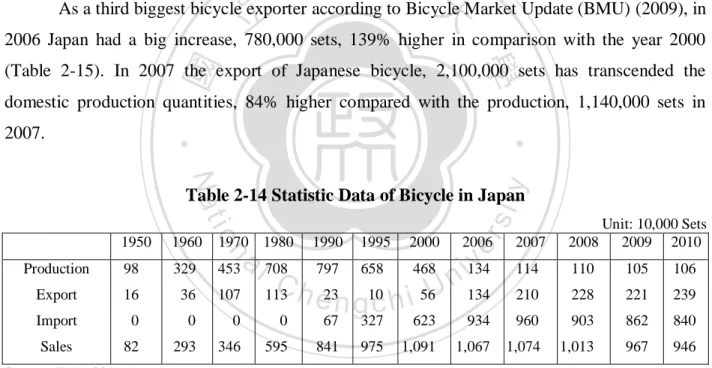
(21) Table 2-13 Exports and Imports of Bicycle in Italy Unit: 10,000 sets. 2007. 2008. 2009. 2010. 2011. Export. 136. 155. 129. 135. 150. Import. 83. 70. 63. 64. 74. Source: Same as Table 2-12.. 2.3.3 Bicycle Planning Policy Bologna, in Italy, has a separated bike lane, suitable for the bicycle, this ecological and quiet means of transport. According to the report of Japan Bicycle Usage Promotion Study Group, in 1989 the whole old streets area in Bologna prohibits car entering the area except for. 政 治 大 successfully reduced 62% of car-entering 立 rate in the area.. the public buses, taxies, private cars of the local shops or hotels from 7:00 to 20:00 per day. This. ‧ 國. 學. Bicincitta is a wild bicycle sharing system used in Italy. Bicin are two words represented as “Bicycle” and “ in (English)” and Citta is interpreted as “town” (Kobayashi, 2009) Exemplified in a report by Kobayashi (2009), Cueno in Torino was the first town to establish. ‧. such system, which provides five bicycle stations,70 bicycle stands, 50 bicycles for free. This. sit. y. Nat. service is highly welcomed because it avoids traffic congestion in a busy city center while the public transports are inefficient. The system can be used free from 7:00 to 21:00 under the. io. n. al. er. guarantee of the already registered users. The latest statistics displayed that Bicincitta has more. i n U. v. than 2660 bicycle posts and the pass-owners has reached to over 14,768 members.. Ch. engchi. 2.4 Bicycle Industry in Japan In 2004 Bicycle Association (Japan) had set up safety standards, bicycle Association Approved (BAA), combining with safety standards of Germany and France to offer the consumers safety warranty. There were 39 companies applied for the recognition and Bicycle Association (Japan) had approved more than 280 models of bicycles and issued 75 hundred thousand certifications (Shi et al., 2005). Local production increased for the last decade, but this didn’t include the production of electric power assisted cycle, which accounted 32% of total national production in 2010.. 14.
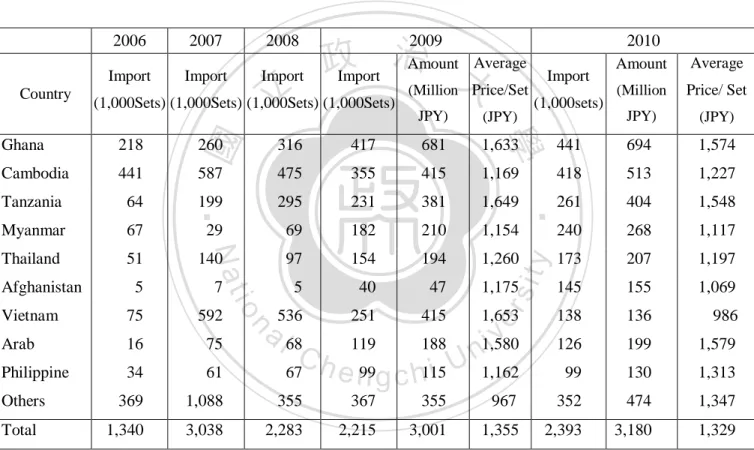
(22) 2.4.1 Production, Export, Import, and Domestic Sales of Bicycle The production of bicycles in Japan had been facing the severe competition from imports from China and multi-national bicycle companies which moved the production line to China, appreciating Japanese yen and lifted customs duties on bicycles imports for the last three decades. According to Japan Bicycle Promotion Institute (JBPI), Japanese production of bicycle in 1973reached the peak, 9,410,000 and dropped down insistently to 1,060,000 of the year 2010 (Table 2-14). Japan was world top 4 bicycle producer before 2007 (COLIBI-COLIPED, 2012). The production 1,060,000 sets in 2010 still went down 7% compared with 1,140,000 sets in 200. From 2007 to 2010, the production of electric power assisted cycle grew fastest, from 248,000 sets, 21.8% share of total production in2007 to 336,000 sets, 32% share of total production in. 政 治 大 As a third biggest bicycle exporter according to Bicycle Market Update (BMU) (2009), in 立 2006 Japan had a big increase, 780,000 sets, 139% higher in comparison with the year 2000 2010 (JBPI, 2012f).. ‧ 國. 學. (Table 2-15). In 2007 the export of Japanese bicycle, 2,100,000 sets has transcended the domestic production quantities, 84% higher compared with the production, 1,140,000 sets in. ‧. 2007.. y. Nat. 98. 329. Export. 16. 36. Import. 0. 0. Sales. 82. 293. 1990. 1995. 2000. er. Production. 1970 1980. 2006. a l 708 797 658 468 i134 v n C 107 113 h e23 n g10c h i 56U 134 n. 1960. io. 1950. sit. Table 2-14 Statistic Data of Bicycle in Japan. 453. Unit: 10,000 Sets 2009 2010. 2007. 2008. 114. 110. 105. 106. 210. 228. 221. 239. 0. 0. 67. 327. 623. 934. 960. 903. 862. 840. 346. 595. 841. 975. 1,091. 1,067. 1,074. 1,013. 967. 946. Source: JBPI (2011a).. The export in 2010 went 13.8% higher than the export in 2007. According to the report of JBPI in 2010, this increase was due to export of second bicycles to Asian countries and Africa. Ghana is the biggest importer of Japanese bicycles, the share of which reached 18% of total quantity and 21% in value of Japan’s export. Cambodia is the second biggest importer, the share of which held 17% of total quantity, 16% in value of Japan’s export. Both Tanzania and. 15.
(23) Myanmar followed separately with around 10% of total quantity (Table 2-15). The share of Africa countries occupied 30% and Asian accounted 70% of the total exports in 2010. China is the biggest bicycle exporter to Japan, the share of which held 93% and Taiwan followed China with share of 3% (BMU, 2009). The sum of the other exporters was not over 1%. The imports began its escalating trend from 1990, with quantity of 60,000,000 to the quantity of 9,600,000 in 2007. City bicycles are the most popular type, the share of which held 42% of total imports.. Table 2-15 Countries Importing Bicycles from Japan. Country. 2006. 2007. 2008. Import. Import. Import. 立. 2009 治 Amount Average 政 Import 大 (Million Price/Set. 64. Myanmar. 67. Thailand. 51 5. (JPY). 316. 417. 681. 1,633. 441. 694. 1,574. 587. 475. 355. 415. 1,169. 418. 513. 1,227. 199. 295. 231. 381. 1,649. 261. 404. 1,548. 29. 69. 182. 210. 1,154. 240. 268. 1,117. 140. 97. 154. 194. 1,260. 173. 207. 1,197. 7. 5. 40. 47. 1,175. 145. 155. 1,069. 536. 251. 415. 1,653. 138. 136. 986. 126. 199. 1,579. 99. 130. 1,313. io. 260. ‧. Afghanistan. JPY). y. Tanzania. Price/ Set. sit. 441. (Million. er. Cambodia. (JPY). 學. 218. JPY). (1,000sets). Average. Nat. Ghana. ‧ 國. (1,000Sets) (1,000Sets) (1,000Sets) (1,000Sets). Import. 2010 Amount. Vietnam. 75. 592. Arab. 16. 75. Philippine. 34. 61. 369. 1,088. 355. 367. 355. 967. 352. 474. 1,347. 1,340. 3,038. 2,283. 2,215. 3,001. 1,355. 2,393. 3,180. 1,329. Total. n. Others. a l 68 Ch 67. iv 119 188 1,580 n i U 1,162 e n99g c h115. Source: Same as Table 2-14.. The domestic sales in 2007 reached its peak, following its trend of imports, and started going down.1 City bicycles are the most popular type, the share of which held 42% of domestic sales in Japan. From 2007 to 2010, the sales of electric power assisted cycle grew fastest, from 248,000 sets, 21.8% share of domestic market in2007 to 336,000 sets, 32% share of home market ________________________ 1. The sales quantity is a sum of complete bicycle quantities of both domestic production and imports.. 16.
(24) in 2010 (JBPI, 2011a). However, the total sales in 2010 reduced 12% in comparison with the year 2007 (Table 2-14). 2.4.2 Bicycle Planning Policy Making cycling as a major mode of urban transport system for a short distance, there should be enough space for cycling in urban areas. In addition, accidents involving bicycles are accounting for an increasing percentage of all traffic accidents. Therefore, it is necessary to enhance creating safe and comfortable environment for cycling. In cooperation with National Police Agency, Ministry of Land, Infrastructure, The Japanese government has designated 98 areas as “Bicycle-Friendly Model Areas” in which efforts to improve bicycle-friendly. 政 治 大. environment are concentrated. As for development of cycling space, the measures are employed in consideration of traffic condition; such as creating bicycle paths; separating bicycle lanes from. 立. travel lanes, and permitting cycling on sidewalks (marking bicycle lanes in the sidewalks).. ‧ 國. 學. According to a census in 1999 made by Ministry of Land, Infrastructure, Transport and Tourism of Japan, more than 40% of private cars moved not more than 5 kilometers, and around. ‧. 24% moved around 5-10 kilometers, which means the share of car moving less than 10 kilometers was more than 60%. This was assumed inefficient oil consumption while evaluating if. y. Nat. sit. it is efficient that the driver moves a 1 ton weighted car in order to move himself alone to some. er. io. places within 5 kilometers away, not to mention the waste of gasoline keeping car waiting in the. al. v i n C h a bicycle for 8 kilometers Planners) in 2006 the time spent in riding from Tokyo to Toranomon engchi U n. traffic jam. In a experiment made by NPOJSURP ( Japan Society of Urban and Regional. (虎ノ門) is 25 minutes compared to 30 minutes by taking a taxi for a cost of 2980 yen. Bicycles seem to be a healthy and efficient way to alter citizens’ habits of using transportation.. 2.5 Bicycle Industry in Taiwan In 1980s many Taiwan bicycle manufactures moved factories to China due to high cost of labor and appreciating Taiwan dollars. A-Team’s establishment initiated by Giant to integrating branded Taiwanese bicycles enterprises, Taiwan bicycle manufactures have been dedicating in innovation on bicycle’s design, materials and market. The average price per bicycle of home market escalated 300% from NTD3, 185 in 2000 to NTD9,990 in 2009. The ratio of home. 17.
(25) market revenue had risen 9.9% by middle of 2009 comparing to 2.7%, the ratio of export and home sales in 2005 (Wang, 2009).. 2.5.1 Production, Export, Import, and Domestic Sales of Bicycle Taiwanese Bicycle industry has following characteristics (Shi et al., 2005). All the following characteristics can be found in the bicycle industry in Taiwan, and even in China. 1. Tight interdependence among upstream, midstream, and downstream manufactures. 2. Bicycles need more than 2000 parts to assemble a complete bicycle. 3. Bicycle is export-oriented industry and is subject to overseas market. 4. The material of bicycle is the lion share of cost and the development and innovation. 政 治 大 5. Overseas market is subjective to global economic and seasonal impact. 立 6. The usage and modes of bicycle are different in cities or countries.. of the material is vital to success of the business.. ‧ 國. 學. 7. Bicycle industry is upgrading into a high-tech industry.. ‧. Looking back global bicycle industry developments, it progressed for three stages of spatial transferring. The first stage it transferred from Western countries to Asia, or Japan; in the. Nat. sit. y. second stage it moved from Japan toward Taiwan; the third stage is relayed from Taiwan to. io. er. China. In mainland China, the bicycle industry geographic transforming started from Pearl River Delta, then Yangtze River Delta and finally to Bohai-rim region (Zhang, 1992).. n. al. i n U. v. As China’s infrastructure develops, many smaller coastal cities, which is closer to the. Ch. engchi. ports and have skilled labors, will be the priority for sourcing. To Taiwanese enterprises, Shenzhen was the first choice for most Taiwanese bicycle firms. Without noticing Giant Taiwan for cancelling orders, Schewinn, whose order accounted 75% of Giant’s total orders, invested with Hong Kong companies to set production line in Shenzhen (Xu, 2009). Poured in foreign and Taiwanese capitals and technique in Southern China bicycle industry, the bicycle industry clusters gained its solid ground in the area. The sales of Taiwanese bicycle in value in 2007 had increased 24%, to 41,252 million in comparison with the year 2006, contributed to high-rising oil price. The turnover in 2008 continued increasing 34% to 55,417 million. The oil price went down in the middle of 2008, but due to the unpaid leave forced by the enterprises the trend people take a trip by bicycle are 18.
(26) getting more and more popular. The statistics accounted 741,000 workers in Taiwan took unpaid leave in November, 2008.2 The ratio of home market revenue had risen 9.9% by middle of 2009 (Wang, 2009). This has accelerated the selling of high-end bicycles in domestic market. As displayed in Table 2-16, the import of high-end bicycles from Italy or Germany in 2006 grew 23% to 575 million in 2007 and 180% in 2008 to 1,610 million. Although the oil price was not in high position as it was in 2007 and 2008, the import in 2009 still grew 49% to 2,398 million. The home market sales, 5,431 million in 2008 increased 27%, and in 2008 it rose 111% to 11,464 million. The export revenue 36,396 million in 2007 increased 24% to 45,563 million in 2008 but decreased 10% to 41,171 million in 2009.. 政 治 大. Table 2-16 Statistic Data of Bicycle in Taiwan. 立 2005 Export. 575. 1,610. 2,398. 29,431. 36,396. 45,563. 41,171. 4,265. 5,431. 36,482 670. 466. 31,719 5,433. ‧. Home Market Sales*. Unit: Million NTD 2009 (Jan.- Jun.) 51,322. 2007 41,252. 學. Import. ‧ 國. Sales Value. 2008 55,417. 2006 33,230. 11,464. io. sit. y. Nat. Note: *Home Market Sales= Sales + Import –Export. Source: Wang (2009).. 12,549. n. al. er. As presented in Table 2-17, China and Vietnam had been the first and second biggest. i n U. v. exporters for Taiwan. Germany, Italy, UK and USA are exporters of high end bicycles and. Ch. engchi. bicycles parts. China accounted over 90% of all imports to Taiwan from 2007 to 2009. China announced 9% export tax refund in December 2008 and kept its export-encouraging tax policies to increase 15% tax refund in June 2009 (Wang, 2009) , to accelerate China’s lagged economic. This can account to two effects to Taiwan bicycle industry. One is to push the China’s cheap bicycles exported to Taiwan, and the other is to reduce Taiwan’s competitiveness of exporting to other countries. Regarding countries which import Taiwanese bicycles, European countries account the ________________________ 2. The statistics showed that as a result of the unpaid leave practice, 741,000 people worked less than 35 hours per. week, http://www.coolloud.org.tw/node/32596.. 19.
(27) the biggest share, over 50% of total Taiwan’s bicycle exports; Northern American countries accounted over 25%, Japan around 10% and the rest of Asian countries took around 15%. As shown in Table 2-18, USA imported the most from Taiwan, which imported over 20% but the share is decreasing.. Table 2-17 Proportion of Top 5 Countries Exporting Bicycle and Parts to Taiwan Rank 2005 China(71.54) 1 Vietnam(23.85) 2 Germany(2.09) 3. 2006 China(88.24) Vietnam(8.30) USA(1.08). Italy(0.88) Italy(0.92) USA(0.62) Germany(0.51) 5 Source: Same as Table 2-16. 4. 2007 China(92.54) Vietnam(2.50) Italy(1.37). 2008 China(92.32) UK(1.74) Germany(1.40). Unit: % 2009(Jan.-June) China(92.28) UK(1.60) Italy(1.34). USA(1.33) Others(0.67). USA(1.27) Others(0.95). USA(0.93) Cambodia(0.8). 政 治 大. 立. Netherland(9.53). UK(12.02). UK(11.13). Germany(10.09). Netherland(9.29). Netherland(10.54). Germany(9.84). Netherland(9.78). Germany (8.63). Germany(8.82). Netherland( 9.74). Japan(8.28). Belgium(5.53). Belgium(5.70). UK(7.54). io. Belgium(7.95) Belgium(6.19) 5 Source: Same as Table 2-16.. n. al. y. 4. UK(11.54). sit. UK(9.54). 2008 USA(21.80). er. 3. 2007 USA(22.06). ‧. Germany(9.70). Unit: % 2009 (Jan.- June) USA(22.89). 2006 USA(24.30). Nat. 2. 學. Rank 2005 USA(27.30) 1. ‧ 國. Table 2-18 Proportion of Top 5 Countries Importing Bicycle and Parts from Taiwan. Ch. engchi. i n U. v. From 2006-2008, the share of the UK’s imports was around 10%, ranked second position. Germany ranked the second in 2005 and 2009. Netherland and Belgium have also been on the top five counties list. Taiwan’s average price of exported bicycle had been NTD 7,340 in 2005, gone down a little in 2006 and then taken the up-rising trend to the highest point, NTD 9,990 in 2009 (Wang, 2009). Manufacturing bicycles can be divided into two parts. One is to assembly the whole parts into a complete bicycle. Mostly these kinds of factories, such as Giant, Merida, or Idea made the frame and coating by themselves according to customers’ needs. The other one is to manufacture bicycle parts, such as transmission gear producer Japanese Shimano or American SRAM or Taiwanese Sun Race. Assembly factory is a labor intensive work since it is hard to automatically assemble 20.
(28) 2000 different parts into a bicycle. It is not hard for new competitors entering the parts manufacturing business, either. The evidence could be seen from the number of bicycle factories grew from 255 in 1966 to 1307 in 1991. The average employees did not exceed over 30 in the period. Each component factory supplies about 20 complete bicycle factories while each complete bicycle factories had around 60 component suppliers (Chu, 1997). This was one reason why Taiwanese factories moved the factories to China looking for cheap labor and land to be more competitive in price. Taiwan had been a biggest bicycle producer in the world so Taiwan imported less and exported more complete bicycles. Taiwan’s imported complete bicycles accounted total imports of 3.7% and imported bicycle parts accounted 96% in 2004. Impacted by high oil price effect,. 政 治 大 2007, NTD575 dollars, 2008, NTD1.6 billion dollars to 2009, NTD2.4 billion (Shi et al., 2005). 立 The following list is the list for bicycle parts Table 2-19. Taiwan and China are both high end bicycles requirement increases, the imports of bicycles and parts were increasing from. ‧ 國. 學. export-driven economies. The exports of complete bicycle are over 90% for both countries. The three main imported parts systems in Taiwan are frames, brakes, and transmission. In 2004. ‧. imports of frames and forks were NTD3.5 billion, 28.8% of total imports, and imports of. y. Nat. transmission, such as derailleur and shift levers, were NTD1.9 billion, 19.5 of total imports. The. er. io. sit. total imports of frames, brakes, and transmission systems took more than 60% of total.. al. n. v i n Top Tube; Down Tube;C Seat U Stay. hTube; i Chain e n gSeatcStay; h Spokes; Hub; Rim; Tire, Valve. Table 2-19 List of Bicycle Parts. Frame Wheels. and. Tires Transmission. Crankset and Pedals; Chain; Freewheel; Cogsets; Derailleur and Shift Levers. (Drivetrain) Steering. Handlebars; Stem; Saddles; Seat Post; Handlebar Grip; Head Tube; Shock Absorber; Front Brakes; Fork.. Accessories. Kickstands; Baskets; Luggage Carriers; Child Seat; Clipless Pedals; Toe-Clips; Lights; Reflectors; Security Locks; Mirrors; Water Bottles and Cage; Bell.. Source: Shi et al. (2005).. 21.
(29) Table 2-20 Top 5 Countries Exporting Bicycle Parts to Taiwan. Wheel and Tire. France Malaysia China Japan Switzerland. Total:. Brake. Total:. io. n. al. 治 政 Japan 大 Malaysia USA China Germany Japan China Malaysia Singapore France China Italy Vietnam Germany Indonesia. Ch. engchi. China Germany Japan France Netherlands. China USA Italy Vietnam Japan China Malaysia France Japan Switzerland Japan Malaysia China USA Germany Japan Malaysia China Singapore Italy. ‧. Nat. Japan China Transmission Singapore Malaysia Indonesia Total: China Italy Steering Vietnam Indonesia Japan Total: China Germany Accessories Japan France Netherlands Total: Source: Same as Table 2-19.. 立. Malaysia France China Japan Switzerland. 學. Japan Malaysia USA China Germany. China USA Italy Vietnam Germany. Country. y. Total:. Country. sit. Frame. 1,651 719 90 21 9 2,490 297 251 220 119 50 937 670 148 119 113 47 1,097 1396 378 254 228 23 2,279 376 55 13 5 3 452 23 5 4 3 2 37. Proportion (%)* 66.3 28.9 3.6 0.8 0.3 100.0 31.7 26.8 23.5 12.7 5.4 100.0 61.0 13.5 10.9 10.3 4.3 100.0 61.2 16.6 11.1. 10.0 1.0 100.0 83.2 12.1 2.9 1.1 0.6 100.0 62.6 13.9 10.1 8.7 4.6 100.0. 2003 Export Proportion (%) 2,044 73.2 578 20.7 97 3.5 51 1.8 24 0.9 2,794 100.0 294 27.3 285 26.4 245 22.8 184 17.1 70 6.5 1,078 100.0 1,104 70.5 190 12.1 130 8.3 82 5.2 60 3.8 1,566 100.0 1,898 66.0 359 12.5 335 11.6 267 9.3 19 0.7 2,878 100.0 383 83.5 57 12.4 12 2.6 4 0.9 3 0.6 459 100.0 26 45.1 21 36.8 5 9.3 4 7.6 1 1.2 57 100.0. er. China USA Italy Germany UK. ‧ 國. Country. 2002 Export. i n U. v. China Italy Vietnam USA Germany China Germany France Japan Netherlands. Unit: Million NTD 2004 Export Proportion (%) 2,856 77.6 612 16.6 133 3.6 51 1.4 30 0.8 3,682 100.0 530 33.5 377 23.9 370 23.4 198 12.5 106 6.7 1,581 100.0 1,566 72.7 241 11.2 152 7.0 113 5.3 83 3.9 2,155 100.0 2,527 67.9 439 11.8 438 11.8 289 7.8 29 0.8 3,722 100.0 451 79.2 90 15.8 19 3.3 5 0.8 4 0.8 569 100.0 33 53.9 17 28.8 5 8.5 5 8.1 0 0.6 60 100.0. Taiwan imports frames and forks mostly from the US due to the US’s high advance material technology. The enterprises in the US have moved the production lines to China so the imports from China were increasing. As shown in Table 2-20, China has replaced the US to be the top 1 exporter of frames to Taiwan during 2002-2004. The ratio of exported China’s frames 22.
(30) accounted from 66.3% in 2002 to 77.6% in 2004. The US ranked the second. The exported frames from the US were reducing from 28.9% in 2002 to 16.6% in 2004. China was also the top 1 exporter of steering systems and accessories to Taiwan (Shi et al., 2005). In terms of brake and transmission systems, Japan holds oligopoly market. Taiwan imported brakes system NT670 million, 61% of total imports of brake products in 2002 and NT1.56 billion, 72.7% in 2004; The transmission systems, such as Shimano’s derailleur and shift levers had been exported to Taiwan NT1.39 billion, 61.2% of total imports of transmission products in 2002, increased to NT2.52 billion, 67.9% of total imports of transmission products (Table 2-20). In respect of wheels and tires, China overcame France and Malaysia took the number one. 政 治 大 33.5% of total imports of wheels and tires, an increase of 9% comparing to the imports in 2003. 立 This increase may be attributed to Taiwanese wheels manufactures which established production position in 2005. The imports of wheels and tires from China was NT530 million, accounting. ‧ 國. 學. lines in China. In respect of steering systems, China and Italy took the first and second position, with share of 79% and 15.8% respectively in 2004. Regarding the accessories, China and. ‧. Germany ranked respectively the first and the second, taking the share of 53.9% of total imports. sit. y. Nat. of accessories and 28.8% (Table 2-20).. er. io. 2.5.2 Bicycle Planning Policy. al. n. v i n CKaohsiung known as Youbike (or U-Bike) and in h e n g cit'shknown i U as C-Bike. Starting from February Taipei and Kaohsiung both have public bike share systems. The system in Taipei is. of 2009 the total rentals in Kaohsiung were 1,487,448. The bikes were used 155,077 times which was 105,964 more than the same month of the last year. The average turnover rate is 4.6 time/bike/day.3 The program of the “Establishment, Operation, and Management of the Bike Sharing System” was launched by the Department of Transportation, Taipei city government, to encourage citizens to use public bicycles for short distance between bus or train stations or MRT stations in a hope to build a seamless public transport network. ________________________ 3. The most intensive time for using public bikes is from 17:00 to 17:59, http://www.c-bike.com.tw/english/NewsShow.aspx?nid=256.. 23.
(31) In collaboration with Giant Taiwan, the Taipei city government initiated the Taipei Bike Sharing System Service Plan, known as “YouBike” since 1998. YouBike is a sub-system of MRT service. Easycard, credit cards and cell phones are accepted as payment methods for YouBike rentals. The bicycle sharing system is promoted by the model cities, and Taiwan government hope this system can be promoted to the whole island and Ministry of Transportation and Communication will build the bicycle lane network connected between cities through the whole island.. 2.6 Summary Concerning weather changing, starting the year 2000 France started to levy tax to companies and individuals for releasing carbon dioxide to force citizens to change their energy. 政 治 大 imposed anti-dumping duties on imports of bicycles originating in China since the European 立 Bicycle Manufacturers Association (EMBA) alleged that Chinese bicycle producers were. consuming habits. France has started purchasing electric bicycles since 2009. In 1993 the EU. ‧ 國. 學. dumping in the EU. EMBA represents an industry that employs around 20,000 people, mostly in Germany and Italy. This is might be why bicycle industries in EU have not had to face. ‧. challenges for 20 years from the cheap bicycles imported from China.. y. Nat. However it was not a case for electric assistant bicycles. EU’s members are highly. sit. promoting electric assistant bicycles in public use. Sweden, Denmark and Norway have already. n. al. er. io. introduced carbon tax in its own countries. France intended to introduce a levy of 32 Euro for. iv n electric U assistant. every ton of carbon dioxide emitted due to the pressure from the government. Germany and Italy. Ch. engchi. are two main importers which imports Chinese-made. bicycles. France are. planning to purchase 10 million electric bicycles for uses of government’s mechanic and stateowned companies. The Europe of fifteen, the U.S., and Japan are the main consumers of oil. The emergence of bicycle using or ownerships is the clear evidence that bicycles usage is catching the eyes of the countries. Although hybrid vehicles and natural gas vehicles, recognized for good environmental performance, are already available these transportation can’t be moved without gasoline. Though the bicycle production in EU was not growing, bicycle ownership or usage rate are increasing rapidly due to the bicycle related policies which are widely adopted by EU and Japanese governments. Government concerns bicycles industry not only in the way about the industry development but also in the way to connect bicycle with people’s routine life. 24.
(32) C. HAPTER 3 Bicycle Industry in China. China economic reform had introduced foreign investment and foreign advanced technological facilities and knowhow into its industry development. Bicycle industry is by no means with no exception. Komagata (2011) mentioned China as a top one world factory, bicycle industry ranked the second in terms of volume. Computers ranked the first and digital cameras. 政 治 大. ranked the third. In addition to its abundance labors and juggernaut attraction induced by. 立. domestic requirements to pull in the investment from multi-national enterprises. Although. ‧ 國. 學. China’s bicycle industry was facing the anti-dumping duties imposed by EU, this won’t stop China’s step. The foreign and local producers are turning their focus on domestic market. In the. ‧. following sections which will show the conglomeration of foreign enterprises and domestic enterprises is interdependent and can be distinguished by its different orientation toward overseas. sit. y. Nat. or domestic market.. er. io. The agglomerations locate in three regions, which are Northern, Central, and Southern. al. v i n biggest bicycle producer in China as C a state-owned company h e n g c h i U until 1980s. It is the icon of China cycling. The bicycle producers in central region such as Shanghai, Jiangsu and Zhejiang n. China. Tianjin province leads and plays a vital role in Northern region. Flying Pigeon was the. provinces are varied. Forever and Phoenix are two famous Chinese brands in Shanghai. Most of Japanese and Taiwanese producers set factories in Central China. Taiwanese Giant founded in Kunshan and targets the domestic market of Central and Northern China. Shenzhen in Guangdong in Southern China is the first place where most Taiwanese companies built the factories.. 3.1 Production Export and Import of Chinese Bicycle By presenting the outstanding data of production exports and imports of Chinese bicycle in this chapter, the bicycle industry development can be checked. In addition to the analysis of 25.
(33) geographic movement and distribution on bicycle regions clusters, the panorama of Chinese bicycle industry movement can be seen.. 3.1.1 Exports and Imports of Bicycle in China China has been a biggest producer and has a biggest domestic market in the world (BMU, 2009). According to Fu (2010), the country exported USD2.6 billion worth of non-electric bicycles in 2008, an increase of 18 percent over the previous year. Overseas shipments in terms of volume, however, dropped by 4 percent to 57 million units. In 2011 the country exported 56 million units, 2.9 billion US dollars in terms of value in 2011(not including electric bicycles). The average exporting FOB price went 16.1% increase than last year to USD52.. 政 治 大. China’s bicycle exports consist mostly of mountain bicycles, which enjoyed 36% increase. 立. in terms of volume and 19% increase in terms of unit price to 261in light of Table 3-1. In 2011. ‧ 國. 學. only Racing and other bicycles (including children’s bicycles) had an increase of 36% and 6% separately than the year 2010. However in terms of sales in value, the turnover went up for all. ‧. items benefiting from the rising price of unit price for every kind of bicycles.. n. al. er. sit. 2010 2011 Sales Sales Unit Price Sales Sales Unit Price Growth Rate Volume Value Volume Value (%) (10,000 Sets) (Million USD) (USD) (10,000 Sets) (Million USD) (USD) (1) (2) (3) (4) (5) (6) (7)= (4) ∕ (1) 14 31 218.3 19 51 260.9 136.2 914 712 77.9 854 787 92.2 93.5. io. Item. y. Nat. Table 3-1 Sales of Bicycles by Category. Racing Mountain 16,18,20 inch Cross Country Other Cross Country 16" below Other Bikes Other Unautomatic Sub. Total Electric or Electric Assistance Total plus Electric Assistance: Source: JBPI (2012d).. Ch. engchi. i n U. v. 1,008. 283. 28.1. 790. 249. 31.5. 78.4. 6. 2. 39.4. 4. 3. 71.4. 71.6. 1,594 2,280 52 5,868. 337 1,246 18 2,630. 21.2 54.7 33.8 44.8. 1,484 2,420 44 5,616. 356 1,459 15 2,920. 24 60.3 34.2 52. 93.1 106.1 85 95.7. 163. 394. 241.2. 141. 403. 285.5. 86.3. 6,031. 3,024. 50.1. 5,758. 3,323. 57.7. 95.5. 26.
(34) USA and Japan are two biggest exporting markets of China. The two countries took over 50 percents of total exports as displayed in Table 3-2. Exports volume in 2011 dropped 4% to56 million sets but exports value went up to 29 million US dollars comparing with the year 2010. Exports to USA dropped 22% but the exports value dropped only 9% to 8.2 million US dollars, favored by an increase, 18% on average unit price in 2011. However the average unit price exporting to USA was USD55, which was less than Japan USD80.1, Korean USD70.8, Canada USD65.5, Australia USD76.2. The average unit price exporting to Asian countries except Korean remained around USD30-45.. Table 3-2 Countries Importing Bicycles and Parts from China 2010 Volume. Value. 立. 828. 55. Russia. 244. Malaysia. 168. Korea. 158. India. 584. 71.7. Japan. 919. 737. 80.1. 99. 27.0. Indonesia. 385. 140. 36.4. 91. 37.3. Russia. 268. 114. 42.5. 100. 59.7. Malaysia. 179. 67. 37.7. 45. 28.3. Korea. 164. 116. 70.8. 150. 45. 30.0. India. 164. 53. 32.1. Iran. 139. 50. 36.0. Iran. 61. 44.4. Canada. 133. 82. v n i 111. 73. 65.5. Australia. 110. 60. 105. 80. 76.2. Others. 1,648. 568. others. 1,677. 651. 38.8. Total*. 5,868. 2,630. Total. 5,616. 2,920. n. al. C h61.5 Canada U e n gAustralia 53.9 chi 34.4. sit. 367. 1,506. ‧ 國. Indonesia. USA. (USD). ‧. 814. 46.8. Unit Price. 學. Japan. 907. io. 1,937. Value. (10,000 Sets) (Million USD). Nat. USA. (USD). y. (10,000 Sets) (Million USD). er. Country. 2011 治 政 大Volume Unit Price Country. 138. Note: *E-bicycles were excluded. Source: Same as Table 3-1.. Regarding to the countries where China exported electric bicycles to, over 50% of countries are Western countries. In 2011 USA imported the most volume but in terms of trade value Netherlands was biggest. U.K., Japan, Belgium, and Italy took separately 3 to 5% of total trade in terms of value. In terms of quantity the trade units in 2011 reduced 14% than previous year. In terms of value, e-bicycles exports increased 2% in 2011 compared with 2010. With respect to average unit price, it grew 18% to USD 285 (Table 3-3). 27.
(35) Table 3-3 Top 10 Countries Importing Electric Bicycles from China 2010. 2011. Volume. Country. Value. (10,000 Sets) (Million USD). USA. 68.5. 55.3. Netherlands. 14.2. 84.8. Germany. 11.1. Turkey. Unit Price. Country. (USD). Volume. Value. (10,000 Sets) (Million USD). (USD). 43. 43. 98.1. 599.3 Germany. 13. 51. 386.3. 40.9. 368.6 Netherlands. 10. 58. 555.4. 7.8. 21.8. 280.6 UK. 7. 12. 177.3. Japan. 7.7. 20.3. 262.5 Japan. 6. 18. 280.7. UK. 7.5. 11.2. 148.6 Belgium. 5. 21. 426.5. Bangladesh. 5.8. 49.9. 854.6 Italy. 5. 18. 385.6. Italy. 3.5. 11.6. 3. 11. 315.5. Canada. 2.6. 6.8. 3. 33. 1126.7. Arab. 2.6. 1.7. 3. 9. 306.1. Others. 32.2. 89.9. 42. 129. 309.2. Total. 163.4. 141. 403. 394.2. 329.6 Brazil 治 政 264.3 Bangladesh 大 64.9 Canada 279.5 Others Total. 學. ‧ 國. 立. 80.7 USA. Unit Price. Source: Same as Table 3-1.. y. ‧. Nat. 3.1.2 Production and Exports of Five Dominant Provinces. sit. In terms of exports values of bicycles and parts in China, it grew 24% to USD4.4 billion. er. io. compared to the year 2010. The complete bicycle accounted 59%, an increase of 22%, and the. al. n. v i n almost USD4 billion with a share of C 88% trade values. In terms of exports, the general h eofntotal gchi U. parts accounted 41%, an increase of 28%. Guangdong, Tianjin, Jiangsu and Zhejiang accounted. trade took 58% of total exports to USD2.6 billion and the trade value of processing with imported materials took 40% to USD1.8 billion (Fu, 2010).. Bicycles production in 2010 and 2009 among five top provinces in China is displayed as presented in Table 3-4. The share of these five dominant provinces for bicycle production accounts for more than 95% of total production in China. Tianjin in Northern China remains the first for both items of bicycles and electric bicycles in 2009 and 2010. Tianjin took the share of 44% of the total production. Zhejiang took the share around 22% in total production in 2011, ranked the second, but ranked the third in electric bicycle’s production. Jiangsu took the second position for electric bicycles production in 2009 and 2010 and ranked the third in total production. The share of 28.
(36) Guangdong’s was 9% in 2010, ranked the fourth for the total production and its electric bicycle production was behind the top 5 provinces. Shanghai took the fifth position for total production. The share of Zhejiang, Jiangsu and Shanghai in Central China in the total production in 2009 and 2010 was just even with Tianjin’s, around 43%.. Table 3-4 Bicycle Production of TOP 5 Provinces in China Province. Bicycle + E-Bicycle (10,000 Sets). 2009. 2010. 4,302. 4,941 Tianjin. Zhejiang. 2,211. 2,532 Zhejiang. Jiangsu. 1,347. 673. Source: JBPI (2011b).. 2009. 3,598 Tianjin. 治 1,880 Jiangsu 政 1,709 大 1,575 Guangdong 895 980 Zhejiang 立 1,016 Jiangsu 695 835 Shandong 707 Shanghai. 507. 513 Shanghai. 2010. 828. 1,343. 652. 740. 502. 652. 338. 381. 166. 194. ‧. ‧ 國. Shanghai. 3,474. 2010. 學. 936. E-Bicycle (10,000 Sets). 2009. Tianjin. Guangdong. Bicycle (10,000 Sets). In terms of imports in 2010, the imports of bicycle industry was UD322 million. China. y. Nat. imported mainly from Taiwan, Japan, Singapore, and Malaysia. Taiwan accounted 37% of total. sit. imports to USD117 million; Japan with 20% share of the total to USD63 million; Singapore with. er. io. 18% share to USD 57 million; Malaysia with 14% share to USD44 million in trade values.. al. n. v i n C for assembling bicycles The both imported mostly bicycles parts h e n g c h i U (Fu, 2010).. Guangdong and Jiangsu are two biggest importers, importing more than 85% of total imports.. 3.2 Bicycle Industry Development in China’s Southern Region Before the establishment of. People's Republic of China there was no one bicycle. assembly factory in Southern region. In 1960 Guangzhou set up Guangzhou Bicycle Industry Factory, which produced two brands, Wu Yang and Hong Mian. By combining 22 bicycle parts manufactures in Guangdong Guangzhou Bicycle Industry Factory was reorganized by local government into Wuyang Bicycle Group. In 1995 Guangzhou Wuyang Bicycle Group was reorganized again to be subordinate to state-owned Guangzhou Motorcycle Group. The production of Guangzhou was highly effected by central and local government’s policies. Before 29.
數據

+7
Outline
Framework
Bicycle Industry in Taiwan
Summary
Bicycle Industry Development in China’s Southern Region
Bicycle Industry Development in Central Region of China
Bicycle Industry Development in Northern Region of China
Historical Overview on Bicycle Industry Development in China and Taiwan
External factors: Opportunities and Threats
Conclusion
Suggestion
相關文件
To take the development of ITEd forward, it was recommended in the Second Information Technology in Education Strategy “Empowering Learning and Teaching with Information
Xianggang zaji (miscellaneous notes on Hong Kong) was written by an English and translated into Chinese by a local Chinese literati.. Doubts can therefore be cast as to whether
Schools may first relate the four basic learning areas (personal, social, academic and career development) to the personal level of students and then extend to the family and
The original curriculum design for the Department of Construction Engineering of CYUT was to expose students to a broad knowledge in engineering and applied science rather than
例如 : http ( 網頁伺服器所用的協定 ) 定義了 client 如何向 server request 網頁及 server 如何 將網頁及其中的各種內容回傳給 client 。. 提供服務給 application layer
本次的作業 (netstat -na 部分 ) 即在觀看所有機 器上的 transport layer 連線. 本次的作業 (netstat -na 部分 ) 即在觀看所有機 器上的 transport layer
This was followed by architectural, surveying and project engineering services related to construction and real estate activities (with a share of 17.6%); accounting, auditing
5/11 Network Address Translation and Virtual Private Network. 5/18 System configuration and
