The Effect of Foreign Ownership
Restrictions on the Price Dynamics of
Depositary Receipts—Evidence from the
Taiwan and Hong Kong Markets
Bi-HuEi TsAi*
SHU-HSING LI**In this paper, we study depositary receipt prices in regulated markets and free-entry markets. Because of their unique environments, the Taiwanese and Hong Kong markets provide interesting settings that have not yet been explored in the literature. In particular, we focus on the following: (I) the difference in the long-term price relationships between depositary receipts and underlying securities in free-entry and regulated areas, (2) the price dynamics of the depositary receipts for firms with and without the long-term equilibrium relationships between depositary receipts and underlying securities, and (3) the incremental information content of the qualified foreign institutional investor (QFII) ownership ratio for the depositary
receipts issued by Taiwanese firms.
The empirical results reveal that long-term equilibrium relationships between depositary receipts and underlying security prices exist for firms listed in Hong Kong, a free-entry market, but do not necessarily exist for firms listed in Taiwan with foreign ownership restrictions. The long-term equilibrium relationships between depositary receipts and underlying se-. curities and the local market conditions are the most important factors in explaining the depositary receipt returns when the equilibrium exists. In the absence of equilibrium, the lagged returns of depositary receipts or underlying securities and the local market conditions become important. In addition, QFII ownership ratios significantly explain the depositary receipt price variations in a regulated market, which implies the restric-tion effect on the price dynamics of the depositary receipts.
1. Introduction
Our paper studies the price dynamics of depositary receipts (DRs) issued by Taiwanese and Hong Kong firms. Depositary receipts, including global depositary
*Control Yuan of R.O.C.
**Department of Accounting, College of Management, National Taiwan University
receipts (GDRs) and American depositary receipts (ADRs), are negotiable certifi-cates that represent ownership shares in the foreign issuing companies. DRs are convenient ways to own foreign shares because the investors buy and sell them and receive all dividends in the currencies in their countries. Investors thus can enjoy the benefits of international diversification from DRs without going abroad and trading shares on foreign stock exchanges.
Depositary receipt-related issues have caught the attention of academic re-searchers in both accounting and finance. The question is important in relation to the segmentation induced by barriers to international investments. Some researchers derive a two-country model to study the price relationships between the securities traded in different markets given a foreign ownership restriction (e.g., Errunza and Losq [1985]; Eun and Janakiramanan [1986]; Hietala [1989]. The analytical results suggest that two different price rules are to be expected when the two countries are subject to different ownership restrictions. Subsequent studies empirically in-vestigate the premiums of unrestricted shares and support the results of the two-country models (e.g., Stulz and Wasserfallen [1995]; Bailey, Chung, and Kang [1999].
Since foreign ownership restrictions affect the pricing of international assets, we investigate the DR pricing factors, considering the foreign ownership restriction effect. Based on the international asset pricing models of either Solnik (1974), Stulz (1981), or Alder and Dumas (1983), most empirical papers focus on the interde-pendent relationship of the international capital market price movements (e.g., Hil-liard [1979]; Eischer and Palasvirta [1990]; Eun and Shim [1989]; Koch and Koch [1991]. In addition, this type of research also pays attention to the dynamics of DR price transmission. Webb, Officer, and Boyd (1995) estimate the time structure of the relationship between the daily U.S. market index and ADR returns and test whether the relationship varies according to the DR listing country and the region of origin. Jiang (1998) investigates the dynamic relationships between ADR port-folios and local market portport-folios. Eor the cointegrated portport-folios composed by the firms originally listed in Erance, Netherlands, and the U.K., a vector error correction model (VECM) is employed; a vector autoregressive model (VAR) is applied for the remaining noncointegrated portfolios composed by the firms listed in Australia, Japan, Spain, and Sweden. They conclude that the two markets influence each other, confirming the interrelationships in international markets. Kim, Szakmary, and Mathur (2000) use a seemingly unrelated regression (SUR) approach to ex-amine DR price factors such as the prices of underlying shares, the exchange rates, and the S&P 500 indices. Their sample includes firms in developed countries such as Australia, Japan, Netherlands, Sweden, and U.K. They find that although the price of the underlying security is the most important pricing factor, the exchange rates and the U.S. market also have an impact on ADR prices. None of these studies consider the effect of foreign ownership restrictions on pricing.
As an extension of Kim, Szakmary, and Mathur (2000), this paper investigates the DR price dynamics for firms in areas with and without foreign ownership restrictions. The issue of foreign ownership restrictions is interesting because many
TAIWAN AND HONG KONG MARKETS 303 governments in emerging markets are using restrictions of foreign trading as a way to protect their local markets. In countries such as Korea, Thailand, and Singapore, foreigners are restricted from owning too many shares in the marine transport, airline service, communication, mining, agriculture, banking, financial service, and public sectors. In Malaysia, the laws provide for foreign ownership limits of 30 percent to 49 percent for each Malaysian firm. Regulatory effects thus should be an important price factor for firms in equity control countries or industries.
Our sample includes firms in Hong Kong and Taiwan. Hong Kong and Taiwan belong to the Greater China area, with similar languages, origins, customs, and economic conditions. The regulations in Taiwan prevent overseas investors from trading freely through the Taiwan stock markets, but those in Hong Kong do not. The difference in regulations allows us to address the following issues.
Eirst, we compare the dynamic relationships between DRs and underlying se-curity prices in areas with and without foreign ownership restrictions. In the latter, foreign investors can trade directly without barriers. DRs can be converted back into the underlying securities, and underlying securities can be transferred to DRs. The cross-border arbitrage should align the prices of DRs and underlying securities (adjusted for the exchange rate), subject to the cost bounds imposed by the con-version and bid-ask spreads. We should not find a great price discrepancy between DRs and underlying securities for firms listed in the open markets, as the evidence of Kato, Linn, and Schallheim (1991) suggests. Eor firms in Hong Kong, if the prices of DRs and underlying securities diverge, market forces will act to eliminate the gap. Long-term equilibrium relationships exist between DRs and underlying securities. On the other hand, long-term equilibrium relationships do not necessarily exist for firms in Taiwan, where there are foreign ownership restrictions. If the prices of DRs and underlying securities diverge, the market cannot fully adjust to eliminate the gap because of governmental restrictions.
We also investigate the overseas investor demand of Taiwanese firms' holdings on DR returns under foreign ownership restrictions. We use the weekly qualified foreign institutional investor (QEII) ownership data' as the overseas investor de-mand indicators to explain the DR returns. The unique data on QEIIs provide us the ability to study this issue, which has not been the subject of previous research. Under Taiwanese foreign ownership restrictions, foreign investors have two avenues to become the shareholders of Taiwanese firms. Eirst, some qualified in-vestors,^ most of whom are QEIIs,^ can apply to invest in Taiwanese underlying
1. Due to high trading turnovers, they are required to disclose market or firm-specific information more frequently. The data about the "QFII ownership ratio" are collected weekly only in Taiwan.
2. The qualified overseas investors include QFIIs and overseas Chinese and foreign nationals who meet the qualifications. Because of the costly application fees and strict restrictions on investment amounts, overseas Chinese and foreign nationals seldom apply for an investment. QFII inflows are the main overseas investments through Taiwan stock markets.
3. According to Paragraph I, Article 3, of the Regulations Governing Investment in Securities by Overseas Chinese and Foreign Nationals, QFIIs are limited to foreign banks, insurance compan-ies, securities firms, fund management institutions, and other investment institutions meeting the qualification set by the Securities and Futures Commission (SFC). The "QFII ownership data" are
securities. Second, overseas investors can invest in DRs to become stockholders of individual Taiwanese firms. Eoreigners who do not meet the regulatory qualifica-tions can sidestep the restricqualifica-tions and trade Taiwanese shares by investing in DRs. Under the condition of foreign ownership restrictions, QEU ownership indicates the overseas investor demand for Taiwanese firms' holdings. We can use changes in the QEII ownership ratio to study the effect of variations of the overseas investor demand on DR price changes.
Substantial research has investigated the impact of an institution's trading on stock prices and concludes that stock returns are higher when more institutions trade (e.g., Chan and Lakonishok [1993]; Warther [1995]; Keim and Madhavan [1997]; Jones and Lipson [1999]). Eroot, O'Connell, and Seasholes (2001) dem-onstrate that the international portfolio inflows are positively correlated with security returns. To understand the overseas demand on DR returns under the con-dition of foreign ownership restrictions, we examine the incremental information content of qualified foreign institutional investor ownership ratios on DR prices.
Our specification also differs from a classical international asset-pricing model. We measure the effect of the DR and underlying security prices simultaneously. Since DR and underlying security prices act as they are jointly determined, the traditional single equation suffers from underidentification and bias. We therefore specify prices of DRs and underlying securities as endogenous variables and test the long-term relationships of the two series. Instead of using the seemingly un-related regression (SUR) approach in Kim, Szakmary, and Mathur (2000), we use a general vector error-correction model for the firms in the presence of cointegration and a vector autoregressive model for the firms in the absence of cointegration, as in Jiang (1998). By doing this, we can test whether the DR price dynamics are explained by the deviation from the long-run relationship.
Eurther, our study considers the impact of local and global market conditions. Solnik (1974) has used a multi-index price relation to describe the international stock price movements. Stulz (1981) indicates that both the covariance with the world portfolio and the covariance with the local market portfolio affect the prices of interlisting securities, especially for those traded in markets without complete integration. Due to the infiuence of macroeconomic factors, the values of the com-panies are affected by the political and environmental conditions of their original areas. Because international listing induces more market integration, as Alexander, Eun, and Janakiramanan (1988), Miller (1999), and Eoerster and Karolyi (1999) show, the global risk factors affect DR prices. Our model therefore specifies both global market indices and the local market indices of the underlying securities as control variables.
Thus, our paper addresses the following research questions. Eirst, we investi-gate the DR price premiums for firms in areas with foreign ownership restrictions, following the model of Eun and Janakiramanan (1986). We further use
cointegra-calculated only for the shares held by the overseas shareholders (QFIIs) through the stock exchange; prelisting shares are not included.
TAIWAN AND HONG KONG MARKETS 305 tion analysis to compare the difference in the long-term price relationships between depositary receipts and underlying securities in free-entry and regulated areas. Sec-ond, we focus on the price dynamics of depositary receipts for firms with and without cointegration relationships between DRs and underlying securities. For cointegrated pairs, we investigate whether the price dynamics of the DR prices are influenced by the deviation from the cointegration relationships. For noncointe-grated pairs, we examine the effect of the lagged performance of DRs and under-lying securities on current DR prices. Furthermore, we consider the incremental information content of the QFII ownership ratio on DRs issued by Taiwanese firms and explain the overseas demand effect under the foreign ownership restrictions.
The VECM and VAR results indicate that long-term equilibrium relationships exist between DRs and underlying securities for all the Hong Kong firms, but they do not necessarily exist for the Taiwanese firms. The cointegrating coefficients between the DR and underlying security prices for Hong Kong firms are approx-imately one, which implies price equality in the long run. In the absence of coin-tegration, as for Taiwanese firms, the lagged DR and underlying security returns are important in explaining the current DR returns. With respect to the local and global risk factors, we find that the local market index values are reflected in depositary receipt prices for both cointegrated and noncointegrated pairs. We do not find, however, that the global market conditions significantly affect the DR prices.
Another significant finding suggests that QFII ownership ratio changes incre-mentally explain the DR variations in the VAR and VECM models, and they have a significant impact on current DR returns for 13 of the 29 Taiwanese firms in the SUR model. In the VECM and VAR models, we investigate the incremental in-formation content of the QFII ownership ratio when considering the past values of the DRs and underlying securities. The current underlying security returns mainly explain the current DR returns in the SUR model. Since the current underlying security returns contain a large set of complicated information, including the QFII ownership ratio, the SUR model cannot capture the effect of foreigners' demand on DRs precisely. Therefore, although QFII ownership ratio changes significantly and positively vary with DR returns in the VAR and VECM models, they do not in the SUR model. These results are sensitive to the model's specification.
The remainder of the paper is organized as follows. Section 2 provides the background information on Taiwanese foreign ownership restrictions. Section 3 describes the data and sample used in the paper. Section 4 provides a detailed discussion of methodology. Section 5 presents the empirical results, A conclusion is given in Section 6,
2. Background Information on Taiwanese Foreign
Ownership Restrictions
Under current regulations, Taiwan restricts foreign ownership in two ways. First, there is a restriction on foreigners' direct investment through Taiwan stock
markets; the second is the restriction on the issuance of overseas securities by Taiwanese firms.
The Regulations Governing Investment in Securities by Overseas Chinese and Foreign Nationals'* prevent overseas investors from investing freely through the Taiwanese stock markets. A small number of foreign investors, QFIIs, can take limited positions through the Taiwan Stock Exchange and the R.O.C. Over-the-Counter Securities Exchange, but most foreigners cannot. QFIIs must apply to the Central Bank of China (CBC) and the Securities and Futures Commission (SFC) of the Republic of China for direct investment in Taiwanese stock markets. After consulting the CBC, the SFC issues its approval and determines the maximum investment quota for the QFII. Foreigners are required to do much more work in order to invest directly in Taiwan stock markets. For example, the laws require QFIIs to designate a local agent and custodian, and QFIIs must disclose investment information to the Taiwan SFC. QFIIs do receive Taiwanese shares directly through Taiwanese meirkets, but with high transaction costs. In addition, Taiwanese laws forbid the issuance of depositary receipts without the approval of the SFC. These two regulations strictly hinder cross-arbitrage activities and separate the Taiwan stock market from the global markets.
3. Data and Sample
We focus on cross-listing firms in Hong Kong and Taiwan. Weekly data used in this study include stock prices for DRs (depositary receipts, including global depositary receipts and American depositary receipts), prices for underlying secu-rities, and appropriate market indices. If there are stock splits or stock dividends during the research period, the prices are adjusted accordingly for the entire study period. Weekly prices of both the DRs and the underlying securities must be avail-able for each firm. Many illiquid DRs are deleted due to the lack of trading prices. In addition, DRs should have been issued prior to December 31, 1999. The data selection procedure results in 29 Taiwanese companies and 24 Hong Kong com-panies.
Hong Kong companies are originally listed in the stock exchange of Hong Kong, while Taiwanese companies are originally listed in Taiwan stock markets. DR prices for 20 of the Hong Kong firms are collected from the U.S. OTC markets, two from the NYSE, and the other two from NASDAQ.' DRs for 27 of the 29 Taiwanese firms are collected from the London Stock Exchanges Automated Quo-tation International system, one from the NYSE, and the other from NASDAQ.
If the firm issued DRs before January 1, 1994, we collect the related data from
4. These regulations contain rules about the amount of investments, the scope of investments, and limits on investments.
5. DRs traded on the NYSE and NASDAQ must reconcile financial statements to U.S. Generally Accepted Accounting Principles (GAAP); ADRs traded in the OTC markets and GDRs traded through the London Stock Exchanges Automated Quotation International system are not required to reconcile their financial statements.
TABLE 1
Start-Year Distribution of the Sample
Start Year Taiwan Hong Kong
1994 5 0 1995 5 9 1996 4 9 1997 6 4 1998 2 2 1999 7 0 Total 29 24
January 1, 1994, to June 30, 2001, If the issue date of the DRs is after January 1, 1994, we collect the data from the first date when data are available in Bloomberg to June 30, 2001, The number of observations is different for each company, and the start-year distribution of the sample is shown in Table 1, For each issuing company, there may be more than one trading location, but we find no price de-viations for the DRs, We select the most actively traded DRs based on the Bloom-berg data. In the case of Advanced Semiconductor Engineering and Siliconware Precision, the DR program type changed from GDR to ADR; only the GDR portion was included in the data set.
We collect the Hang Seng indices, the Morgan Stanley Capital International (MSCI) world stock indices, and the prices of DRs of these 53 firms through Bloomberg databases. The prices of underlying securities of these 53 firms, Taiwan Stock Exchange weighted indices, and QFII ownership ratios of Taiwanese firms are collected from Taiwan Economics Journal (TEJ) databases,
4. Methodology
4.1 Seemingly Unrelated Regression and DR Pricing Factors
For finance and accounting studies with cross-sectional and time-series obser-vations, the error terms across firms are likely to be contemporaneously correlated. The parameters could be estimated consistently and efficiendy by using an SUR model. To determine the DR pricing factors, Kim, Szakmary, and Mathur (2000) use an SUR model to examine the influence of the underlying securities, the exchange rate, and the U,S, index on ADR prices. In order to compare with their results, we likewise examine the DR pricing factors as an SUR system.
Our regressions are estimated on an exchange-by-exchange basis. For example, all the firms listed in Taiwan are estimated jointly, as are the firms listed in Hong Kong, We also consider the local and global risk factors, using the MSCI world stock index and the local market index as the pricing factors. The Special Admin-istrative Region (SAR) government intervenes to peg the Hong Kong exchange
rate to another currency, such as the U.S. dollar, as discussed In Tsang (2000). Hence, little variation exists for Hong Kong exchange rates, and we do not include the exchange rate variable in our research. The SUR model for DR price factors based on White's (1980) heteroskedasticity-consistent covariance estimator can be represented as
R,, = Po + S K'^.u-j + 1 K^-u-j + 1 hju-j + eu, (1)
where /?,, and /?„,, are the rates of return for the (th DR and the (th underlying security in week t, respectively; /;, is the return on the MSCI index on week / and L,, is the return of the local market index for /th DR on week t. The local market indices are selected according to the indices of the stock markets where the un-derlying securities are listed. For the unun-derlying securities listed in Hong Kong and Taiwan, we use the Hang Seng index and the Taiwan Stock Exchange weighted index, respectively.
The regulations in Taiwan prevent overseas investors from trading freely through the Taiwan stock markets, but those in Hong Kong do not. We therefore test the overseas investor demand effect on the DR prices with the "QFII ownership ratio" variable. The data about the "QFII ownership ratio" are collected weekly for the Taiwanese firms only. If we add this variable, eq. (1) becomes
R,, = ^0 + 2'i'u.A,u-j + I'i'uA.-j + ly.u'u-j + ^4,G,-,, + V,,, (2) j=0 J=0 j=0
where Q-, is the change of the QFII ownership ratio for the /th firm in week t. To examine whether the "QFII ownership ratio" has incremental explanatory power with regard to the DR price variations, we use likelihood ratio (LR) statistics (Greene [1993, pp. 159-162]) and partial F statistics (Greene [1993, pp. 337-338]) to test the null hypothesis 4^4 = 0. The LR statistics test the difference in the log-likelihood function between eqs. (1) and (2). The partial F statistics test is the same as the test in Ali and Pope (1995); it compares the sum of the square residuals between these two equations.
4.2 Cointegration Tests Between DR and Underlying Security Prices
4.2.1 Johansen Trace Tests
The SUR model examines the relationships between DRs and the pricing fac-tors, such as the prices of the underlying securities, the relevant exchange rates, the global market conditions, the local market conditions, and the QFII ownership ratio. We next compare the long-run price relationships between DRs and under-lying securities for firms listed in areas with and without foreign ownership restric-tions by employing the same methodology as Jiang (1998).
TAIWAN AND HONG KONG MARKETS 309 more nonstationary series may be stationary, the time series are said to be coin-tegrated. The stationary linear combination is the cointegrating equation, which can be used to infer the long-run equilibrium between the variables. Jeon and Chiang (1991) use the cointegration test to examine the long-term equilibrium of the in-ternational markets. Here we propose to examine whether a long-term equilibrium exists between the DR and underlying security prices by using Johansen (1995) trace tests.
First, we use the augmented Dickey-Fuller (ADF) tests'" to check whether the two endogenous variables, the series of DR prices and underlying security prices, are unit roots, /(I). We further use the Johansen trace test (1995) to examine whether there is a stationary linear combination of these two nonstationary series. The stationary linear combination implies a long-term equilibrium relationship be-tween the DR and underlying security prices. Considering a VAR of order T, the model can be written as
p,, ~ normal i.i.d. (0, o^),
where y, = (P,,, /'„,,)'. Here P,, and P„;, are the DR and underlying security price per share adjusted to the U.S. dollar level for ith firm in week t. The two price series are nonstationary, /(I) variables, and |i, is a vector of innovations.
We can rewrite the previous equation in first differences as
A y, = no + n >'--. + 2 "^Ay.-: + p-,, (3)
1 = 1
where
n =
SA,
- /,
»P,
= - i
A,,
and i^y, are the first differences of _y,. Since the two time series {P,,} and {/',„,) in eq. (3) both follow random walks, the nonzero 11 implies the stationary combination of the two series. The two different /(I) series have similar low-frequency or long-run components and produce a new 7(0) series because their random-walk processes move with the long-run equilibrium path. A nonzero IT suggests that the DR and underlying security prices do not drift too far apart and their long-term equilibrium
6. Augmented Dickey-Fuller unit root tests: The one-unit root test is
and the two-unit roots test is
where x denotes the price of the DR or the underlying stock. We examine the hypothesis of ^1 = 0 and ^2 = 0 in the regression listed. Asymptotic critical values are from Davidson and MacKinnon (1993). Lag length K is chosen in the criteria of AIC minimization.
adjusts the short-term DR price movement, so n is the crucial parameter for coin-tegration. We examine the null hypothesis that n = 0 by using the trace test. If the result rejects the null hypothesis that each of the ranks of n is zero, the variables in y,, the DR and underlying security prices, are cointegrated. If the series of DR and underlying security prices are cointegrated, the stationary linear combination implies the long-term equilibrium of the two series. We analyze the cointegration relationships between DR and underlying security prices in free-entry and regulated markets.
4.2.2 The Equilibrium Relationships Between DR and Underlying Security Prices
We also examine the linearly independent cointegrating relationships among the variables. Since DR and underlying security prices are two endogenous varia-bles in our model, there can be one linearly independent cointegrating relation for cointegrated pairs. If the series of DR and underlying security prices, /",, and P^,,, are 7(1), a $ = [1, -<I>,] exists such that (P,, - ^.f^-, - <i>o)'' is 7(0) for cointe-grated pairs. Here O, is the normalized cointegrating coefficient between DR and underlying security prices, while <I>o is the normalized cointegrating intercept. For the cointegrated pairs, we observe whether the cointegrating coefficients between these two series are approximately one (<&, «= 1). If the cointegrating coefficient is approximately one, it suggests price comovement between DRs and underiying securities in the long run, namely, dP'JdPj, == 1.
4.3 The Price Dynamics of DRs and Underlying Securities
After we investigate the long-term relationships between DR and underlying security prices, we compare the differences in the DR price dynamics between two areas, one with and one without foreign ownership restrictions. Our specification differs from a classical international asset pricing model simply because we meas-ure the effect of the DR and underiying security prices simultaneously. Since the DR and underlying security prices act as if they are jointly determined, the tradi-tional single equation approach, such as SUR, suffers from under-identifieation and bias. We therefore specify the returns of DRs and underlying securities as endog-enous variables.
We specify a general vector error-correction model for cointegrated pairs and a standard vector autoregressive model for noncointegrated pairs. A VECM is a better specification for cointegrated series. The VECM specification restricts the long-run behavior of the endogenous variables, DR and underlying security prices, to converge to their eointegrating relationships while allowing a wide range of short-run dynamics. The long-run convergence evidenced by cointegration suggests that if the prices of DRs and the underlying securities diverge, market forces will
7. Our model assumes that these two variables have no trend and that the cointegrating equations have an intercept (Johansen [1995]).
TAIWAN AND HONG KONG MARKETS 311 act to eliminate the gap. The dynamics of the DR prices could be influenced by the deviation from the long-run relationship, or, specifically, the error correction terms in the cointegration equation. A standard VAR is misspecified due to the absence of the error correction terms.
We construct a general VECM for cointegrated pairs as
2
/?,, = CO,o + O),, (log P,,_, - (t), log 7'«,,_, + a,) + 'Zli.n^U-n „=! (4) 2
+ 1 KKu-n + Tl,/,-,, + €,L,, + 8,,,
2
Ku = w«,,o + w»,.i (log /',,,-, - <t), log /•„,,,_, + a,)
-I-(5)
where log P,, and log P„;, are the logarithm of the U.S. dollar-based prices per share for the /th DR and the ith. underlying security in week t; 7?,, and R^,, are returns for the /th DR and underlying security in week t, respectively; and they are estimated as 7?,., = (log /',., - log P,,.,) and /?„,•, = (log P^, - log P«,.,_,). Here 7,, is the return on the MSCI world stock index, and L,, is the return on the index of the market where the underlying securities are listed.
A standard VAR is employed for noncointegrated pairs. The model is quite similar to eqs. (4) and (5), but without the error correction terms:
+ ^KRu,,-n + t,7,, + ^ X , , + V,,, (6)
K,,-n + t„,7,, + a„,L,, + -U^,, (7)
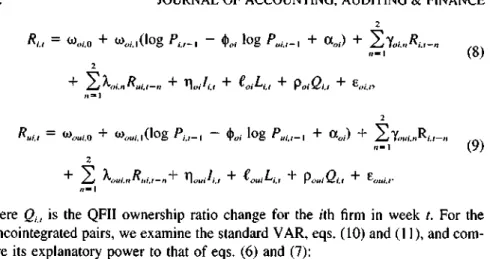
4.4 Refining Test of the QFII Ownership Ratio Variahle
The regulations in Taiwan prevent overseas investors from trading freely through the Taiwan stock markets, but those in Hong Kong do not. We focus on the data regarding "weekly QFII ownership ratios" to explain the DR variations for Taiwanese firms. Although we have tested the "QFII variables" under SUR in eq. (2), in this section we refine this test and check the robustness. Qur model regresses the DR returns of the Taiwanese firms on one more variable, "the change of the QFII ownership ratio." For the cointegrated pairs, we examine the vector error correction model, eqs. (8) and (9) and compare their explanatory power with that of eqs. (4) and (5):
2
,.=1 (8)
"=1 (9)
where Q,, is the QFII ownership ratio change for the /th firm in week t. For the noncointegrated pairs, we examine the standard VAR, eqs, (10) and (11), and com-pare its explanatory power to that of eqs, (6) and (7):
n=\ n=l (10)
4-, + ^oiQu + ^o,.
«=1 «=1 ( 1 1 )
+ ^ouiLu + K^^e,, + v<,„,.,,,
To test the incremental information content of the QFII ownership ratio with regard to DR returns, we use likelihood ratio (LR) statistics (Greene [1993, pp, 159-162]) and partial F statistics (Greene [1993, pp, 337-338]), We test whether the coefficients of the QFII ownership ratios help explain the DR prices. If the null hypotheses that K = 0 and p = 0 are rejected, the QFII ownership ratio makes a significant contribution in explaining the variation in DR prices and QFII ownership ratios contain incremental information regarding DR prices,
5. Empirical Results
5.1 Descriptive Statistics of ttie Sample
Table 2 provides descriptive statistics on the average difference ratio between the DR and underlying stock prices of each firm. The difference ratio is defined as (P,., - PuuVPui.r where P,, and P^,, are the DR and underlying security price per share adjusted to the U,S, dollar level for the (th firm in week t. For the 24 firms listed in Hong Kong, the average difference ratios of each sample firm range from -0,04135 to 0,03948, which supports the law of one price. The average price difference ratio in our sample is —0,006946 for Hong Kong firms. The T statistic results show that the price difference ratios are significantly different from zero for 18 of the 24 firms. Although the depositary receipts and the corresponding under-lying securities represent the ownership of the same firm, the prices are not
com-TABLE 2
Summary Descriptive Statistics on the Average Difference Ratio" Hong Kong Firm" Ratio Taiwan Firm Electronics 1 2 3 4 5 6 7 8 9 10 11 12 13 14 15 16 17 Ratio GDR ADR 0,072479*** -0,04419*** 0,379286*** 0,138631*** 0,134974*** 0,054526*** -0,03652** 0,268753*** 0.143404*** 0,005380 -0,01400*** 0,327303*** 0,358155*** 0,035968*** 0,037158*** 0,465314*** 0,052801*** Non-Electronics 18 19 20= 21 22 23 24 25 26 27 28 29 0,085620*** 0,144543*** 0,055545*** 0,066306*** 0.058971*** 0.018833*** 0.077937*** 0,056942*** 0,127002*** 0,095814*** 0,050493*** 0,206158*** 0,094253*** 0,119018" ADR-OTC 1 2 3 4 5 6 7 8 9 10 11 12 13 14 15 16 17 18 19 20 ADR-NASDAQ 21 22 ADR-NYSE 23 24 -0,00733*** -0,01053*** -0,01930*** -0,00081*** 0,02699*** -0,00089 -0,02240*** -0,00078 -0.00014 -0.01304*** -0.02335*** -0,00115 -0.04135*** -0.00778*** -0.00967*** -0.01235** 0.01053*** -0.00064 -0.00606*** -0.00254 0.03948*** -0.02477*** -0.01294** -0.02589*** Average -0,006946
"The difference ratio in our research is defined as (f,, - P^iJ/P^i,. "The names of firms are available from the authors,
"The average price difference ratio is 0.066306 between the ADR and the underlying security for Chinese Steel, and 0,055545 between its GDR and the underlying security,
''The average difference ratio of the Taiwanese firms, 0,119018, is calculated with the GDR data of Chinese Steel, 0.055545. If we use the ADR data of Chinese Steel, 0,066306, the average difference ratio of the Taiwanese firms is 0.119389.
*Significant at the 10 percent level. **Significant at the 5 percent level, ***Significant at the 1 percent level.
pletely equal because of time lags, tax regulations, transaction procedures, or information transmissions.
For the 29 firms listed in Taiwan, Table 2 shows that the average difference ratios range from —0,04419 to 0.465314, As Errunza and Losq (1985) suggest, the persistent price deviation implies the segmentation of the international markets due to the foreign ownership restrictions. On average, the persistent price premium exists for Taiwanese firms. Yet the difference ratios for the Taiwanese firms with discounts are within a negative 5 percent bound. Regulations permit overseas in-vestors to convert DRs back into underlying securities, which are sold on the Taiwan stock markets,'* Thus, DRs may be converted back into underlying secu-rities when they are traded at a discount, A DR discount of a large magnitude will not last forever because of the "flowback effect,"
On the other hand, the price premium may persist for some time because converting the underlying shares to DRs is not as easy as flowback,* The DR prices of some Taiwanese firms trade at 30 percent to 50 percent premiums in certain periods. We observe that these firms usually rank among the top in production and sales in their industrial sectors worldwide,'" The shares of these firms are popular with foreign investors because of their leading positions in the worldwide market. On the demand side, institutional managers who are not qualified to invest through the Taiwanese stock markets would like to invest most of their funds in stocks or DRs of leading companies to keep their performance above average. On the supply side, Taiwanese firms must obtain SFC regulatory approval to issue DRs, The firms are regulated not only to meet the listing requirements of foreign stock exchanges but also to comply with the registration as well as disclosure rules of foreign security and exchange commissions. It is difficult for the shares to be issued im-mediately and freely, so the premium for local stocks may persist for a long time. The premium will not converge nearly to zero because of excessive demand for and an insufficient supply of the leading firm's shares.
Since 17 of the 29 Taiwanese firms are electronics industries, we also partition the results to show electronics and non-electronics industry groups. Price difference ratios are above 5 percent for 10 of the electronics industry firms and 11 of the nonelectronics industry firms, DR persistent premiums exist for both kinds of firms. In addition, the Chinese Steel Company issues GDRs and ADRs
simultane-8. Article 14 of the Criteria Governing the Offering and Issuance of Overseas Securities by Issuers,
9, DRs issued by Taiwanese firms can be converted back into underlying shares, but underlying shares cannot be converted immediately into DRs, The shareholders of the underlying securities issue DRs on the condition of approval from both their board of directors and the SFC,
10, Taiwan Semiconductor Manufacturing Co. (TSMC), Advanced Semiconductor Engineering Corp. (ASE), Asutek Computer Corp., Hon Hai Precision Industry Co., and Yang Ming Marine Co. rank first, first, first, first, and twelfth, respectively, in production and sales in their industrial sectors worldwide according to analysts' reports.
TAIWAN AND HONG KONG MARKETS 315 ously. We find no large price deviations between the two, but the price difference ratios are above 5 percent between the underlying securities and the ADRs or GDRs, Since foreigners are able to trade ADRs and GDRs freely, the arbitrage activity bounds the price difference between ADRs and GDRs, Meanwhile, the large price deviations exist between the underlying securities and the DRs because the Taiwanese regulations hinder cross-border arbitrage,
5.2 Seemingly Unrelated Regression Results
The results of SUR tests are shown in Table 3, The reported / statistics are based on White's (1980) heteroskedasticity-consistent standard errors. For firms listed in Hong Kong, the coefficients for the current underlying securities are pos-itive and highly significant. However, the coefficients for one-week lags are sig-nificantly positive for only 7 of the 24 firms, different from the results of Kim, Szakmary, and Mathur (2000), With respect to the results for Taiwanese firms, DR returns are positive related to the current underlying security returns. The coeffi-cients for one-week lags are significantly positive for 17 of the 29 firms. The speed of price adjustment and information transmission is higher for DRs issued by Hong Kong firms than Taiwanese firms. The arbitrageurs eliminate the price-value de-viation between DRs and underlying securities by synchronous trading for Hong Kong firms.
In addition, the current local market index coefficients are significantly positive for 7 of the 29 Hong Kong firms and 8 of the 29 Taiwanese firms. The current global market index coefficients are significantly positive for 9 of the 24 Hong Kong firms and 3 of the 29 Taiwanese firms. The SUR models do not conclude that the local market conditions and global market conditions are important factors to explain the current DR returns.
With respect to the QFII ownership ratio variable, changes in the QFII own-ership ratio are positively associated with the DR prices in general. The changes are positively associated with current DR returns for 13 of the 29 Taiwanese firms. The results of the LR statistics and the partial F statistics do not support the hy-pothesis that changes in the QFII ownership ratios contribute to the variations of DR returns.
Inconsistent with the results of Kim, Szakmary, and Mathur (2000), the lagged performance of underlying securities does not affect the current DR returns for Hong Kong firms. Arbitrageurs gradually eliminate some mismatches between DRs and underlying securities issued by Hong Kong firms. We do not find evidence that the lagged underlying security prices generally explain DR prices for all the different markets, as is reported in Kim, Szakmary, and Mathur (2000),
o 1 # * IIO I d o ( N 00 00 o d > + + 06 •a
I
1
o
2
CO. -HI,- H I
o o I I 8 s q dI
5.3 Multivariate Cointegration Tests for Long-Term Equilibrium Relationships
5.3.1 The Results of the Johansen Trace Test
To test the long-term equilibrium relationship between DRs and underlying securities, we initially perform the ADF tests to examine the stationary properties of the series of DR and underlying stock prices. Tests for the presence of one unit root in the price series fail to reject the null hypothesis at the 5 percent level. On the other hand, tests for two unit roots reject the null hypothesis at the 1 per-cent level. Both tests suggest that the first differencing is enough to obtain the sta-tionary.
Because the DR and underlying security price are integrated of order one, /(I), we perform Johansen's multivariate cointegration test to recapture the long-term relationship between the prices per share of DRs and underlying securities. Panel A of Table 4 shows the results of Johansen's trace tests for firms listed in Hong Kong, Since tests for cointegration rejected the null hypothesis at the 5 percent level, a long-run equilibrium exists between the prices of DRs and those of the underlying securities. The result of market integration is consistent with previous research (e,g,, Jeon and Chiang [1991]) in stating a long-term equilibrium between the international stock price indices. Long-term convergence evidenced by coin-tegration suggests that if the prices of DRs and the underlying securities diverge, market forces will act to eliminate the gap. The DR and underlying share prices are effectively cointegrated as well as substituted because the long-term price dif-ference between DRs and underlying shares are subject to the costs imposed by the conversion and bid-ask spreads.
Panel B of Table 4 reports the results of Johansen's trace tests for the 29 Taiwanese firms. The null hypothesis of the cointegration tests is rejected for only 13 of these firms at the 5 percent level, so a long-run price equilibrium between DRs and underlying securities does not exist for 55 percent of the Taiwanese companies in our sample. These results imply that a long-term equilibrium between the prices of DRs and their underlying securities does not exist for most Taiwanese firms. This market segmentation can be attributed to restrictions on foreign own-ership,
5.3.2 The Results of the Equilibrium Relationships
Table 4 also shows that the normalized cointegrating coefficients for the Hong Kong firms are in the scope of 0,913879 to 1,072009, except for one company with a coefficient out of the range. The normalized cointegrating coefficients be-tween prices of DRs and underlying securities are approximately one, which sup-ports the law of one price in free-entry markets. In an environment without international investment barriers, the markets will adjust to eliminate the price divergence between DRs and underlying securities.
Of the 13 Taiwanese firms with cointegrated pairs, the normalized coefficients between the two price series range from 0,958030 to 1,109656 for seven firms. Of
TABLE 4
Johansen Multivariate Cointegration Tests"
Panel A: Firms listed Firms* ADR-OTC 1 2 3 4 5 6 7 8 9 10 11 12 13 14 15 16 17 18 19 20 ADR-NASDAQ 21 22 ADR-NYSE 23 24 Ay, = r in Hong Kong Trace Test (n = 0) 33.21684*** 25.45022*** 22.07521*** 28.38455*** 18.66875*** 66.16208*** 32.84316*** 102.0219*** 30.90211*** 34.36664*** 33.57661*** 22.64805*** 33.64345*** 43.19565*** 16.26240*** 71.28804*** 33.32016*** 19.22858** 147.7749*** 71.05809*** 41.26096*** 35.08573*** 27.14794*** 18.46650*** lo + It)",., r - i Cointegrating Coefficients'^ (*,) 0.957838 1.013585 0.991022 1.000021 1.072009 1.007363 1.003521 0.997974 0.999291 1.026827 0.996663 0.913879 0.988253 1.015128 0.866195 1.001243 1.035935 1.012890 0.994362 0.999388 0.936181 1.005192 1.070463 1.008822 (3) Cointegrating Intercept (O,,) 0.029174 0.000843 -0.017670 0.001144 0.002036 -0.001320 -0.009929 0.001004 0.000190 -0.131904 -0.103049 -0.090513 -0.026899 -0.184496 0.114099 0.000128 -0.004362 0.102178 0.005650 0.006489 0.020394 -0.001951 -0.001204 0.077386
the 16 noncointegrated Taiwanese firms, the normalized coefficients are out of the scope from 0.9 to 1.1 for 12 pairs. The average difference ratio exceeds 9 percent for the 11 noncointegrated pairs. The foreign ownership restrictions hinder cross-border arbitrage and cause the price deviations between DRs and underlying se-curities. A long-term equilibrium relationship does not exist between DRs and underlying securities for Taiwanese firms.
TABLE 4 (continued) Panel B: Taiwanese Firms GDR-LSEQ-I 1 2 3 4 5 6 7 8 9 10 11 12 13 14 15 16 17 18 19 20 21 22 23 24 25 26 27 ADR-NASDAQ 28 ADR-NYSE 29 firms Trace Test (n = 0) 20.16489*** 28.10140*** 23.70009*** 31.58902*** 13.81333 15.38138 32.74474*** 10.57403 22.52776*** 20.05418*** 9.98111 14.27756 19.34103** 29.89695*** 12.93779 7.93026 12.66651 6.51966 14.44187 11.70233 12.34244 22.53542*** 8.00318 27.13677*** 24.56922*** 9.63852 8.29724 26.05817*** 11.87569 Cointegrating Coefficients (*,) 1.096739 0.958030 1.163679 1.506496 1.636600 0.842406 1.080773 1.059372 1.241809 0.726382 0.987563 1.142157 1.294700 1.109656 2.411968 2.619533 .014836 .006870 .341197 .312250 .329507 .016539 .243982 .095410 .045577 .791530 .782443 1.025974 .842190 Cointegrating Intercept (Oo) 0.022428 -0.001185 -0.061583 -0.116528 -1.899207 0.417187 0.065877 0.006234 -0.128532 0.353643 0.082140 -0.104228 -0.215743 -0.058807 -5.961255 -1.430691 -0.011637 -0.001749 -0.039361 -0.125091 0.028265 0.041448 0.108280 -0.010834 -0.008281 -0.295037 -0.408369 0.017169 -0.597929 ">"/ ~ (Pi.r P«i.,y^ iind 'he cointegration equation is based on two variables: (1) DR prices per share (adjusted to the U.S. dollar level) and (2) the underlying security prices per share (adjusted to the U.S. dollar level).
''The names of firms are available from the authors.
''Because of the two endogenous variables in our model, there can be one linearly independent cointegrating relation for cointegrated pairs. Our model assumes that these two variables have no trend and that the cointegrating equations have an intercept (Johansen [1995]). If the series of DR and underlying security prices, P,, and /•„,„ are /(I), a $ = [1, - <t>|] exists such that (/"„ -<t'|/',,,., - 'l>ii) is /(O) for cointegrated pairs. Note O, is the normalized cointegrating coefficient between the DR and underlying security prices, and O,, is the normalized cointegrating intercept.
5.4 The Price Dynamics of DRs
In this section, we compare the difference in price transmission between firms in markets with and without foreign ownership restrictions. We use a multifactor asset pricing model and measure the effect of the DR and underlying security prices simultaneously. According to the results in Table 4, DR and underlying security prices are cointegrated for all of the firms listed in Hong Kong, so we use the VECM model (eqs. [4] and [5]) to test the price transmission.
Panel A of Table 5 reports the results of these cointegrated pairs. For the DR return (eq. [4]), the error correction term is negatively significant for 16 of the 24 Hong Kong firms. The average coefficient of the error correction terms is —0.60951, significantly and negatively correlated with the DR returns. The long-run equilibrium relationship between DR and underlying security prices adjusts the DR short-term price overreaction. If the short-term DR prices are too high (low) in comparison with the corresponding original market prices, they finally turn down (up) toward the long-run equilibrium. The deviation from the long-run relationship or, specifically, the error correction terms in the cointegration equation is refiected in the DR price dynamics. The DR returns for a one-week or two-week lag are significantly and negatively associated with current DR returns for only 4 or 3 of the 24 firms, respectively. The underlying security returns for a one-week or two-week lag are positively associated with current DR returns for only 2 or 3 of the 24 firms, respectively. Thus, the error correction terms mainly explain the varia-bility of DR prices. If the DR prices for a one-week lag are too high (low) in comparison with the corresponding original market prices, they turn down (up). The current DR prices are significantly and negatively affected by the deviation from the long-term equilibrium, rather than the lagged prices of DRs and underlying securities. Investors therefore may be better off by incorporating the information contained in previous price divergences from the long-run relationship when form-ing their current investment strategy.
For firms listed in Taiwan, a standard VAR is employed for non-cointegrated pairs because most of the Taiwanese firms do not show a long-term equilibrium between DR and underlying security prices. On the other hand, a general VECM is specified for cointegrated pairs. Panel B of Table 5 shows the results for these cointegrated pairs listed in Taiwan. For 9 of the 13 cointegrated pairs, the error correction terms negatively and significantly affect the DR returns. The DR returns for a one-week or two-week lag are significantly and negatively associated with current DR returns for only 4 or 3 of the 13 firms, respectively. The underlying security returns for a one-week or two-week lag are positively associated with current DR returns for only 3 or 1 of the 13 firms respectively. The coefficients of the lagged DR and underlying security prices are not significant. The long-term price relationships between DRs and underlying securities mainly explain the DR returns, as with the Hong Kong firms.
For the noncointegrated pairs in the VAR model, however, the DR returns are explained chiefly by the lagged performance of the DRs or underlying securities.
3 '0
2
5!
a
I
t
B
a. T3 00 IT) S O 2 8 d dq d 8 8
t
-I' O I8
OS to" " H -t o * »n
<
o o I q q d d a; 9^9-1
a + ^ b .5 ,^ ,^ ^ J 2 •" 'u ^ n i ^ ^ ^ c _ ^ — =^ 1) lu ^ C —' '^ — s s i 2 S = I o II-
5
TAIWAN AND HONG KONG MARKETS 323 The results are shown in panel C of Table 5. DR returns for a one-week or two-week lag are significantly and inversely associated with current DR returns for 11 or 7 of the 16 firms, respectively. If the DRs overreact, the DR returns tend to adjust afterward. In addition, the underlying security returns for a one-week or two-week lag positively affect the current DR returns for 10 or 9 of the 16 firms. In the absence of cointegration, investors can predict the DR price dynamics better by considering the historical DR and underlying price information.
With respect to the effect of local market conditions, the returns on the local market indices significantly and positively affect the DR returns for 16 of the 24 Hong Kong firms and 18 of the 29 Taiwanese firms. The average coefficients of local indices are 0.75559, 0.43868, and 0.58797 for the cointegrated pairs in Hong Kong, the cointegrated pairs in Taiwan, and the noncointegrated pairs in Taiwan, respectively. The local market conditions significantly affect the DR returns. DR prices depend on the macroeconomics and political environments where the firms are located.
With regard to global market conditions, the coefficients are significant for 10 of 29 Taiwanese firms and 5 of 24 Hong Kong firms, respectively. Since the MSCI world stock index variable is composed of complicated factors, we do not get robust evidence that global market conditions explain the DR returns.
Comparing the VECM results of Hong Kong firms in panel A to those of Taiwanese firms in panel B, the coefficient of the error correction terms is -0.60951 for the firms listed in Hong Kong, but -0.16598 for those in Taiwan. The effect of the error correction terms, w, „ is larger in magnitude for firms listed in Hong Kong, so the deviation from the long-term equilibrium adjusts the Hong Kong DR prices more quickly. Because Hong Kong markets are free-entry markets, the information transmits and the price adjusts at a faster speed.
Comparing the VECM results for Taiwanese firms in panel B to the VAR results in panel C, the lagged returns of DRs and underlying securities explain the current DR returns in the VAR models, but not in the VECM models. In the VECM models, the price relationships between DRs and underlying securities for the one-period lag mainly affect the current DR returns. In the VAR models, investors appear to adjust the short-term DR price overreaction afterward in the absence of the equilibrium relationships between DRs and underlying securities.
Inconsistent with the SUR models, the historical information on DRs and un-derlying securities become important in explaining the current DR returns for both Taiwanese and Hong Kong firms in the VAR and VECM models. In addition, the local market conditions have a substantial impact on the current DR returns.
5.5 The Incremental Information Content of the QFII Ownership Ratio
Because the data about the QFII ratios are collected weekly in Taiwan, we regress the DR returns of the Taiwanese firms on one more variable, "QFII own-ership ratio change," in eqs. (8) and (9) for cointegrated pairs and eqs. (10) and
(11) for noncointegrated pairs. Table 6 shows the results of the DR price dynamics with this variable. Changes in the QFII ownership ratio significantly affect current DR returns for 23 of the 29 Taiwanese firms. The average coefficients of changes in the QFII ownership ratio in Table 7 are 0.05067 and 0.04533 for cointegrated pairs and noncointegrated pairs respectively, significantly different from zero at the
1 percent level.
To examine the incremental explanatory power of the QFII variable, we use the LR and partial F statistics tests. These results are presented in Table 7. The LR statistics and partial F statistics reject the hypotheses that K = 0 and p = 0 for 23 of the 29 firms. The change in the QFII ownership ratio significantly and additionally explains the variations of DR returns.
The changes of the QFII ownership ratios contain incremental information content regarding DRs in the VAR and VECM models, but not in the SUR model. Actually, investors can predict current DR returns with historical time-series DR and underlying security returns; current DR returns can be explained by past values of DRs and underlying securities. The VAR and VECM models investigate whether adding QFII ownership ratios improves the explanation. These models capture the incremental information content of foreigners' demand on current DR returns con-ditional on the past price information of DRs and underlying securities.
The current DR returns are explained by current underlying security returns in the SUR model. Actually, the current underlying security returns contain a large set of complicated information. The components of the current underlying security returns include foreigners' capital inflows, the lagged performance of DRs or un-derlying securities, and the local or global risk factors. SUR models cannot capture the foreigners' demand effect on current DR returns precisely. Current QFII own-ership ratio changes therefore provide an additional explanation for the current DR returns in the VAR and VECM models, but not in SUR models. Hence, the results of QFII ownership ratio changes are sensitive to the specification of the model.
For the same reason, the VAR and VECM results support the effect of the lagged DR and underiying security prices on current DRs, while the SUR results do not. In VECM models, the price relationship between lagged DR and underlying security prices adjust current DR returns. In VAR models, the lagged DR and underlying security returns are significantly associated with current DR returns. However, the current underlying security contains the effect of historical infor-mation about the DRs returns, underlying security returns, and changes in the QFII ownership ratio. The SUR model cannot investigate the DR price dynamics exactly. In summary, the QFII ownership ratio changes, returns on the local market index, and the historical information about the DRs and underlying securities are signif-icantly related to the current DR returns in VECM or VAR models, but not in SUR models.
cs
I
,o o -4irf«
I
e
csI
cS iqu a w ;fncie n o U k'erag e < + ?2' N [ X 1 7 + + Ta?
] 1 + 1i
+ + 1 2 1 3 + •a d 1 # « •s
s
d o d 1 #i
d -H 00 d d ^ g o o I — 00 S ::: q S d d Ol3
^ '326
TABLE 7
Results on the Incremental Information Content of Changes in the QFII Ownership Ratio Firms" 1 2 3 4 5 6 7 8 9 10 11 12 13 14 15 16 17 18 19 20 21 22 23 24 25 26 27 28 29 Coefficient of QHI 0.068021*** 0.034441 0.065341*** 0.022965*** 0.057833*** 0.032589*** 0.027734* 0.028368*** 0.024805*** 0.019700*** 0.064054*** 0.004921 0.081715*** 0.056178*** 0.129395*** 0.008838 -0.00318 0.046983*** 0.002929 0.025870** 0.063975*** 0.003462 0.047909*** 0.059012*** 0.089535*** 0.103250** 0.061596*** 0.083784*** 0.068343*** F statistics 34.7228*** 2.1644 11.6628*** 15.2772*** 51.717*** 15.2284*** 3.8646* 10.4520*** 8.0986*** 14.0946*** 11.6768*** 1.5476 17.1332*** 10.7568*** 37.8072*** 0.7824 0.0054 11.1646*** 0.7796 4.6038* 50.6036*** 0.2940 19.1878*** 7.6220** 31.4390*** 4.6934* 27.3914*** 16.3034*** 37.8148*** LR statistics 36.0960*** 2.3944 11.5771*** 15.0208*** 69.0228*** 6.88303** 3.8725* 11.1279*** 25.9101*** 13.5461*** 7.0852*** 0.9737 27.0952*** 10.6865*** 32.3210*** 0.3014 0.0050 11.0563*** 0.8105 11.6026*** 68.5829*** 0.2668 18.5881*** 8.0729*** 34.7295*** 4.5880* 74.5239*** 16.9286*** 41.5013*** Average QFII Ownership Ratio (%) 8.8382 2.6982 4.5344 11.3620 17.0540 9.8730 3.1088 6.1088 17.3189 20.7635 6.1085 8.3085 17.4000 4.2859 29.0345 5.8630 2.6188 5.3556 16.8211 7.3082 12.7513 14.3366 8.4048 2.8759 17.0796 1.3577 9.0658 1.9150 6.9704 "The names of firms are available from the authors.
*Significatit at the 10 percent level. **Significant at the 5 percent level. ***Significant at the 1 percent level.
6. Conclusion
We studied the price dynamics of depositary receipts issued by Taiwanese and Hong Kong firms and considered the implications of the differing regulatory en-vironments of these two areas. Hong Kong is a completely free-entry market, while the Taiwanese market is regulated, with restrictions on foreign ownership. The difference in regulations enabled us to address the economic consequences of
cap-TAIWAN AND HONG KONG MARKETS 327 ital controls. With the admission of Taiwan into WTO in the near future, the results of this study will be relevant to private investment decisions as well as public policies.
We initially examined the interrelationships between the DR and underlying security prices by employing different models. For firms in the free-entry Hong Kong market, investors with underlying securities (DRs) are allowed to convert into the DRs (underlying securities). Our results indicate an average 0.7 percent DR price discount, which supports the law of one price. We found that long-term equilibrium relationships between DR and underlying security prices exist for all the Hong Kong firms, but Taiwanese firms show long-term price premiums. This result implies a regulatory impact on the price divergence between DR and under-lying security prices.
Specifically, we used the VECM and VAR models to study the DR price dynamics. For Hong Kong and Taiwanese firms with cointegrated pairs, the dif-ference in DR and underlying security prices is a short-term phenomenon. In the short run, if DR prices are too high (low) in comparison with the corresponding original market prices, they finally adjust down (up) toward the long-run equilib-rium. The relationships between depositary receipts and underlying securities are the most important factor in explaining the prices of the depositary receipts. The price deviations between DRs and underlying securities, captured by the error cor-rection terms, negatively affect the DR returns in a larger magnitude for Hong Kong firms than for Taiwan firms. This implies that information transmits and price adjusts more quickly in free-entry markets. For Taiwanese firms with noncointe-grated pairs in the VAR model, the lagged performance of the DRs and underlying securities becomes important in the absence of a long-term equilibrium.
We also found that the value of the local market index (the market where the underlying securities are listed) is refiected in depositary receipt prices, so investors may incorporate this information when forming their investment strategy. We did not find robust evidence that global risk factors explain DR returns.
More interestingly, in the VAR and VECM models, our empirical results in-dicate that the QFII ownership ratio change, the overseas investor demand proxy, positively and incrementally explains the DR prices. This implies that the "QFII ownership ratio" has incremental information content for DR prices for firms listed in areas with restrictions on foreign ownership.
Although we found a persistent DR price premium for Taiwanese firms, we did not provide a precise examination of DR premiums. This is an interesting question for future research. In addition, in Taiwan, with foreign ownership restric-tions, DRs can be converted back to underlying securities directly, so DRs traded at a discount should eventually be converted back into underlying securities. The DR discount may exist for only a period of time, and then the outstanding DRs in foreign market will flow back to the home market until the price discount is elim-inated. Since our research does not examine the "fiowback effect" explicitly, ad-ditional studies are required to examine the correlation between the DR discount and DR outstanding shares to confirm its existence and importance.
REFERENCES
Alder, M., and B. Dumas. 1983. "International Portfolio Choice and Corporation Finance: A Synthesis." Journal of Finance 38:925-984.
Alexander, G. S., C. Eun, and S. Janakiramanan. 1988. "International Listings and Stock Returns: Some Empirical Evidence." Journal of Financial and Quantitative Analysis 23:135-151.
Ali, A., and P. F. Pope. 1995. "The Incremental Information Content of Earnings, Funds Flow, and Cash Flow: The UK Evidence." Journal of Business Finance and Accounting 22:19-34. Bailey, W., Y. P. Chung, and J.-K. Kang. 1999. "Foreign Ownership Restrictions and Equity Price
Premiums: What Drives the Demand for Cross-border Investments?" Journal of Financial and Quantitative Analysis 34:489-511.
Chan, L., and J. Lakonishok. 1993. "Institutional Trades and Intraday Stock Price Behavior." Journal of Financial Economics 33:173-200.
Davidson, R., and J. G. MacKinnon. 1993. Estimation and Inference in Econometrics. Oxford University Press.
Engle, R. F., and C.W.J. Granger. 1987. "Co-integration and Error Correction: Representation, Esti-mation and Testing." Econometrica 55:251-276.
Errunza, V., and E. Losq. 1985. "International Asset Pricing under Mild Segmentation: Theory and Test." Journal of Finance 40:105-124.
Eun, C. S., and S. Janakiramanan. 1986. "A Model of International Asset Pricing with a Constraint on the Foreign Equity Ownership." Journal of Finance 41:897-914.
Eun, C. S., and S. Shim. 1989. "International Transmission of Stock Market Movements." Journal of Financial and Quantitative Analysis 24:241-256.
Fischer, K., and A. Palasvirta. 1990. "High Road to a Global Marketplace: The International Trans-mission of Stock Market Fluctuations." The Financial Review 25:371-394.
Foerster, S. R., and G. A. Karolyi, 1999. "The Effects of Market Segmentation and Investor Recognition on Asset Prices: Evidence from Foreign Stocks Listing in the United States." Journal of Finance 54:981-1014.
Froot, K. A., G. J. O'Connell, and M. S. Seasholes. 2001. "The Portfolio Flows of International Inves-tors." Journal of Financial Economics 59:151-193.
Greene, W. H. 1993. Econometric Analysis. Englewood Cliffs, N.J.: Prentice Hall.
Hietala, P. T. 1989. "Asset Pricing in Partially Segmented Markets: Evidence from the Finnish Market." Journal of Finance 44:697-718.
Hilliard, J. E. 1979. "The Relationship between Equity Indices on World Exchanges." Journal of Fi-nance 34:\O3-\14.
Jeon, B. N., and T. C. Chiang. 1991. "A System of Stock Prices in World Stock Exchanges: Common Stochastic Trends for 1975-1990?" Journal of Economics and Business 43:329-338. Jiang, C. X. 1998. "Diversification with American Depository Receipts: The Dynamics and the Pricing
Factors." Journal of Business Finance and Accounting 25:683-699.
Johansen, S. 1995. Likelihood-Based Inference in Cointegrated Vector Autoregressive Models. Oxford University Press.
Jones, C , and M. Lipson. 1999. "Execution Costs of Institutional Equity Orders." Journal of Financial Economics 51:173-194.
Kato, K., S. Linn, and J. Schallheim. 1991. "Are There Arbitrage Opportunities in the Market for American Depositary Receipts?" Journal of International Financial Markets Institutions and Money 1:73-89.
Keim, D., and A. Madhavan, 1997. "Transaction Costs and Investment Style: An Inter-Exchange Anal-ysis of Institutional Equity Trades." Journal of Financial Economics 46:265-292.
Kim, M., A. C. Szakmary, and I. Mathur. 2000. "Price Transmission Dynamics between ADRs and Their Underlying Foreign Securities." Journal of Banking and Finance 24:1359-1382. Koch, P. D., and T. W. Koch. 1991. "Evolution in Dynamic Linkages Across Daily National Stock
Indexes." Journal of International Money and Finance 10:231-251.
Miller, D. P. 1999. 'The Market Reaction to International Cross-Listing: Evidence from Depositary Receipts." Journal of Financial Economics 51:103-123.
Solnik, B. 1974. "The International Pricing of Risk: An Empirical Investigation of the World Capital Market Structure." Journal of Finance 29:365-378.
Stulz, R. 1981. "On the Effects of Barriers to International Asset Pricing." Journal of Finance 25:783-794.
Stulz, R., and W. Wasserfallen, 1995. "Foreign Equity Investment Restrictions and Shareholder Wealth Maximization: Theory and Evidence." Review of Financial Studies 8:1019-1058.
Tsang, S. 2000. "Political Developments in Hong Kong Since 1997 and Their Implications for Mainland China and Taiwan." American Asian Review 18:37-68.
Warther, V. 1995. "Aggregate Mutual Fund Flows and Security Returns." Journal of Financial Eco-nomics 39:209-235.
Webb, S. E., D. T. Officer, and B. E. Boyd. 1995. "An Examination of International Equity Markets Using ADRs." Journal of Business, finance and Accounting 22:415—430.
White, H. 1980. "Heteroskedasticity-Consistent Covariance Matrix Estimator and a Direct Test for Heteroskedasticity." Fconometrica 48:817-838.