國
立
交
通
大
學
企業管理碩士學程
碩
士
論
文
台北女性消費者對百貨專櫃保養品牌認知之研究
A Study of Taipei city female consumers’ perception towards
8 department store skincare brands
研 究 生:洪嘉惠
指導教授:唐瓔璋 教授
National Chiao Tung University
Global MBA
Master Thesis
A Study of Taipei city female consumers’ perception towards
8 department store skincare brands
Student: Chia-Hui Hung
Advisor: Prof. Ying-Chan Tang
i
Abstract
The skin care market in Taiwan is extremely competitive with most of the major international players involved in market development. My study is to use brand equity proposed by Aaker as the attributes to depict and analyze consumers’ preference over top 8 department stores skincare brands which are chosen according to the best-selling brands revealed by international magazine “Marie Claire” in 2009. Consumers decide
with their purchases, based on whatever factors they think important, which brands have more equity than other brands, thus measuring brand equity provides a useful strategic function and guide marketing decisions to marketers. In my study, respondents are examined how they perceived 8 department store skin care brands by using MDS as my analyzing tool. From the result of my study, SHISEIDO is the market leader, which is also most likely to be the ideal brand in the market. ESTEE LAUDER, LANCOME and KIEHL’S are the market challengers. SKII, BIOTHERM and CLINIQUE are the market
followers. Finally, SISLEY which positions itself as premium and high-end skin care brand can be viewed as a market nicher.
Acknowledgement
This thesis cannot be finished without endless support and help from many people who are gratefully acknowledged here.
First of all, I am heartily thankful to my advisor, Professor Tang, who gave his guidance and support during thesis writing. Also, I would like to appreciate my classmates
especially Abby, Athena, May and my dear friends for always encouraging me and listening to my complaint.
My great appreciation to 妍馨, 珠宜, and 哲彰 in helping me collecting
questionnaire.
iii
Table of Contents
Abstract…………..………..………... ... i
Acknowledgement………..………... ii
Tables of Contents………..………... ... iii
List of Tables ... v
List of Figures………..………... ... vi
Chapter 1 Introduction ... 1
1.1 Research Background ... 1
1.2 Problem Statement ... 1
Chapter 2 Literature Review ... 3
2.1 Consumer buying behavior ... 3
2.2 Brand Positioning ... 4
2.3 Brand Equity ... 5
2.4 Industry Review: Taiwan skincare product market ... 10
2.5 Top 8 Brands ... 11
Chapter 3 Research Method ... 15
3.1 Framework ... 15
3.2 Data collection... 15
3.3 Questionnaire Design ... 15
Chapter 4 DATA ANALYSIS and RESULT ... 20
4.1 Descriptive Statistical Analysis ... 20
4.2 Reliability/Validity Test ... 27
4.3 Brand Equity Measurement Over 8 Brands ... 27
4.4 Perceptual Map ... 39
Chapter 5 CONCLUSIONS and MANAGERIAL APPLICATIONS ... 40
5.1 A Summary of Major Findings ... 40
5.1.1 Market Leaders: SHISEIDO ... 40
5.1.2 Market Challengers: ESTEE LADUER, LANCOME and KIEHL’S ... 43
5.1.3 Market Followers: SKII, CLINIQUE and BIOTHERM ... 50
5.1.4 Market Nicher: SISLEY ... 57
5.2 Implications of the Findings ... 59
5.3 Limitations and Future Research ... 60
Reference... 61
v
List of Tables
Table 2.1 Indicators of Brand Equity Measurement ... 9
Table 2.2 Ranking of the Best Selling Brands ... 14
Table 3.1 Variables List ... 16
Table 4.1 Descriptive statistics-Marriage ... 20
Table 4.2 Descriptive Statistics-Age ... 21
Table 4.3 Descriptive statistics-Occupation ... 21
Table 4.4 Descriptive statistics-Monthly income ... 22
Table 4.5 Descriptive statistics-Education level ... 22
Table 4.6 Descriptive statistics- Frequency of buying skincare products ... 23
Table 4.7 Descriptive statistics-Average spending ... 23
Table 4.8 Descriptive statistics-Key factors of buying skincare products ... 24
Table 4.9 Descriptive statistics-Skincare concern ... 25
Table 4.10 Descriptive statistics-Daily used skincare product ... 25
Table 4.11 Descriptive statistics-Brand awareness ... 26
Table 4.12 Descriptive statistics- Recently bought brands ... 26
Table 4.13 MANOVA results of overall attributes and each attribute ... 28
Table 4.14 Pair-wise comparison-Q9_1 ... 29
Table 4.16 Pair-wise comparison-Q9_3 ... 30
Table 4.17 Pair-wise comparison-Q9_4 ... 31
Table 4.18 Pair-wise comparison-Q9_5 ... 31
Table 4.19 Pair-wise comparison-Q9_6 ... 32
Table 4.20 Pair-wise comparison-Q9_7 ... 32
Table 4.21 Pair-wise comparison-Q9_8 ... 33
Table 4.22 Pair-wise comparison-Q9_9 ... 34
Table 4.23 Pair-wise comparison-Q9_10 ... 34
Table 4.24 Pair-wise comparison-Q9_11 ... 35
Table 4.25 Pair-wise comparison-Q9_12 ... 35
Table 4.26 Pair-wise comparison-Q9_13 ... 36
Table 4.27 Pair-wise comparison-Q9_14 ... 36
Table 4.28 Pair-wise comparison-Q9_15 ... 37
vii
List of Figures
Figure 2.1 Model of Consumer Buying Behavior ... 3
Figure 2.2 Brand Equity Model ... 7
Figure 3.1 Research Framework ... 15
Chapter 1 Introduction
1.1 Research Background
Currently, women control about $20 trillion in annual consumer spending, and it is predicted that this figure could mount as high as $28 trillion in the next five years. In aggregate, women represent a growth market bigger than China and India
combined—more than twice as big, in fact (Silverstein & Sayre, 2009). In Taiwan, according to a report from the Department of Statistics, Ministry of the Interior (2009), Taiwan’s female population is expected to surpass that of male in 5 years. Moreover,
marriage rate for women dropped from 8.19% in 2000 to 5.07% in 2009. Meanwhile, the average income for women has increased by 7% during the last 10 years. These facts together indicate that there are more and more independent young Taiwan women with considerable income willing to spend a large proportion of their savings on themselves. Women in Taiwan have become a key segment to attract along with the truth that their purchasing power will continue to rise: women 18~39 will control NT$44 billion in annual consumer spending in 2014 according to AC Nielsen. Among all the promising female markets, beauty products and services promote a sense of emotional well-being in women. In fact, based on Pollster Online Survey’s report, for the working female aged from 25 to 49 years, the facial skincare product is in the highest purchase
frequency category whether in terms of physical stores or online stores. It seems to be a lucrative chance to initiate spending of female consumers.
1.2 Problem Statement
The skin care market in Taiwan is extremely competitive with most of the major international players involved in market development. Among all the channels, department stores account for 40.1% of the annual sales. My study is to use brand equity proposed by Aaker as the attributes to depict and analyze consumers’ preference
best-selling brands revealed by international magazine “Marie Claire” in 2009. In fact, one recent similar study was conducted in 2005 using 6 best selling department store skincare brands at that time as research objects. But 5 years passed, the skincare market in Taiwan also has changed dramatically. First of all, some leading brands in 2005 such as KANEBO and SHU UEMURA have no longer kept their leading positions. In addition, Taiwan female consumers have also changed. More and more single and educated female consumers gain greater sufficiency and confidence. They are more willing to spend money on the products and services which can who their sense of beauty. Therefore, my study is to create a conceptual map to identify brand's
competitive sets and serve as a guidepost for competitive marketing strategy in order to serve female market more efficiently.
Chapter 2 Literature Review
2.1 Consumer buying behavior
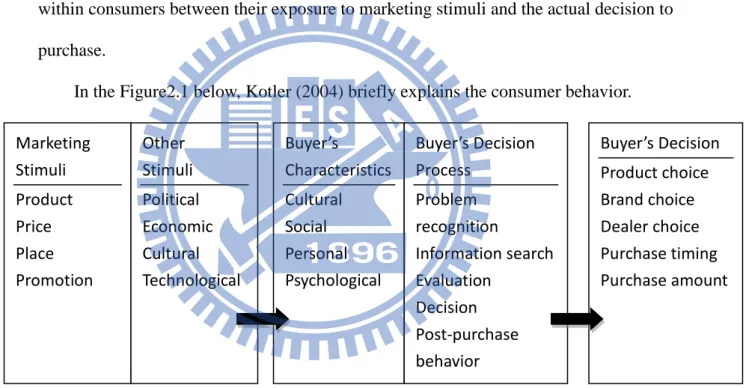
The study of how and why people purchase goods and services is termed consumer buying behavior. Consumer behavior is affected by many uncontrollable factors. The term covers the decision-making processes from those that precede the purchase of goods or services to the final experience of using the product or service. Models of consumer buying behavior organize the various influences on, and the process of, the buying decision. Researchers attempt to understand the “black box” of what happens within consumers between their exposure to marketing stimuli and the actual decision to purchase.
In the Figure2.1 below, Kotler (2004) briefly explains the consumer behavior.
Figure 2.1 Model of Consumer Buying Behavior (Kotler & Armstrong, Principles of Marketing, 1999)
The model suggests consumers will respond in particular ways to different
stimulus including marketing stimuli(4Ps) and other stimuli(PEST), then the consumer's
personal characteristics and decision-making process will interact with the stimulus before a particular behavioral response is generated. The marketing stimuli includes 4Ps which are planned and processed by companies, whereas other stimulus are given by Marketing Stimuli Product Price Place Promotion Other Stimuli Political Economic Cultural Technological Buyer’s Characteristics Cultural Social Personal Psychological Buyer’s Decision Process Problem recognition Information search Evaluation Decision Post-purchase behavior Buyer’s Decision Product choice Brand choice Dealer choice Purchase timing Purchase amount
social factors, based on the economical, political and cultural circumstances of a society. Once the consumer recognizes a problem, he/she will start to search for information on products and services that can solve that problem. Belch and Belch (2007) explain that consumers undertake both an internal (memory) and an external search. Sources of information usually include personal sources, commercial sources, public sources, and personal experience.
In my study, I use market stimuli variables including “Price”, “Functions”, “Package”, “Element”, “Brand Awareness” , “Discount”, “Advertisement”,
“Spokesperson”, “Staff Service” and information source variables such as “Relatives
and Friends”, “Past Experience” and “Internet” to find out which factor has greater impact on consumers’ decisions of buying skin care products.
2.2 Brand Positioning
According to American Marketing Association (1960), a brand is a name, term, sign, symbol, or design, or a combination, of them which is intended to identify the goods or services of one seller or a group of sellers and to differentiate them from those of competitors. The famous advertising copywriter and ad agency founder David Ogilvy also defines brand as “The intangible sum of a product's attributes: its name, packaging, and price, its history, its reputation, and the way it's advertised.” A “brand” is not a
thing, a product, a company or an organization. A brand does not exist in the physical world—it is a mental construct. A brand can best be described as the sum total of all human experiences, perceptions and feelings about a particular thing, a product or an organization. Brands exist in the consciousness—of individuals and of the public. (Gregory, 1997). As per Kepferer (1992), a brand is complex symbol and capable of conveying up to six dimensions or meanings: 1. Physique: A brand has physical
qualities such as “What does it do?” or “What does it look like?” 2. Personality: A brand has its own personality, for example “What brand would be if it were a person?” 3.
Culture: A brand has its own culture. Set of values feed the brand’s inspiration. 4. Relationship: A brand has its own relationship, which means exchanges between people and brand service sectors and retailers. 5. Reflection: A brand is a reflection. It produces a reflection or image of the buyer or user. Customer is reflected as it wishes to be seen from using the brand. Consumers use brands to build their own identities. 6. Self-Image: A brand speaks to our self image Self image is the target’s own internal mirror. Attitude toward the brand fosters an inner relationship with self.
The term ”Positioning” was first published in 1969 by Jack Trout in the paper "Positioning is a game people play in today’s me-too market place" in the publication Industrial Marketing, in which the case is made that the typical consumer is
overwhelmed with unwanted advertising, and has a natural tendency to discard all information that does not immediately find a comfortable (and empty) slot in the consumers mind. ”Positioning” differs from the older term “image” in that it implies a
frame of reference, the reference point usually being the competition. Moreover, the position decision is often the crucial strategic decision for a company or brand because positioning can be central to customers’ perception and choice decision. Further, since
all the elements of the marketing program can potentially affect the position, it is usually necessary to use a positioning strategy as a focus for the development of the marketing program. A clear positioning strategy can ensure the elements of the marketing program are consistent and supportive.
2.3 Brand Equity
The concept of brand equity began to be used widely in the 1980s by advertising practitioners (Barwise, 1993), and was then popularized by Aaker (1991) though his bestselling book on the subject. Other important academic contributors throughout the 1990s were Srivastava and Shocker (1991), Kapferer (1992), and Keller (1993, 1998),
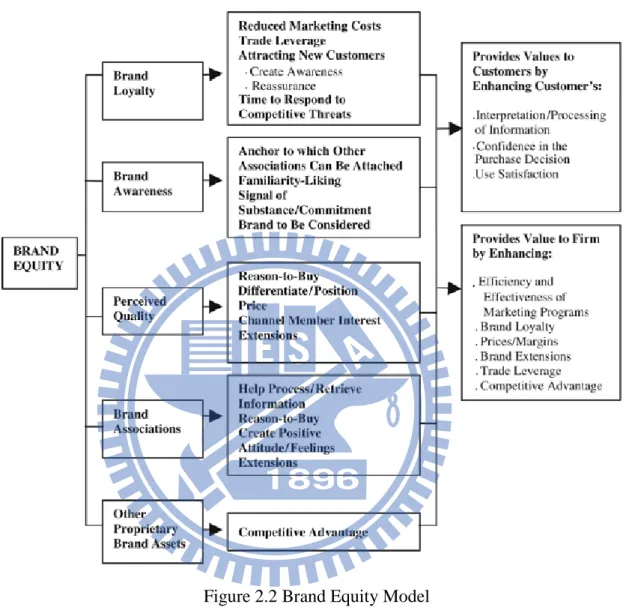
some dimensions of which have been empirically tested in the literature. David Aaker (1991) defined brand equity as a set of assets or liabilities that are linked to the brand and add or subtract value to the product or service being offered. Besides, he also identified five dimensions of brand equity which are brand loyalty, brand awareness, perceived quality, brand association other than quality and other proprietary brand assets. (See Figure2.2) The definition of each dimension is described as below.
(a) Brand loyalty: Aaker (1991) defines brand loyalty as a situation which reflects how likely a customer will be to switch to another brand, especially when that brand makes a change, either in price or in product features.
(b) Brand awareness: Aaker( 1991) defines brand awareness as “the ability of the potential buyer to recognize and recall that a brand is a member of a certain product category”. According to Keller (2003), brand awareness plays an important role in
consumer decision making by bringing three advantages which are learning advantages, consideration advantages, and choice advantages. Customer-based brand equity occurs when the consumer has a high level of awareness and familiarity with the brand and holds some strong, favorable, and unique brand associations in memory.
(c) Perceived quality: Perceived quality is defined as “the customer's perception of the overall quality or superiority of a product or service with respect to its intended purpose, relative to alternatives” (Aaker, 1991). Perceived quality is a perception by
customers. It is a competitive necessity and many companies today have turned customer-driven quality into a strong strategic weapon.
(d) Brand association other than quality: A brand association is “anything linked in memory to a brand” (Aaker, 1991). Aaker has listed these benefits as follows:
helping to process/retrieve information, differentiating the brand, generating a reason to buy, creating positive attitudes/feelings, and providing a basis for
extensions.
(e) Other proprietary brand assets: That is, patents, trademarks, channel relationships, etc.
Figure 2.2 Brand Equity Model
(Aaker D. A., Managing Brand Equity, Free Press, pp17, 1991)
More recently, Keller (1998) has proposed customer based brand equity as “the differential effect that brand knowledge has on customer response to the marketing of that brand”. Brand-equity assets generally add or subtract value for customers. They can
help customers interpret, process, and store huge quantities of information about products and brands. They also can affect customers' confidence in the purchase decision due to either past-use experience or familiarity with the brand and its
has the potential to add value for the firm, too. First, it can enhance marketing programs to attract new customers or recapture old ones. A promotion, for example, which
provides an incentive to try a new flavor or new use will be more effective if the brand is familiar, and if the consumer has no doubt of brand quality. Second, the four brand equity dimensions including brand awareness, perceived quality, brand associations, and other proprietary brand assets can enhance brand loyalty. These four dimensions can provide reasons to buy and affect use satisfaction also. Even when they are not critical to brand choice, they can reassure reducing the incentive to try others. Enhanced brand loyalty is especially important in buying time when competitors innovate and obtain product advantages. Brand loyalty is both one of the dimensions of brand equity and is affected by brand equity. Third, brand equity will usually allow higher margins by permitting both premium pricing and reducing reliance on promotions. In many cases, the elements of brand equity serve to support premium pricing. Further, a brand with a disadvantage in brand equity will have to invest more in promotional activity,
sometimes just to maintain its position in the distribution channel. Fourth, brand equity provides value to the firm. It should be noted that there exists similar interrelationships among the other brand equity dimensions. For example, perceived quality could be influenced by brand awareness, by brand associations, and by brand loyalty. Fifth, brand equity can provide leverage in the distribution channel. Like customers, the trade has less uncertainty dealing with a proven brand name that has already achieved recognition and associations. A strong brand will have an advantage in gaining both shelf facings and cooperation in implementing marketing programs. Finally, brand-equity assets provide a competitive advantage that often presents a real barrier to competitors.
Measuring Brand Equity
Since brand equity is important both to customers and firms, knowing how to measure sources of brand equity can guide marketing strategies and assess the value of
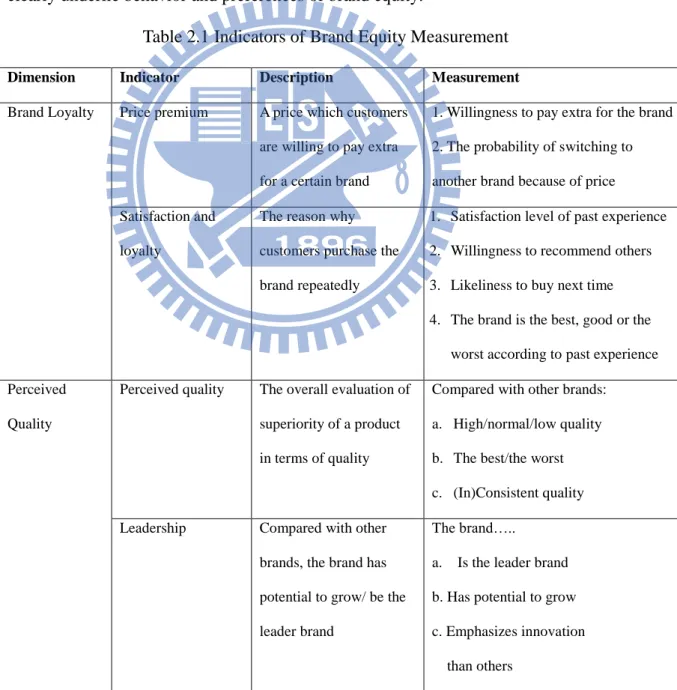
brand. To measure each dimension of brand equity, Aaker (1991) proposed 9 indicators and the measurement technique for each indicator (See Table2.1). Brand equity can be measured in terms of 9 indicators which are price premium, satisfaction and loyalty, perceived quality, brand leadership, brand awareness, perceived quality, brand
personality, company association, and differentiation. This method indeed incorporates both perceptual and behavioral dimensions. The advantage of combining both consumer perceptions and actions into a single marketing measure of brand equity is that attitudes alone are generally a poor predictor of marketplace behavior and consumer perceptions clearly underlie behavior and preferences of brand equity.
Table 2.1 Indicators of Brand Equity Measurement
Dimension Indicator Description Measurement
Brand Loyalty Price premium A price which customers are willing to pay extra for a certain brand
1. Willingness to pay extra for the brand 2. The probability of switching to another brand because of price Satisfaction and
loyalty
The reason why customers purchase the brand repeatedly
1. Satisfaction level of past experience 2. Willingness to recommend others 3. Likeliness to buy next time 4. The brand is the best, good or the
worst according to past experience Perceived
Quality
Perceived quality The overall evaluation of superiority of a product in terms of quality
Compared with other brands: a. High/normal/low quality b. The best/the worst c. (In)Consistent quality Leadership Compared with other
brands, the brand has potential to grow/ be the leader brand
The brand….. a. Is the leader brand b. Has potential to grow c. Emphasizes innovation than others
Brand Awareness
Brand awareness Level of awareness and familiarity with the brand
1. Do customers know the brand? 2. Level of familiarity
3. Ranking of the brand in its product category
Brand association
Perceived value Consumers' overall evaluation of the utility of a brand based on what is received and given
1. Does the brand deliver higher value (other than price)?
2. Compared to competitors, there’s no reason not to buy
Brand personality The set of human characteristics associated with a brand
1. Is the brand funny, exciting, etc? 2. Does the brand have good brand
inheritance? Company
association
The image of the brand company
1. Is the brand company reliable? 2. The reputation of the brand company Differentiation Synthetic indicator of
brand association
Is the brand different from competitors?
Since brand equity can be used to describe both the value of the brand and the brand's component values depending on associations made by consumers, it is a good way to analyze relative positions of different brands on consumers’ minds. Therefore, my study will use the indicators of measuring brand equity proposed by David Aaker to map 8 brands by MDS which is introduced as following.
2.4 Industry Review: Taiwan skincare product market
According to Datamonitor report, skin care products dominate the Taiwanese market (41%), followed by color cosmetics (13.4%) and hair care products (13.7%). The size of Taiwan’s cosmetics, skincare and toiletries market is estimated at around
NTD 60~80 billions. In general, the market still remains the multi-brand competition status, and international companies enjoy strong positions accounting for 94% of the market. Japanese brands entered the market early and their influence has always been especially strong with brands such as SHSEIDO, SHU UEMURA, KANEBO and
KOSE well recognized. Western brands, including L'Oreal, ESTEE LAUDER and PROCTOR & GAMBLE brand lines are also now well established. In terms of product function, skin whitening, anti-aging and moisturizer are the three most popular products. Consumers buy skincare products mainly from department store (40.1%), followed by direct sales (17.7%) and drugstore (14.5%).
2.5 Top 8 Brands
Every year, international magazine “Marie Claire” discloses best-selling cosmetics brands in department stores according to actual sales volume provided by major
department stores. Last year, Taiwan Marie Claire revealed the top 100 beauty prize of popularity of 2009. In my study, I’ll pick up 8 brands from the results of Marie Claire magazine to examine consumers’ perceptions towards these 8 brands.
2009 top 100 beauty prize of popularity
2009 top 100 beauty prize of popularity based on aggregate sales volume offered by ten departments stores including SOGO Chung Hsiao Store, SOGO Fu Hsin Store, FE21’ Panchiao Store, FE21’ Taoyuan Store, FE21’ Hsinchu Store, SOGO Taichung
Store, Shin Kong Mitsukoshi Tainan New Life Square, Shin Kong Mitsukoshi Tainan Jhongshan Branch, Hanshin Department Store, and Hanshin Arena Store during the period of June 2008 to May 2009. The results are shown as below in the order of different categories.
A. Category: Toners
Brand Product Name Function Sales Price
KOSÉ Medicated Sekisei whitening 46,624 NT1,180/200ml
ALBION Skin conditioner Essential moisturizing 22,102 NT2,900/330ml KIEHL’S Calendula Herbal Extract Toner cleansing 20,108 NT1,100/4oz KIEHL’S Blue Astringent Herbal Lotion cleansing 17,606 NT540/4oz CLINIQUE Clarifying Moisture Lotion cleansing 13,929 NT780/200ml
SHISEIDO
INTERNATIONAL
Eudermine moisturizing 11,940 NT2,000/200ml KIEHL’S Cucumber Herbal Alcohol-Free Toner cleansing 11,307 NT500/4oz ESTĒE LAUDER Vita-Mineral Energy Lotion anti-wrinkle 10,594 NT1,650/200ml
SHISEIDO TOKYO
Elixir Superieur Whtening CE Lotion I ・II
whitening 10,161 NT1,200/170ml SHISEIDO TOKYO Revital Retino Science Lotion AA anti-wrinkle 9,026 NT2,500/125ml SK-II Facial Treatment Clear Lotion whitening 9,011 NT1,400/150ml SHISEIDO TOKYO UV White Whitening softener whitening 8,652 NT1,200/150ml LANCÔ ME Hydra Zen Neurocalm Lotion moisturizing 7,170 NT1,500/200ml
B. Category: Lotion and Cream
Brand Product Name Function Sales Price
SK-II Facial Treatment Essence moisturizing 39,658 NT3,100/150ml SHISEIDO TOKYO
Bio-Performance Advanced Super Revitalizer(Cream)N
anti-wrinkle 32,684 NT2,000/50ml CLINIQUE Moisture Surge Extended Thirst Relief moisturizing 27,811 NT1,000/30ml
KOSÉ Madicated SEKKISE whitening 21,788 NT1,350/140ml
SK-II SK-II Signs Treatment Totality anti-wrinkle 19,936 NT3,600/80g SHISEIDO TOKYO
Elixir Superieur Whitening CE Emulsion I・II
whitening 12,402 NT1,300/130ml
CLINIQUE
Dramatically Different Moisturizing Lotion
cleansing 11,759 NT800/50ml BIOTHERM Aquasource Non Stop PNM 5000L moisturizing 10,852 NT1,500/50ml SISLEY Ecological Compound anti-wrinkle 10,843 NT5,500/125ml
ALBION EXAGE WHITE whitening 9,201 NT1,980/200ml
~H2O+ Face OasisTM Hydrating Treatment moisturizing 8,429 NT1,450/50ml SHISEIDO TOKYO UV White Whitening Moisturizer whitening 8,317 NT1,300/100ml KIEHL’S Ultra Facial Cream moisturizing 7,673 NT980/50ml
CLARINS Shaping Facial Lift anti-wrinkle 7,228 NT2,000/50ml
C. Category: Essence
Brand Product Name Function Sales Price
ESTĒE LAUDER
Advanced Night Repair Synchronized Recovery Complex
anti-wrinkle 32,071 NT2,200/30ml
ESTĒE LAUDER
Perfectionist [CP+] Wrinkle Lifting Serum Corrector for
Lines/Wrinkles/Age Spots
moisturizing 26,524 NT2,500/30ml
SHISEIDO TOKYO Melanoreduce 2 whitening 17,733 NT3,200/45g COSME DECORTE Moisture Liposome moisturizing 17,310 NT2,500/40ml ESTĒE LAUDER Idealist Skin Refinisher anti-wrinkle 15,881 NT1,900/30ml SK-II SK-II Whitening Source Dermdefinition whitening 15,494 NT3,000/30ml LANCÔ ME Blanc Expert GN-WHITE™ Spot Erase whitening 13,888 NT3,100/30ml ELIZABETH
ARDEN
Fortifying Capsules anti-wrinkle 8,109
NT2,700/50 pillow
Choosing 8 brands
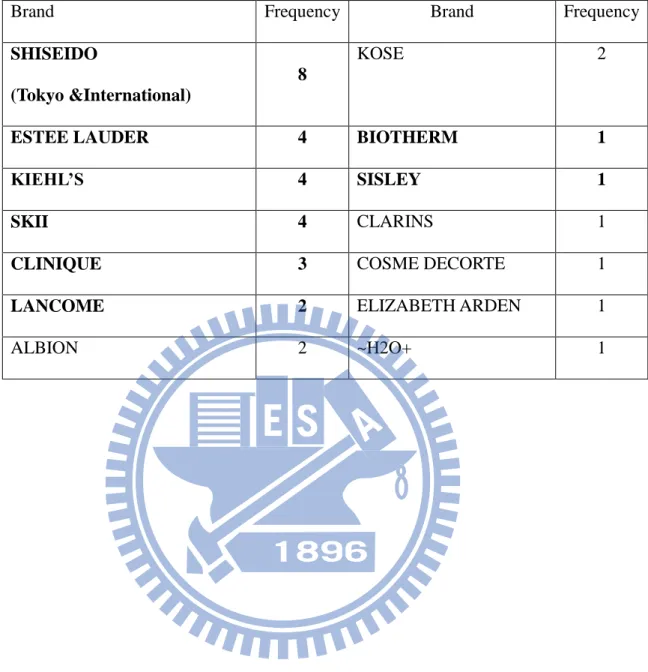
To see which brands are selling better than others, I listed the appearance frequency of each brand in the rankings as below. Finally, I picked up 8 brands including SHISEIDO Co. owned brand-SHISEIDO, Estée Lauder Companies, Inc owned brands-ESTEE LAUDER, CLINIQUE, L'Oreal group owned
brands-LANCOME, BIOTHERM, and KIEHL’s, Procter and Gamble co. owned brand-SKII, and family run brand- SISLEY as my variable brands in my study. Currently, L'Oreal group, Estée Lauder Companies, P&G Co. and SHISEIDO Co. are the 4 largest cosmetics companies in the world.
Table 2.2 Ranking of the Best Selling Brands
Brand Frequency Brand Frequency
SHISEIDO
(Tokyo &International)
8
KOSE 2
ESTEE LAUDER 4 BIOTHERM 1
KIEHL’S 4 SISLEY 1
SKII 4 CLARINS 1
CLINIQUE 3 COSME DECORTE 1
LANCOME 2 ELIZABETH ARDEN 1
Chapter 3 Research Method
3.1 Framework
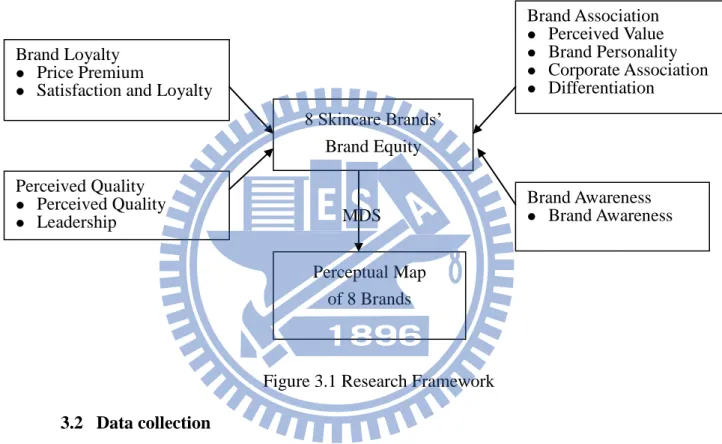
Respondents are examined how they perceived 8 department store skin care brands over 15 attributes based on 4 dimensions of brand equity. Later, a perceptual map is created by the result of brand equity measurement using MDS. From the perceptual map, we can find which brands are close to the ideal brand and which brands are not.
Figure 3.1 Research Framework
3.2 Data collection
To collect the data from the skin care customers, a questionnaire is conducted in Taipei city. In order to save cost and time, my survey was in the form of online survey and paper questionnaires. The survey focused on 19~50 year old women who are the most potential customers who will buy skin care products from department stores. Lastly, the questionnaire designed for this study was originally drafted in traditional Chinese.
3.3 Questionnaire Design
My questionnaire can be divided into four parts. The first part focuses on 8 Skincare Brands’
Brand Equity Brand Loyalty
Price Premium
Satisfaction and Loyalty
Brand Association Perceived Value Brand Personality Corporate Association Differentiation Perceived Quality Perceived Quality Leadership Brand Awareness Brand Awareness Perceptual Map of 8 Brands MDS
are as such “How often do you buy skin care products at department stores?”, and the average amount of money spending on skin care products per time. In the second part, questions are designed to know what factor influences consumers’ most while
purchasing skin care at the department store, and what consumers value most in terms of skin care. For the third part, respondents are asked to evaluate 8 brands according to their preference and using experiences with 5-point Likert scale. 15 attributes used in the evaluations are based on Aaker’s brand equity. Finally, the fourth part is the simple survey of each respondent’s basic demographic information including age, marriage,
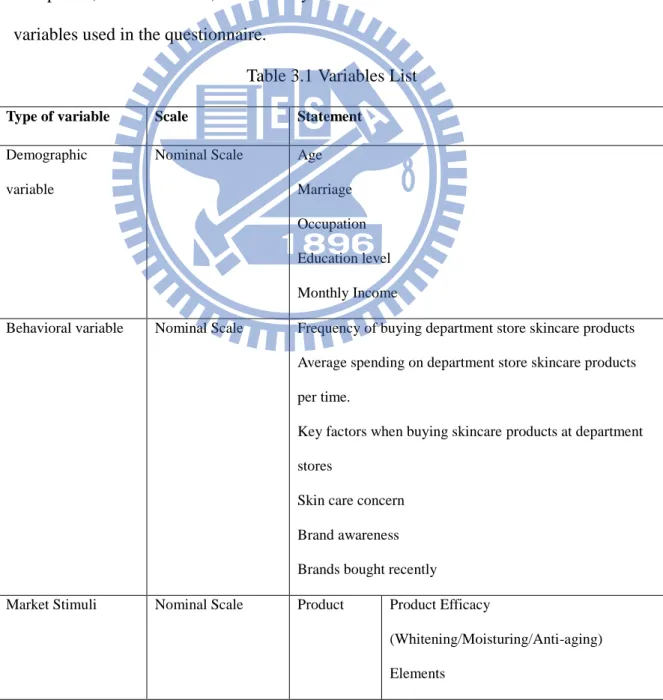
occupation, education level, and monthly income. The table below summarizes all the variables used in the questionnaire.
Table 3.1 Variables List
Type of variable Scale Statement
Demographic variable
Nominal Scale Age Marriage Occupation Education level Monthly Income
Behavioral variable Nominal Scale Frequency of buying department store skincare products Average spending on department store skincare products per time.
Key factors when buying skincare products at department stores
Skin care concern Brand awareness Brands bought recently
Market Stimuli Nominal Scale Product Product Efficacy
(Whitening/Moisturing/Anti-aging) Elements
Brand Awareness Package Price Price Place Staff Service Promotion Promotion activity
Spokesperson
Advertisement(TV, magazines, etc) Source of information Nominal Scale Family/Friends
Internet Past Experience
8 brands Nominal Scale SHISEIDO, ESTEE LAUDER, LANCOME, SKII, CLINIQUE, SISLEY, BIOTHERM, KIEHL’S
Brand Loyalty Ordinal Scale (Five-point Likert Scale)
Price Premium Satisfaction Perceived Quality Perceived Quality
Leadership
Brand Awareness Brand Awareness
Brand Association Perceived Value Brand Personality Corporate Association Differentiation
3.4 Data Analysis Method
In my study, I use descriptive statistics, MANOVA, and MDS to analyze the data collected through questionnaires with an alpha level=0.1.
Descriptive Statistics
Descriptive statistics are used to describe the main features of a collection of data in quantitative terms. In my study, I use simple descriptive statistics such as frequency
to describe demographic characteristics and consumers’ buying behavior of my study sample.
One-Way MANOVA(Multivariate analysis of variance)
One-way ANOVA is used to test for differences among two or more independent groups. With this model, the dependent variable is continuous in nature, whereas the independent variables are categorical. It evaluates the effect of a single factor on a single dependent variable. Multi-way analysis of variance (MANOVA) is an extension of the one-way model that examines the effect of the grouping independent variable on multiple dependent variables. In this study, a one-way MANOVA, ANOVAs for each dependent variable and pairwise comparisons were conducted. Pairwise comparison generally refers to any process of comparing entities in pairs to judge which of each pair is preferred, or has a greater amount of some quantitative property. The method of pairwise comparison is used in the scientific study of preferences, attitudes, voting systems, social choice, public choice, and multiagent AI systems. In my study, pariwaise comparison was used to determine which brand received a greater evaluation on each attribute.
Multidimensional Scaling (MDS)
Generally, there are two scaling techniques commonly used in statistics which are comparative scales and noncomparative scales. Comparative scales involve the direct comparison of stimulus objects. Comparative scale data must be interpreted in relative terms and have only ordinal or rank order properties. In noncomparative scales, each object is scaled independently of the others in the stimulus set. The resulting data are generally assumed to be interval or ratio scaled. Both techniques have pros and cons. Relative advantages of comparative scales
- Same known reference points for all respondents. - Easily understood and can be applied.
- Involve fewer theoretical assumptions
- Tend to reduce halo or carryover effects from one judgment to another. Relative disadvantages of comparative scales
- Ordinal nature of the data
- Inability to generalize beyond the stimulus objects scaled
Multidimensional scaling (MDS) is a class of procedures for representing perceptions and preferences of respondents spatially by means of a visual display. Perceived or psychological relationships among stimuli are represented as geometric relationships among points in a multidimensional space. These geometric
representations are often called spatial maps. The axes of the spatial map are assumed to denote the psychological bases or underlying dimensions respondents use to form perceptions and preferences for stimuli. In marketing, MDS is usually for taking the preferences and perceptions of respondents and representing them on a visual grid, called perceptual maps. In my study, MDS is used to plot the 9 brands including the ideal brand on a map such that those brands that are perceived to be very similar to each other in terms of brand equity are placed near each other on the map, and those brands that are perceived to be very different from each other are placed far away from each other on the map. Perceptual mapping can offer additional insight into the current position of one product and its potential in the face of competition. In this way, we can find out which brands are closer to the ideal brand and which are not in consumers’ mind.
Chapter 4 DATA ANALYSIS and RESULT
Out of 113 questionnaires collected, 100 were found to be effective. A final
effective return rate of 88.5% (100 of 113 questionnaires) was achieved. The alpha level used in the whole study is 0.1.
4.1 Descriptive Statistical Analysis
Descriptive statistics were used to describe the sample structure in terms of
demographic characteristics and respondents’ buying behavior. The results are as below.
Profile of the sample
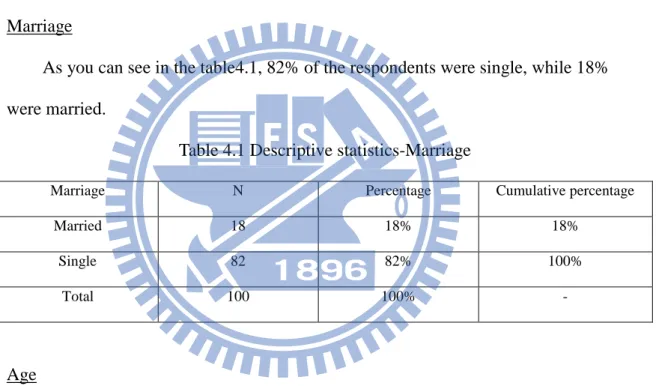
Marriage
As you can see in the table4.1, 82% of the respondents were single, while 18% were married.
Table 4.1 Descriptive statistics-Marriage
Marriage N Percentage Cumulative percentage
Married 18 18% 18%
Single 82 82% 100%
Total 100 100% -
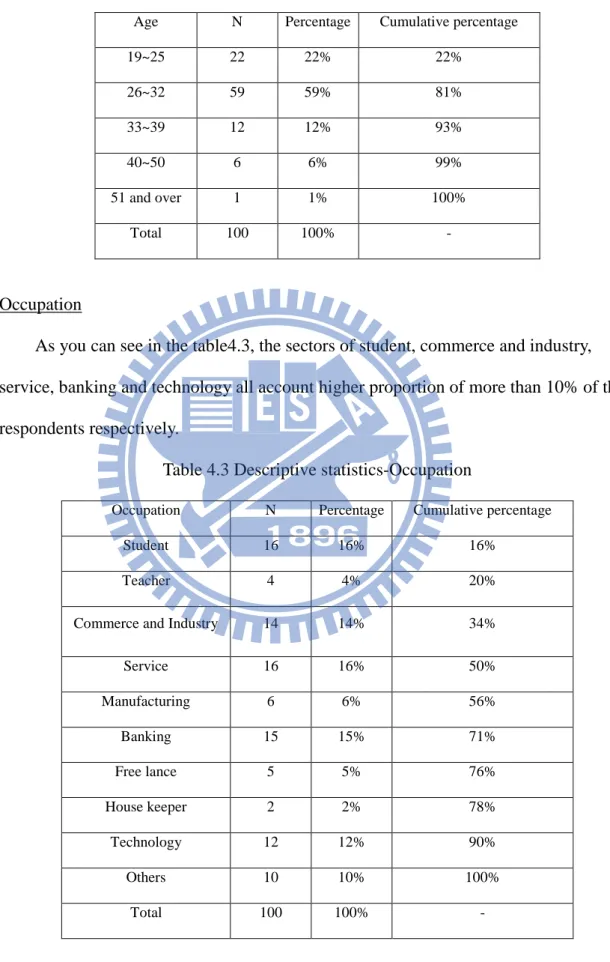
Age
As you can see from the table4.2, respondents aged from 19 to 39 years accounted for 93% of the sample. This age range seems to meet the consumer segment of the department store. A great majority is the age group of 26-32 years(59%), followed by the age group of 19~25 years(22%) and the age group of 33~39 years(12%).
Table 4.2 Descriptive Statistics-Age
Age N Percentage Cumulative percentage
19~25 22 22% 22% 26~32 59 59% 81% 33~39 12 12% 93% 40~50 6 6% 99% 51 and over 1 1% 100% Total 100 100% - Occupation
As you can see in the table4.3, the sectors of student, commerce and industry, service, banking and technology all account higher proportion of more than 10% of the respondents respectively.
Table 4.3 Descriptive statistics-Occupation
Occupation N Percentage Cumulative percentage
Student 16 16% 16%
Teacher 4 4% 20%
Commerce and Industry 14 14% 34%
Service 16 16% 50% Manufacturing 6 6% 56% Banking 15 15% 71% Free lance 5 5% 76% House keeper 2 2% 78% Technology 12 12% 90% Others 10 10% 100% Total 100 100% -
Monthly Income
As you can see in the table below, the majority is the income group of NT30,001~NT50,000(47%). Next in line were those whose monthly income is NT10,000 and below (24%), the reason being that students were the second largest segment of the whole sample.
Table 4.4 Descriptive statistics-Monthly income
Income N Percentage Cumulative percentage
NT10,000 and below 24 24% 24% NT10,001~NT30,000 15 15% 39% NT30,001~NT50,000 47 47% 86% NT50,001~NT70,000 8 8% 94% NT70,001~NT90,000 5 5% 99% NT90,001 and above 1 1% 100% Total 100 100% - Education Level
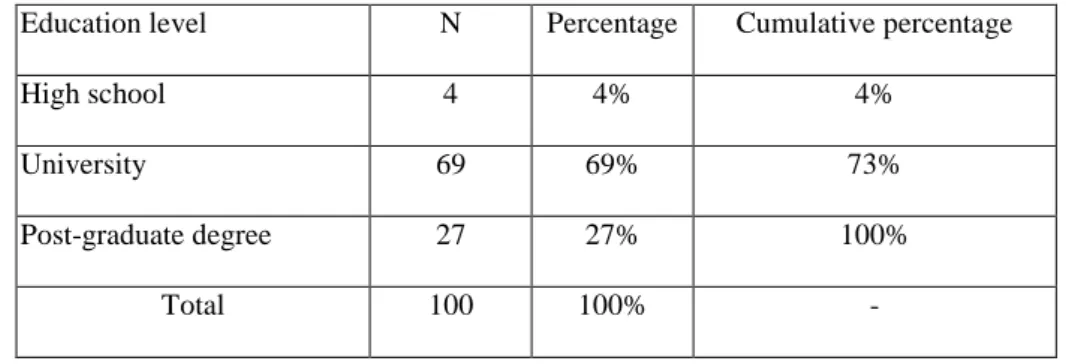
As you can see in the table4.5, the biggest group belonged to respondents with a bachelor degree (69%), followed by respondents who had post-graduate degree (27%).
Table 4.5 Descriptive statistics-Education level
Education level N Percentage Cumulative percentage
High school 4 4% 4%
University 69 69% 73%
Post-graduate degree 27 27% 100%
Total 100 100% -
Behavioral profile
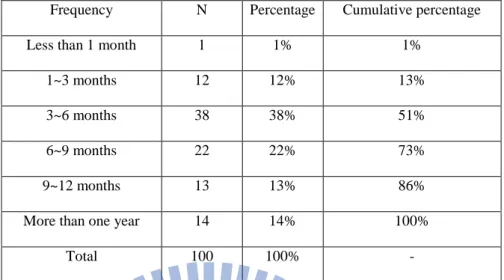
Frequency of buying department store skincare products
at department stores every 3-6months.
Table 4.6 Descriptive statistics- Frequency of buying skincare products
Frequency N Percentage Cumulative percentage
Less than 1 month 1 1% 1%
1~3 months 12 12% 13%
3~6 months 38 38% 51%
6~9 months 22 22% 73%
9~12 months 13 13% 86%
More than one year 14 14% 100%
Total 100 100% -
Average spending on department store skincare products per time.
As we can see in the table4.7, the biggest group belonged to respondents who spend NT2,001~NT3,000 on department store skincare products per time(27%). The next big group is respondents who’s average spending is NT3,001~NT4,000(15%).
Table 4.7 Descriptive statistics-Average spending
Spending N Percentage Cumulative percentage
Less than NT1,000 6 6% 6% NT1,001~NT2,000 13 13% 19% NT2,001~NT3,000 27 27% 46% NT3,001~NT4,000 15 15% 61% NT4,001~NT5,000 13 13% 74% NT5,001~NT6,000 7 7% 81% NT6,001~NT7,000 5 5% 86% NT7,001~NT8,000 1 1% 87% NT8,001~NT9,000 0 0% 87% NT9,001~NT10,000 6 6% 93% More than NT10,000 7 7% 100% Total 100 100% -
Key factors when buying department store skincare products
From the table below, we can see that more than 70% of respondents think “Past experience(79%)” and “Price(76)” are the most important factors when buying skincare products. “Promotion activities (60%)” and “Product efficacy (60%)” are also critical
factors. On the other hand, it seems” Spokesperson (0%)”, “Package (11%)” and “Advertisement (12%)” only have little influence on respondents’ decision of buying
skincare products. This is because most modern women understand their own skincare needs and have enough knowledge to choose what they want. Yet, it doesn’t mean that advertisements and spokespersons don’t work. Skincare brands still can emphasize the
effects of that product in the advertisement and also find someone who matches the image of the brand to endorse that product.
Table 4.8 Descriptive statistics-Key factors of buying skincare products
Factors N Percentage Price 76 76% Elements 44 44% Package 11 11% Staff service 33 33% Promotion activities 60 60% Friends recommendation 35 35% Internet recommendation 36 36% Brand awareness 40 40% Spokesperson 0 0% Past experience 79 79%
Advertisement(TV, magazines, etc) 12 12%
Product Efficacy 60 60%
Skincare concern
From the table below, we can find that respondents care moisturizing function most (89%). Not surprisingly, “whitening” (74%) is also another important concern for
respondents.
Table 4.9 Descriptive statistics-Skincare concern
Skincare point N Percentage
Whitening 74 74% Moisturizing 89 89% Cleansing 40 40% Anti-wrinkle 25 25% Pimple treatment 18 18% Others 3 3%
Daily used skincare product
As you can see in table4.10, almost 90% of respondents use toners and lotion every day. Besides basic skin care treatments, Mask (75%) and Essence (70%) are also
becoming daily used skin care products.
Table 4.10 Descriptive statistics-Daily used skincare product
Skincare Product N Percentage
Toners 89 89%
Lotion and Cream 90 90%
Essence 70 70%
Eye cream 60 60%
Mask 75 75%
Others 4 4%
the reason being that compared to other 7 brands, KIEHL’S is a relatively young brand in Taiwan market.
Table 4.11 Descriptive statistics-Brand awareness
Brand N Percentage SHSEIDO 99 99% ESTEE LAUDER 99 99% LANCOME 99 99% SKII 96 96% CLINIQUE 97 97% SISLEY 91 91% BIOTHERM 96 96% KIEHL'S 84 84%
Recently bought brands
From the table below, we can see 38% of respondents bought SHISEIDO recently, while 32% of respondents bought brands other than the 8 brands.
Table 4.12 Descriptive statistics- Recently bought brands
Brand N Percentage SHSEIDO 38 38% ESTEE LAUDER 16 16% LANCOME 9 9% SKII 11 11% CLINIQUE 19 19% SISLEY 2 2% BIOTHERM 10 10% KIEHL'S 12 12% OTHERS 32 32%
4.2 Reliability/Validity Test
Reliability Test
Reliability is synonymous with repeatability or stability. A measurement that yields consistent results over time is said to be reliable. One of the most popular reliability statistics in use today is Cronbach's alpha or the coefficient alpha. Alpha coefficient is the average of all possible split-half coefficients resulting from different ways of splitting the scale items ranging in value from 0 to 1 and may be used to describe the reliability. Nunnaly (1978) has indicated 0.7 to be an acceptable reliability coefficient. In my study, the Cronbach's alpha of brand equity measurement is 0.9419 which can be considered as high reliability.
Validity Test
Validity refers to the degree to which the test actually measures what it claims to measure. The questionnaire design in this study is based on the brand equity theory proposed by David Aaker and previous related studies. Besides, a pretest was also conducted to decrease the likelihood that a question would be misunderstood or misinterpreted. Therefore, this survey can meet validity requirement.
4.3 Brand Equity Measurement Over 8 Brands
One-Way MANOVA using (α=0.1)
In this test, 8 brands were used as categorical independent variables and 15 attributes were used as dependent variables. From the table below, significant differences were found among the 8 brands on the 15 attributes (Wilks’ λ =0.69, F = 2.83, p < .0001.) Usually, the multivariate Wilks' λ is quite strong at 0.35. Univariate analyses of variance (ANOVAs) for each dependent variable were also conducted as follow-up tests to the MANOVA. The result revealed that the ANOVA of all the 15 attributes except Q9_9 and Q9_13 were significant
Table 4.13 MANOVA results of overall attributes and each attribute
Attribute F value P value Result
Overall 2.83 <.0001 * Significant
Q9_1. Even when other brands are cheaper, I am still willing to buy this brand.
2.4 0.0194 * Significant Q9_2. I will recommend this brand to others. 5 <.0001 * Significant Q9_3. I will buy this brand next time when I need to
buy skincare products.
3.8 0.0005 * Significant Q9_4. Compared with other brands, this brand
delivers better quality.
2.48 0.0159 * Significant Q9_5. I think this brand value innovation more than
other brands.
3.61 0.0008 * Significant Q9_6. I think this brand is in its leadership position in
the market.
11.42 <.0001 * Significant Q9_7. This brand has consistent quality. 3.46 0.0012 * Significant Q9_8. I think this brand is worth more than what I
paid for.
2.45 0.0173 * Significant Q9_9. Compared with other brands, this brand makes
me feel a greater sense of value.
1.57 0.1403 NS Q9_10. It is easier for me to have a clear image
toward the consumer of this brand.
4.08 0.0002 * Significant Q9_11. I trust the brand company. 4.33 0.0001 * Significant Q9_12. I think the skincare product of this brand is
significantly different from others.。
2.77 0.0074 * Significant Q9_13. This brand is attractive to me. 1.15 0.3287 NS Q9_14. I’ve heard about this brand. 1.73 0.0982 * Significant Q9_15. When it comes to skincare products, I can
speak out the name of this brand specifically.
Pair-wise comparison (using α=0.1)
Pair-wise test is also used to among 8 brands over the 15 attributes.
Q9_1. Even when other brands are cheaper than this brand, I’m still willing to buy
this brand.
From the table below, we can separate 8 brands into 4 groups according to the comparative evaluations on this attribute. SHISEIDO and KIEHL’S can be regarded as the first leading group while ESTEE LAUDER, LANCOME, and BIOTHERM as the second leading group. Clinique and SKII are in the third group, while SISLEY is in the weakest group.
Table 4.14 Pair-wise comparison-Q9_1
Q9_2. I will recommend this brand to others.
From the table below, we can divide 8 brands into 5 groups. SHISEIDO is in the first leading group followed by KIEHL’S. ESTEE LAUDER and LANCOME are in the third leading group while SKII and BIOTHERM are in the fourth group. Lastly,
CLINIQUE and SISLEY are in the weakest group.
Brands Mean SHISEIDO ESTEE
LAUDER LANCOME SKII CLINIQUE SISLEY BIOTHERM KIEHL'S SHISEIDO 3.18 - 0.3005 0.3809 0.0799 0.0946 0.0009 0.1303 0.9365 ESTEE LAUDER 3.05 0.3005 - 0.8734 0.4734 0.5239 0.0211 0.6326 0.2648 LANCOME 3.07 0.3809 0.8734 - 0.3809 0.4257 0.0137 0.5239 0.3392 SKII 2.96 0.0799 * 0.4734 0.3809 - 0.9365 0.1113 0.8111 0.0672 * CLINIQUE 2.97 0.0946 * 0.5239 0.4257 0.9365 - 0.0946 0.8734 0.0799 * SISLEY 2.76 0.0009 * 0.0211 * 0.0137 * 0.1113 0.0946 * - 0.0672 * 0.0006 * BIOTHERM 2.99 0.1303 0.6326 0.5239 0.8111 0.8734 0.0672 - 0.1113 KIEHL'S 3.19 0.9365 0.2648 0.3392 0.0672 0.0799 0.0006 0.1113 -
Table 4.15 Pair-wise comparison-Q9_2
Q9_3. I will buy this brand next time when I need to buy skincare products
From the table below, we can separate 8 brands into 4 groups. SHISEIDO and KIEHL’S are the first leading group, while ESTEE LAUDER and LANCOME are in
the second leading group. Clinique and BIOTHERM are in the third group. Lastly, SKII and SISLEY are in the weakest group.
Table 4.16 Pair-wise comparison-Q9_3
Q9_4. Compared with other brands, this brand delivers better quality.
From the table below, we can separate 8 brands into 4 groups. SHISEIDO is in the
Brands Mean SHISEIDO ESTEE
LAUDER LANCOME SKII CLINIQUE SISLEY BIOTHERM KIEHL'S SHISEIDO 3.5 - 0.0645 0.0367 0.001 0.0001 <.0001 0.0081 0.1477 ESTEE LAUDER 3.27 0.0645 * - 0.8092 0.1477 0.0445 0.001 0.421 0.6874 LANCOME 3.24 0.0367 * 0.8092 - 0.2276 0.0769 0.0023 0.5732 0.5197 SKII 3.09 0.001 * 0.1477 0.2276 - 0.5732 0.0645 0.5197 0.0645 * CLINIQUE 3.02 0.0001 * 0.0445 * 0.0769 * 0.5732 - 0.1981 0.2276 0.016 * SISLEY 2.86 <.0001 * 0.001 * 0.0023 * 0.0645 * 0.1981 - 0.0128 * 0.0002 * BIOTHERM 3.17 0.0081 * 0.421 0.5732 0.5197 0.2276 0.0128 - 0.2276 KIEHL'S 3.32 0.1477 0.6874 0.5197 0.0645 0.016 0.0002 0.2276 -
Brands Mean SHISEIDO ESTEE
LAUDER LANCOME SKII CLINIQUE SISLEY BIOTHERM KIEHL'S SHISEIDO 3.35 - 0.0974 0.2136 0.0004 0.013 <.0001 0.0081 0.4554 ESTEE LAUDER 3.15 0.0974 * - 0.6783 0.0567 0.4069 0.0204 0.3197 0.3616 LANCOME 3.2 0.2136 0.6783 - 0.0204 0.2136 0.0063 0.1587 0.6187 SKII 2.92 0.0004 * 0.0567 * 0.0204 * - 0.281 0.6783 0.3616 0.0049 * CLINIQUE 3.05 0.013 * 0.4069 0.2136 0.281 - 0.1357 0.8682 0.0818 * SISLEY 2.87 <.0001 * 0.0204 * 0.0063 * 0.6783 0.1357 - 0.1847 0.0013 * BIOTHERM 3.03 0.0081 * 0.3197 0.1587 0.3616 0.8682 0.1847 - 0.0567 * KIEHL'S 3.26 0.4554 0.3616 0.6187 0.0049 0.0818 0.0013 0.0567 -
first leading group, while ESTEE LAUDER, LANCOME and KIEHL’S are the second leading group. SKII and BIOTHERM are the third group. Lastly, Clinique and SISLEY are the weakest group.
Table 4.17 Pair-wise comparison-Q9_4
Brands Mean SHISEIDO ESTEE
LAUDER LANCOME SKII CLINIQUE SISLEY BIOTHERM KIEHL'S SHISEIDO 3.36 - 0.2577 0.2577 0.0733 0.0007 0.0019 0.0302 0.1572 ESTEE LAUDER 3.24 0.2577 - 1 0.509 0.0238 0.0478 0.2994 0.7771 LANCOME 3.24 0.2577 1 - 0.509 0.0238 0.0478 0.2994 0.7771 SKII 3.17 0.0733 * 0.509 0.509 - 0.109 0.1867 0.7058 0.7058 CLINIQUE 3 0.0007 * 0.0238 * 0.0238 * 0.109 - 0.7771 0.2201 0.0478 * SISLEY 3.03 0.0019 * 0.0478 * 0.0478 * 0.1867 0.7771 - 0.3455 0.0897 * BIOTHERM 3.13 0.0302 * 0.2994 0.2994 0.7058 0.2201 0.3455 - 0.4504 KIEHL'S 3.21 0.1572 0.7771 0.7771 0.7058 0.0478 0.0897 0.4504 -
Q9_5. I think this brand value innovation more than other brands.
From the table below, we can separate 8 brands into 4 groups. ESTEE LAUDER and LANCOME are the leading group, followed by SHISEIDO, SKII, BIOTHERM and KIEHL’S. CLINIQUE is in the third group. Finally, SISLEY is the weakest brand.
Table 4.18 Pair-wise comparison-Q9_5
Brands Mean SHISEIDO ESTEE
LAUDER LANCOME SKII CLINIQUE SISLEY BIOTHERM KIEHL'S SHISEIDO 3.14 - 0.0945 * 0.1634 0.8525 0.3527 0.0094 0.6421 0.9259 ESTEE LAUDER 3.32 0.0945 - 0.7803 0.1371 0.0094 <.000 1 0.227 0.1143 LANCOME 3.29 0.1634 0.7803 - 0.227 0.0203 <.0001 0.3527 0.1933 SKII 3.16 0.8525 0.1371 0.227 - 0.2648 0.0054 0.7803 0.9259 CLINIQUE 3.04 0.3527 0.0094 * 0.0203 * 0.2648 - 0.0945 0.1634 0.3066 SISLEY 2.86 0.0094 * <.0001 * <.0001 * 0.0054 * 0.0945 * - 0.0022 * 0.0071 * BIOTHERM 3.19 0.6421 0.227 0.3527 0.7803 0.1634 0.0022 - 0.71 KIEHL'S 3.15 0.9259 0.1143 0.1933 0.9259 0.3066 0.0071 0.71 -
Q9_6. I think this brand is in its leadership position in the market.
From the table below, we can separate 8 brands into 4 groups. SHISEIDO is in the first leading group, while ESTEE LAUDER, LANCOME and SKII are the second leading group. KIEHL’S is in the third group followed by CLINIQUE, SISLEY, and BIOTHERM.
Table 4.19 Pair-wise comparison-Q9_6
Q9_7. This brand has consistent quality.
From the table below, we can divide 8 brands into 5 groups. SHISEIDO is in the first leading group, followed by KIEHL’S. ESTEE LAUDER and LANCOME are the
third leading group, while SKII, Clinique and BIOTHERM are the fourth group. Lastly, SISLEY is in the weakest group.
Table 4.20 Pair-wise comparison-Q9_7
Brands Mean SHISEIDO ESTEE
LAUDER LANCOME SKII CLINIQUE SISLEY BIOTHERM KIEHL'S SHISEIDO 3.74 - 0.083 0.0194 0.0303 <.0001 <.0001 <.0001 <.0001 ESTEE LAUDER 3.54 0.083 * - 0.5437 0.6645 <.0001 <.0001 <.0001 0.0007 LANCOME 3.47 0.0194 * 0.5437 - 0.8623 0.0002 0.0001 0.0007 0.0056 SKII 3.49 0.0303 * 0.6645 0.8623 - 0.0001 <.0001 0.0004 0.0033 CLINIQUE 3.04 <.0001 * <.0001* 0.0002 * 0.0001 * - 0.8623 0.7286 0.3401 SISLEY 3.02 <.0001 * <.0001 * 0.0001 * <.0001 * 0.8623 - 0.6028 0.2596 BIOTHERM 3.08 <.0001 * <.0001 * 0.0007 * 0.0004 * 0.7286 0.6028 - 0.5437 KIEHL'S 3.15 <.0001 * 0.0007 * 0.0056 * 0.0033 * 0.3401 0.2596 0.5437 -
Brands Mean SHISEIDO ESTEE
LAUDER LANCOME SKII CLINIQUE SISLEY BIOTHERM KIEHL'S SHISEIDO 3.53 - 0.0169 0.0169 0.0023 0.0002 <.0001 0.0042 0.0851 ESTEE LAUDER 3.28 0.0169 * - 1 0.5028 0.1803 0.0558 0.6321 0.5028 LANCOME 3.28 0.0169 * 1 - 0.5028 0.1803 0.0558 0.6321 0.5028 SKII 3.21 0.0023 * 0.5028 0.5028 - 0.5028 0.2135 0.8481 0.1803 CLINIQUE 3.14 0.0002 * 0.1803 0.1803 0.5028 - 0.5657 0.3889 0.0446 *
Q9_8. I think this brand is worth more than what I paid for.
From the table below, we can separate 8 brands into 3 groups. SHISEIDO, LANCOME, BIOTHERM and KIEHL’S are in the first leading group, while ESTEE LAUDER and CLINIQUE are the second leading group. SKII and SISLEY are in the weakest group.
Table 4.21 Pair-wise comparison-Q9_8
Brands Mean SHISEIDO ESTEE
LAUDER LANCOME SKII CLINIQUE SISLEY BIOTHERM KIEHL'S SHISEIDO 3.09 - 0.4034 1 0.0205 0.3533 0.0055 0.6425 0.8527 ESTEE LAUDER 3 0.4034 - 0.4034 0.1377 0.926 0.0515 0.7103 0.3072 LANCOME 3.09 1 0.4034 - 0.0205 0.3533 0.0055 0.6425 0.8527 SKII 2.84 0.0205 * 0.1377 0.0205 * - 0.1639 0.6425 0.0636 * 0.0123 * CLINIQUE 2.99 0.3533 0.926 0.3533 0.1639 - 0.0636 0.6425 0.2654 SISLEY 2.79 0.0055 * 0.0515 * 0.0055 * 0.6425 0.0636 * - 0.0205 * 0.003 * BIOTHERM 3.04 0.6425 0.7103 0.6425 0.0636 0.6425 0.0205 - 0.5158 KIEHL'S 3.11 0.8527 0.3072 0.8527 0.0123 0.2654 0.003 0.5158 -
Q9_9. Compared with other brands, this brand makes me feel a greater sense of
value.
From the previous MANVONA test, we know the difference in evaluations on this attribute among the 8 brands is not statistically significant. From the table below, we can find the similar result. Only CINIQUE has comparative lower evaluations on this
attribute.
SISLEY 3.08 <.0001 * 0.0558 * 0.0558 * 0.2135 0.5657 - 0.1512 0.0099 *
BIOTHERM 3.23 0.0042 * 0.6321 0.6321 0.8481 0.3889 0.1512 - 0.2508 KIEHL'S 3.35 0.0851 * 0.5028 0.5028 0.1803 0.0446 0.0099 0.2508 -
Table 4.22 Pair-wise comparison-Q9_9
Brands Mean SHISEIDO ESTEE
LAUDER LANCOME SKII CLINIQUE SISLEY BIOTHERM KIEHL'S SHISEIDO 3.22 - 0.858 0.858 0.858 0.0202 0.2832 0.1798 0.5914 ESTEE LAUDER 3.24 0.858 - 0.7205 1 0.0124 0.2106 0.1286 0.4742 LANCOME 3.2 0.858 0.7205 - 0.7205 0.032 0.3711 0.245 0.7205 SKII 3.24 0.858 1 0.7205 - 0.0124 0.2106 0.1286 0.4742 CLINIQUE 2.96 0.0202 * 0.0124 * 0.032 * 0.0124 * - 0.2106 0.3252 0.0739* SISLEY 3.1 0.2832 0.2106 0.3711 0.2106 0.2106 - 0.7884 0.5914 BIOTHERM 3.07 0.1798 0.1286 0.245 0.1286 0.3252 0.7884 - 0.4208 KIEHL'S 3.16 0.5914 0.4742 0.7205 0.4742 0.0739 0.5914 0.4208 -
Q9_10. It is easier for me to have a clear image toward the consumer of this brand.
From the table below, we can separate 8 brands into 5 groups. SHISEIDO is in the first leading group, while LANCOME and SKII belong the second leading group. ESTEE LAUDER and KIEHL’S are the third group followed by BIOTHERM.
CLINIQUE and SISLEY are in the weakest group.
Table 4.23 Pair-wise comparison-Q9_10
Brands Mean SHISEIDO ESTEE
LAUDER LANCOME SKII CLINIQUE SISLEY BIOTHERM KIEHL'S SHISEIDO 3.66 - 0.0172 0.0334 0.0886 <.0001 <.0001 0.0017 0.0172 ESTEE LAUDER 3.38 0.0172 * - 0.7982 0.4955 0.0216 0.1253 0.4432 1 LANCOME 3.41 0.0334 * 0.7982 - 0.6701 0.0107 0.0738 0.3067 0.7982 SKII 3.46 0.0886 * 0.4955 0.6701 - 0.0029 0.027 0.1477 0.4955 CLINIQUE 3.11 <.0001 * 0.0216 * 0.0107 * 0.0029 * - 0.4432 0.1253 0.0216 * SISLEY 3.2 <.0001* 0.12533 0.0738 * 0.027 * 0.4432 - 0.4432 0.125 BIOTHERM 3.29 0.0017 * 0.4432 0.3067 0.1477 0.1253 0.4432 - 0.4432 KIEHL'S 3.38 0.0172 * 1 0.7982 0.4955 0.0216 0.1253 0.4432 -
Q9_11. I trust the brand company.
From the table below, we can separate 8 brands into 5 groups. SHISEIDO is in the first leading group, followed by ESTEE LAUDER and KIEHL’S. LANCOME belongs
to the third leading group, while SKII and BIOTHERM are the fourth group. Lastly, CLINIQUE and SISLEY are in the weakest group.
Table 4.24 Pair-wise comparison-Q9_11
Brands Mean SHISEIDO ESTEE
LAUDER LANCOME SKII CLINIQUE SISLEY BIOTHERM KIEHL'S SHISEIDO 3.75 - 0.0233 0.0089 0.0003 <.0001 <.0001 0.0002 0.0233 ESTEE LAUDER 3.49 0.0233 * - 0.7268 0.1624 0.0809 0.0146 0.1378 1 LANCOME 3.45 0.0089 * 0.7268 - 0.2946 0.1624 0.0363 0.2563 0.7268 SKII 3.33 0.0003 * 0.1624 0.2946 - 0.7268 0.2946 0.9304 0.1624 CLINIQUE 3.29 <.0001 * 0.0809 * 0.1624 0.7268 - 0.4847 0.7933 0.0809 * SISLEY 3.21 <.0001 * 0.0146 * 0.0363 * 0.2946 0.4847 - 0.3367 0.0146 * BIOTHERM 3.32 0.0002 * 0.1378 0.2563 0.9304 0.7933 0.3367 - 0.1378 KIEHL'S 3.49 0.0233 * 1 0.7268 0.1624 0.0809 0.0146 0.1378 -
Q9_12. I think the product of this brand is significantly different from others.
From the table below, we can separate 8 brands into 5 groups. KIEHL’S is in the first leading group, while ESTEE LAUDER and SKII are in the second leading group. SHISEIDO, LANCOME and BIOTHERM belong to the third group. Lastly,
CLINIQUE and SISLEY are in the weakest group.
Table 4.25 Pair-wise comparison-Q9_12
Brands Mean SHISEIDO ESTEE
LAUDER LANCOME SKII CLINIQUE SISLEY BIOTHERM KIEHL'S SHISEIDO 3.15 - 0.4379 0.9313 0.1431 0.3011 0.5463 0.8631 0.0099 * ESTEE LAUDER 3.24 0.4379 - 0.4905 0.4905 0.0705 0.1681 0.3431 0.0705 * LANCOME 3.16 0.9313 0.4905 - 0.1681 0.2626 0.4905 0.7959 0.0126 * SKII 3.32 0.1431 0.4905 0.1681 - 0.0126 0.0388 0.1017 0.2626 CLINIQUE 3.03 0.3011 0.0705 * 0.2626 0.0126 * - 0.6665 0.3888 0.0003 * SISLEY 3.08 0.5463 0.1681 0.4905 0.0388 * 0.6665 - 0.6665 0.0015 * BIOTHERM 3.13 0.8631 0.3431 0.7959 0.1017 0.3888 0.6665 - 0.0059 * KIEHL'S 3.45 0.0099 0.0705 * 0.0126 0.2626 0.0003 0.0015 0.0059 -
attribute among the 8 brands is not statistically significant. From the table below, we can find the similar result. Only SKII and KIEHL’S have slightly higher evaluations on this attribute.
Table 4.26 Pair-wise comparison-Q9_13
Brands Mean SHISEIDO ESTEE
LAUDER LANCOME SKII CLINIQUE SISLEY BIOTHERM KIEHL'S SHISEIDO 3.16 - 0.9314 0.7307 0.6057 0.1023 0.4387 1 0.4913 ESTEE LAUDER 3.15 0.9314 - 0.667 0.547 0.1217 0.4913 0.9314 0.4387 LANCOME 3.2 0.7307 0.667 - 0.8634 0.0481 0.2635 0.7307 0.7307 SKII 3.22 0.6057 0.547 0.8634 - 0.0317 0.197 0.6057 0.8634 CLINIQUE 2.97 0.1023 0.1217 0.0481 0.0317 * - 0.3896 0.1023 0.0204 * SISLEY 3.07 0.4387 0.4913 0.2635 0.197 0.3896 - 0.4387 0.1438 BIOTHERM 3.16 1 0.9314 0.7307 0.6057 0.1023 0.4387 - 0.4913 KIEHL'S 3.24 0.4913 0.4387 0.7307 0.8634 0.0204 0.1438 0.4913 -
Q9_14. I’ve heard about this brand.
From the table below, we can separate 8 brands into 5 groups. SHISEIDO and LANCOME are in the first leading group, followed by ESTEE LAUDER and SKII. CLINIQUE and BIOTHERM belong to the third group while KIEHL’S is in the fourth group. Lastly, SISLEY is in the weakest group.
Table 4.27 Pair-wise comparison-Q9_14
Brands Mean SHISEIDO ESTEE
LAUDER LANCOME SKII CLINIQUE SISLEY BIOTHERM KIEHL'S SHISEIDO 4.4 - 0.7155 0.9419 0.466 0.1662 0.0088 0.3076 0.0493 ESTEE LAUDER 4.35 0.7155 - 0.7706 0.7155 0.3076 0.024 0.5118 0.109 LANCOME 4.39 0.9419 0.7706 - 0.5118 0.1896 0.0109 0.3434 0.0583 SKII 4.3 0.466 0.7155 0.5118 - 0.5118 0.0583 0.7706 0.2154 CLINIQUE 4.21 0.1662 0.3076 0.1896 0.5118 - 0.2154 0.7155 0.5598 SISLEY 4.04 0.0088 * 0.024 * 0.0109 * 0.0583 * 0.2154 - 0.109 0.5118 BIOTHERM 4.26 0.3076 0.5118 0.3434 0.7706 0.7155 0.109 - 0.3434 KIEHL'S 4.13 0.0493 * 0.109 0.0583 * 0.2154 0.5598 0.5118 0.3434 -
Q9_15. When it comes to skincare products, I can speak out the name of this brand
specifically.
From the table below, we can separate 8 brands into 4 groups. SHISEIDO is in the first leading group, while ESTEE LAUDER, LANCOME, SKII and BIOTHERM are in the second leading group. CLINIQUE and KIEHL’S belong to the third group. Lastly, SISLEY is in the weakest group.
Table 4.28 Pair-wise comparison-Q9_15
Brands Mean SHISEIDO ESTEE
LAUDER LANCOME SKII CLINIQUE SISLEY BIOTHERM KIEHL'S SHISEIDO 4.33 - 0.1546 0.2001 0.3929 0.0464 <.0001 0.1763 0.019 ESTEE LAUDER 4.13 0.1546 0.8867 0.5689 0.5689 0.0069 0.9432 0.3547 LANCOME 4.15 0.2001 0.8867 - 0.6692 0.4764 0.0045 0.9432 0.2856 SKII 4.21 0.3929 0.5689 0.6692 - 0.2547 0.0011 0.6181 0.135 CLINIQUE 4.05 0.0464 * 0.5689 0.4764 0.2547 - 0.0329 0.5216 0.7218 SISLEY 3.75 <.0001 * 0.0069 * 0.0045 * 0.0011 * 0.0329 * - 0.0056 * 0.0753 * BIOTHERM 4.14 0.1763 0.9432 0.9432 0.6181 0.5216 0.0056 - 0.3189 KIEHL'S 4 0.019 * 0.3547 0.2856 0.135 0.7218 0.0753 0.3189 -
The table below summarizes the results generated from ANOVAs above indicating which brands are doing better or worse in each attribute.
Table 4.29 List of leaders and laggards on 15 attributes
Dimension Indicators Attributes Status
Brand Loyalty Price Premium Q9_1
Price premium Leader: SHISEIDO(3.18),KIEHL’s(3.19) Laggard:SISLEY(2.76) Loyalty Q9_2 Recommendation Leader: SHISEIDO(3.5)
Laggard: CLINIQUE(3.02), SISLEY(2.86)
Q9_3
Repurchase
Leader: SHISEIDO(3.53), KIEHL’S(3.26) Laggard:SKII(2.92), SISLEY(2.87)
Quality Quality Better quality Laggard: CLINIQUE(3.0), SISLEY(3.03) Q9_7 Constant quality Leader: SHISEIDO(3.53) Laggard: SISLEY(3.08) Leadership Q9_5 Innovation leader
Leader: ESTEE LAUDER(3.32), LANCOME(3.29) Laggard: SISLEY(2.86) Q9_6 Market leader Leader: SHISEIDO(3.74) Laggard: : CLINIQUE(3.04), SISLEY(3.02), BIOTHERM(3.08) Brand Association Perceived Value Q9_8
Better value for
money
Leader:SHISEIDO(3.09),
LANCOME(3.09), BIOTHERM(3.04), KIEHL’S(3.11)
Laggard: SKII(2.84), SISLEY(2.79)
Q9_9 Sense of value Laggard: : CLINIQUE(2.96) Brand Personality Q9_10 Clear consumer image Leader: SHISEIDO(3.66)
Laggard: CLINIQUE(3.11), SISLEY(3.2)
Q9_13
Attractiveness
Leader: SKII(3.24), KIEHL’S(3.22)
Company
Association
Q9_11
Trustful
Leader: SHISEIDO(3.75)
Laggard: CLINIQUE(3.29), SISLEY(3.21)
Differentiation Q9_12
Differentiation
Leader: KIEHL’S(3.45)
Laggard: CLINIQUE(3.03), SISLEY(3.08)
Brand Awareness Brand Awareness Q9_14 Ability to identify
Leader: SHISEIDO(4.4), LANCOME(4.39) Laggard: SISLEY(4.04)
Q9_15
Ability to recall
Leader: SHISEIDO(4.33) Laggard: SISLEY(3.75)
4.4 Perceptual Map
9 brands including an ideal brand are plotted in a map (Figure 4.1) based on their evaluation scores on 15 attributes. The ideal is composed of the highest ratings on each attribute. In the map, X axis is defined as “Habitual buying” while Y axis is defined as “Price”. As you can see the position of ideal brand in the map, consumers prefer their
frequently purchased brand and also prefer medium price brand.
Moreover, from the perceptual map below, we can see that SHISEIDO is the closest brand to the ideal brand, followed by ESTEE LAUDER, LANCOME and KIEHL’S. Therefore, we can consider SHISEIDO as the market leaders. ESTEE
LAUDER, LANCOME and KIEHL’S are the market challengers. SKII, BIOTHERM and CLINIQUE are the market followers. Finally, SISLEY which positions itself as premium and high-end skin care brand can be viewed as a market nicer.
Figure 4.1 Perceptual Map
ESTEE LAUDER SHISEIDO IDEAL BRAND LANCOME KIEHL’S SKII BIOTHERM CLINIQUE SISLEY Habitual buying Price
Chapter 5 CONCLUSIONS and MANAGERIAL APPLICATIONS
5.1 A Summary of Major Findings
From the result of the perceptual map, SHISEIDO is the market leader. ESTEE LAUDER, LANCOME and KIEHL’S are the market challengers. SKII, BIOTHERM
and CLINIQUE are the market followers. Finally, SISLEY which positions itself as premium and high-end skin care brand can be viewed as a market nicher. Furthermore, in the following part, I identify what each brand does well and does not well from the results in chapter 4 and give suggestions for each brand to enhance its brand equity on consumers’ mind as well.
Competitive Analysis
5.1.1 Market Leaders: SHISEIDO
SHISEIDO
SHISEIDO is a major Japanese hair care and cosmetics producer. It is founded in 1872 and is the oldest cosmetics company in the world and the fourth largest cosmetics company in the world. SHSEIDO was the first to develop the softening lotion, a
lightweight liquid of toner-like consistency. SHISEIDO has the oldest softening lotion named Eudermine, which is still marketed and sold at all SHSEIDO counters. In 1957, SHSIEDO began sales in Taiwan. In fact, SHISEIDO was the earliest entrant to Taiwan, thus it has greater influences on the development of Taiwan cosmetic market and has also established itself as the market leader in this market.
Product
Shiseido’s brand philosophy is to utilize its flexibility in modifying and
customizing its offerings. Thus, it provides a wide product line with sub-brands to take on different market segments from 20s to 50s in different markets, for example “Revital” is developed for aged women and “Beauty Voltage” is targeted for young generation
aged 20~30 years. Besides, SHISEIDO is also renowned for its skin whitening products
Price
Because of its wide product line, prices of SHISEDIO products range from NT750~NT4,500.
Place
SHISEIDO has developed a very strong distribution network in Taiwan. Shiseido targets distribution channels including department stores, SHISEIDO licensed store, drug stores such as Watson’s.
Promotion
SHISEID has aggressive promotional activities including television commercials and printed media in Taiwan. SHISEIDO’s TV ads heavily rely on the use of domestic
celebrities. But during these years, SHISEIDO has started to use local celebrities such Hong Kong star Vivian Chou.
Suggestion
Generally speaking, SHISEIDO outperforms the other 7 brands on almost 15 attributes. It has high brand loyalty, perceived quality, perceived value, market leader, company association and brand awareness. Still, it has relative lower evaluations on innovation leader attribute” I think this brand value innovation more than other brands. “(3.14), attractiveness attribute” This brand is attractive to me.”(3.16) and
differentiation attribute “I think the skincare product of this brand is significantly different from others.”(3.15). In fact, SHISEIDO has been focusing on developing
innovative and high quality products since its founding in 1872. For example, it verified the whitening effect of m-Tranexamic acid, applied a patent for use and developed it as a quasi-drug active ingredient. Therefore, SHISEIDO should keep emphasizing its innovative capabilities whether through sales persons, in the TV commercial, or in other