國 立 交 通 大 學
經營管理研究所
博 士 論 文
No.139
賽局選擇權之創業投資進入模式:
跳躍擴散過程
The Venture Capital Entry Model on Game Options
with Jump-diffusion Process
研 究 生: 柯 娟 娟
指導教授: 楊 千 教授
國 立 交 通 大 學
經營管理研究所
博 士 論 文
No.139
賽局選擇權之創業投資進入模式:
跳躍擴散過程
The Venture Capital Entry Model on Game Options
with Jump-diffusion Process
研 究 生: 柯 娟 娟
研究指導委員會: 楊 千 教授
丁 承 教授
胡 均 立 教授
指導教授: 楊 千 教授
中華民國一○○年五月
賽局選擇權之創業投資進入模式:跳躍擴散過程
研究生:柯娟娟
指導教授:楊 千
國立交通大學經營管理研究所博士班
摘
要
本文運用賽局選擇權導入新創公司之每股盈餘(EPS),服從跳躍擴散過程之幾何布朗運 動(連續過程)及布阿松過程(離散過程)下,建構創業投資事投資新創公司之決策管理工 具,用以評估高風險之創業投資專案。本模型主要針對兩家創業投資事業,依其不同競爭 投資策略行為,所反應潛在收益所形成之不同市場結構:特殊獨佔(entry-deterred game)、 雙佔(leader’s dominated strategies)、與同時投入(investment simultaneously)進行賽局選擇權進 入模式推導,及如何利用投資時機避開潛在競爭威脅,提供創投企業最適投資決策期望門 檻值。The Venture Capital Entry Model on Game Options
with Jump-diffusion Process
Student:Chuan-Chuan Ko
Advisor:Dr. Chyan Yang
Institute of Business and Management
National Chiao Tung University
ABSTRACT
This study aims to apply game options to construct the optimal decision-making and management tool for venture capital (VC) firms under the assumption that a start-up company’s earnings per share follow a jump-diffusion process, which includes a geometric Brownian motion (continuous process) and Poisson process (discrete process) in order to evaluate highly risky VC projects. This model emphasizes the inferences with game options on the market structures formed by different competition and investment strategies of two VC firms so as to reflect the potential response investment returns. These market structures are classified into an entry-deterred game (specific monopoly), a leader’s dominated strategies (duopoly), and simultaneous investment. It is considered how to select investment timing to avoid any potential competitive threats in order to provide the optimal expected threshold values for the investment decisions of VC firms.
誌 謝
2006 年 2 月 26 日我緊緊握著已被醫生宣判病危父親的手,告訴父親,我會盡全力攻讀博 士學位,完成您長久以來之期盼。當時已經沒有力氣說話的父親點了好幾個頭,就在隔日 他鬆開了手,就此長眠。當年 12 月 7 日「柯娟娟」三個字出現在國立交通大學博士班入學 甄試錄取榜單中,值此時刻全家人喜極而泣,我們知道他在另一個世界同時分享著喜悅。 感謝父親的庇佑,引導我遇到一位像似父親的指導教授楊千老師,在修習博士學位期 間,除了獲得楊老師之諄諄教誨外,更見識到楊老師極具深遠且寬廣的視野,以及與眾不 同的思維模式。每當學生在學習上感到困惑甚至徬徨無助時,楊老師的關鍵提示,字句雖 然精簡,但充滿智慧又意義深遠。於此時刻,真誠的感謝楊老師引領學生在學習上明確的 方向,並能順利完成博士學位。此外,特別感謝丁承老師與胡均立老師,提供學生在研究 時之理論與實務上的專業意見,並給予後續研究方向之啟發。還有,感謝金奉天老師、曾 芳代老師等所有老師,非常謝謝您們的指導與教誨,使學生在學習上獲益良多。 感謝可愛的同學與學長姐們,君華、秀貴、薰瑤、凱喻與憲明等,一起修課、討論、 辦活動與聚餐,陪我渡過在交大的生活,點點滴滴,甜蜜在心。最後,感謝我親愛家人, 我的父母親給我的愛及關懷,兩位姐姐、妹妹及弟弟的支持與鼓勵,使我能心無旁騖的完 成學業。感念修讀博士這四年多時光的所有人、事、物,我將永遠銘感於心! 柯娟娟 謹誌 2011 年 5 月Table of Content
摘 要 ... i
ABSTRACT ... ii
誌 謝….………...iii
Table of Content ... iv
List of Tables ... v
List of Figures ... vi
Chapter 1. Introduction ... 1
1.1. Research Background ... 1
1.2. Research Objectives ... 2
1.3. Research Question ... 3
Chapter 2. Literature Review... 5
2.1. Venture Capital ... 5
2.2. Risk Management ... 7
2.3. Real Options Approach and Game Theory ... 9
2.4. Jump-Diffusion Process ... 14
Chapter 3. Research Model ... 16
3.1. Assumptions ... 16
3.2. Specific Monopoly Model ... 22
3.3. Leader’s Dominating Strategy (Duopoly) Model ... 26
3.3.1. Follower’s Value Function and Threshold ... 26
3.3.2. Leader’s Value Function and Threshold ... 28
3.4. Simultaneous Investment Model ... 31
Chapter 4. Numerical Example ... 33
4.1. Data Assumptions ... 33 4.2. Results ... 35 4.3. Sensitivity Analysis ... 38 Chapter 5. Conclusion ... 42 Reference………... ... 43 Appendix 1………...48 Appendix 2 ………...49
List of Tables
Table 1 The function of inveatment behavior ... 18
Table 2 Share of the additional returns to obtain extra matrix for VC firm 1 and VC firm 2 upon different competition strategy ... 20
Table 3 The return matrix for VC firm 1 and VC firm 2 upon different competition strategy ... 34
Table 4 The optiomal investment threshold... 35
Table 5 Threshold values for different values of ... 38
Table 6 Threshold values for different values of ... 39
Table 7 Threshold values for different values of ... 40
Table 8 Threshold values for different values of ... 40
List of Figures
Fig. 1 Investment decisions environment……….2
Fig. 2 Managerial flexibility valuable ... 10
Fig. 3 Six variables that drive the real options analysis value ... 11
Chapter 1.
Introduction
1.1. Research Background
The Taiwan Venture Capital Industry 2008 Yearbook defines venture capital as follow: Venture capital is a monetary sum provided by investors to fund start-up companies with potential for rapid growth and a commensurate amount of risk. A venture capital fund is a professionally-managed pool of money that finances these high-risk, potentially high-reward companies or projects. Venture capital investors present capital for start-up companies seeking to expand, organize or reorganize, acquire or be acquired, or go public. Beyond providing capital, venture investors often assist start-up companies in the development of new products or services and add value to the company through active management participation and the contribution of experience and knowledge.
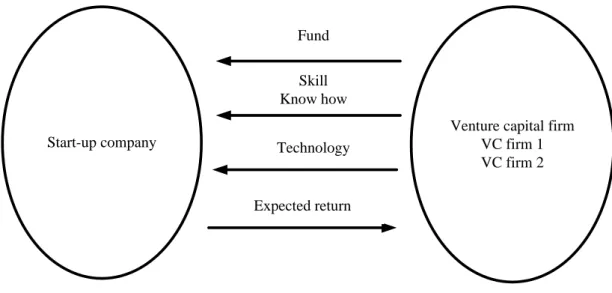
In general, venture capital funds serve the following functions: (1) Assisting these companies in the development of new products and services by providing support of production skills and exploring sales/distribution channels. (2) Taking higher risks in investment with the expectation of higher returns. (3) Making equity investment in the rapidly-growing high technology startup companies. (4) Adding value through active participation in strategies and operations of portfolio companies. This study makes explicit on a start-up company, which offers returns to venture capital firms. At the meanwhile, venture capital firms provide the capitals, skills, know how, and technology to the start-up company. Assume there are two co-related venture capital firms in the market willing to invest the start-up company, the investment decision environment illustrates as Fig.1.
Start-up company
Venture capital firm VC firm 1 VC firm 2 Fund Expected return Technology Skill Know how
Fig. 1 Investment decision environment
According to the Taiwan Venture Capital Industry 2008 Yearbook, the total number of venture capital investment firms increased from 114 in 1998 to 272 in 2007. On average, each VC investment team manages 5.32 VC funds and an average investment amount of NTD 2.1 billion. Owing to asymmetric information, when the VC firm invests in a highly risky industry, its investment decision is primarily based on the volatility of earnings from the invested start-up company.
VC firms should emphasize corporate risk management. The study focuses on the VC firms investing in the start-up companies under uncertainty. That is highly risky. The study applies real options, which provides the flexible implementable valuation to figure out the threshold to solve corporate risks.
1.2. Research Objectives
anticipate the appreciation of capital in the long term. They invest in the companies with the potential for rapid growth. As the status of the fledgling companies in which venture capitalists invest is highly uncertain, their earnings may drop as a result of the existence of potential competitors that grab the market share.
The study applies the real options approach (ROA) to evaluate the feasibility of the projects taken by these companies. Assume that a start-up company’s earnings per share (EPS) follows both the geometric Brownian motion (continuous process) and Poisson process (discrete process) in their jump-diffusion processes1, and the study applies the game theory to examine the investment behavior of two VC firms. The different competitive strategies adopted by these two VC firms reflect the potential response investment returns, which are assumed to be a hyperbolic function. The study further constructs an investment strategy model based on the market structures of an entry-deterred game (specific monopoly), a leader’s dominating strategies (duopoly), and simultaneous investment entries formed by the competitive behavior of the two VC firms in order to derive the optimal threshold value for investment decisions.
1.3. Research Question
There are many well-known enterprises, Compaq, Microsoft, Netscape, Intel, Starbucks, and Federal Express, received venture capital financing highlights the role of venture capital in backing fast-growth companies. It is often claimed that the young, rapidly growing companies generate a significant proportion of new jobs and economic growth (Hsu, 2010). The venture capital firm has stand dramatic growth. Therefore, the study will discuss that when the start-up company enters the market, it will attempt to make use of the established VC investment
1 A number of papers have addressed the stochastic differential equations includes Shimko (1992), Dixit and
companies. When the EPS under uncertain profitability is the decision variable, the study considers the previous investment and deferred investment behavior in the start-up company by VC firms and conducts a numerical analysis of entry decision threshold, relevant sensitivity analysis, and numerical example explanation.
Chapter 2. Literature Review
2.1. Venture Capital
Several authors have evaluated VC investment strategies. Lin and Huang (2004) noted that a start-up company raises funds from different types of VC firms and the most suitable VC entry mode is established with the reflection of investment profitability under the special effectiveness function. A start-up company encounters two kinds of VC firms: one is independent and the other is strategic. Due to asymmetric information, when VC firms invest in a highly risky industry, their investment decisions are primarily based on the volatility of earnings from the invested start-up company. Under risk aversion, the proposed model conducts the most suitable VC establishment aimed at the project investment support standard generated by VC firms. Lin et al. (2010) applied the ROA in which the entire model assumed that the expected discounted factor and the jump-diffusion process were incorporated into the ROA to assess the value of a start-up company and determine the threshold of the exit timing of liquidation or convertibility when establishing the optimal disinvestment pricing model for VC firms. When the project value is below VL, VC firms will carry out liquidation, but when the project value exceeds VC, VC firms will perform convertibility. When the project value ranges between
VL,VC
, the best choice is to delay decision-making and wait to carry out the rights of liquidation and convertibility in the future. The paper attempts to identify the expected discounted time in terms of the investment time for VC firms.Moreover, Kannianen and Keuchnigg (2003) mentioned that a VC firm not only had to provide capital support to the start-up company, but also had to increase the firm value. In a VC
investment project, the most appropriate amount of investment in the start-up company should be determined based on the stringent management problem. Concerning the volume of investment combination and the transaction condition between management consultants, it is especially important to reduce the management consultant fee of the combined investment company and the management cost of the VC investment expert. Rosenberg (2003) explained that the VC investment expert not only invests capital in the start-up company, but also invests professional knowledge, management technique, time, and business negotiation so as to help nurture the start-up company into becoming an enterprise of high profitability. Takezawa et al. (2007) applied an option framework to quantify the underlying risk and proposed an optimization problem to select the optimal ownership structure and supply contract for maximizing the total shareholders’ value of the parent.
To construct a firm, a start-up founder has to cluster a group of people with various kinds of expertise, gain access to capital and other resources, and act as a manager to implement a business plan. A person who can do this job effectively needs to have a wide range of skills. The entrepreneur needs to identify potentially profitable opportunities, assemble human and financial resources, launch the new venture, manage its growth, and build a viable business (Baron and Shane 2008). Lazear (2005) described the entrepreneur need to have a broad variety of skills. He has to be competent in many different areas and should have the ability to play various roles (manager, accountant, salesperson, chief engineer, etc). Zhang (2011) mentioned that earlier funding experience gives and entrepreneur some advantage in terms of the timing of early-stage VC funding and the size of VC deals. The paper used a large database of venture-backed companies and their founders to examine the advantage associated with prior founding experience. Compared with novice entrepreneurs, entrepreneurs with venture-backed founding
experience tend to raise more venture capital at an early round of financing and tend to complete the early round much more quickly.
Corporate venture capital is the identification of entrepreneurial-firm acquisition opportunities. Benson and Ziedonis (2010) found that takeovers of portfolio companies destroy significant value for shareholders of acquisitive corporate venture capital investors, even though these same investors are “good acquirers” of other entrepreneurial firms. Dimov and Gedajlovic (2010) observed the investment decisions of venture capital firms, for which a variety of property rights arrangements exits. The study presented how VC firms are characterized by important differences in how and to whom various property rights are allocated. The result found that these types of firm perform distinct roles in the ecology of VC financing. Knockaert et al. (2010) investigated the heterogeneity in the selection behavior of VCs using a unique hand-collected dataset comprising 68 European early-stage high-tech VC investors. The study showed that technology investors attach more importance to appropriability of the technology and contact with the entrepreneur than the other groups of VCs. For people investors, the human elements such as leadership capacities of the entrepreneur and the quality of the tram are most important. Financial investors make their investment decision based on a limited set of factors such as return on investment, growth and team completeness.
2.2. Risk Management
VC firms put funds into the start-up company with potential growth, as bearing high risks. Unsuccessful risk management can cause to a variety of problem, such as cost and schedule overruns, unsatisfied user requirements, and failure to deliver business value of investment (Chen et al., 2009). Wallace et al. (2004) surveyed 507 software project managers and this resulted in
six categories of risk: team, organizational environment, requirements, planning and control, user, and project complexity. These risks can be generally treated as private risks. It is not limited to information technology development process, but is extended to external factors. Risk produced by market conditions and competitive environments are also included by researcher (Benaroch, 2002). Benaroch (2002) built a four step option-based approach to managing information technology investment risk, which assisted a more inclusive identification of option configurations. Chen et al. (2009) described an approach based on real options to evaluate information technology investments subject to public risks and private risks. It was found that public risk has an upward effect on the expected payoffs, while private risk influenced the options value in a contrary way.
To identify an appropriate level of risk treatment has become a key strategy to make profits in today’s economy. Many researches regarding corporate optimum risk management have been done. Wu and Olson (2008) studied a variety of risk evaluation models within supply chains: chance constrained programming, data envelopment analysis, and multi-objective programming models. Wu et al. (2010) considered a three-dimensional early warning approach for product development risk management, which was proposed by integrating graphical evaluation and review technique with failure modes and effect analysis. Wu and Olson (2009a) discussed various risks modeling to optimize risk management. Risk management has become a key point to corporate development. Several risk evaluation methods even focus on measuring the risk value. The research has shown that the synthetic approaches to manage the risks facing an organization and the most effective ways to take risk include new business philosophies such as corporate risk management (Wu et al., 2006; Wu and Olson, 2009b; Wu and Olson, 2010a,b).
2.3. Real Options Approach and Game Theory
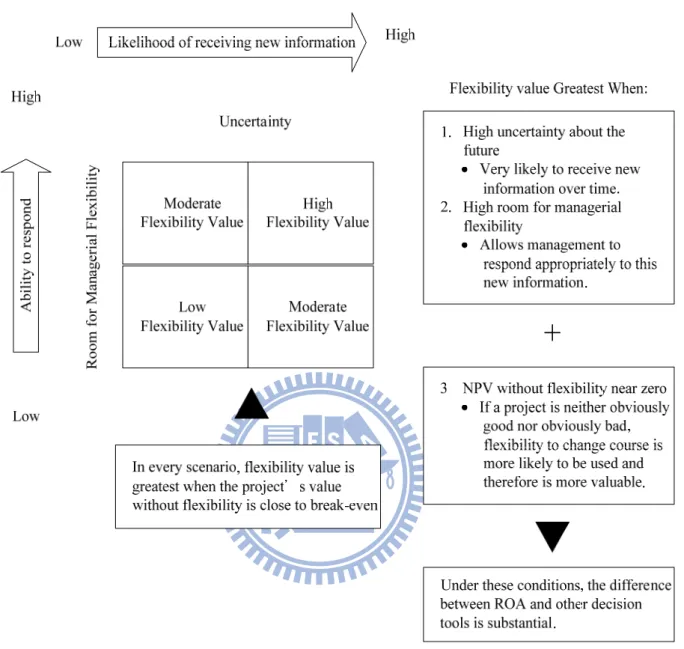
Real options analysis is one of the most appropriate methods for assessing the investments in VC firms involving uncertainty. Real options approach (ROA) provides some new insights with respect to the role and impact of uncertainty on investment value that runs counter to conventional thinking. Merton (1973) showed that investment was of higher option value in a more uncertain market because of the flexibility of the investment decision. When assessing the value of an investment project, apart from expected future net cash inflow, the assessment should include the management flexibility value implied by the uncertainty of the investment environment. This included the probability that managers will receive new information, have latitude for management flexibility, and the ability of decision-makers to respond to new information, etc. (Copeland and Antikarov, 2001). Clemons and Gu (2003) presented a partial information technology investment as an strategy option to preserve flexibility and to speed up subsequent choices, and saw completing the future contingent investments as exercising the strategic options created by initial investments. Taudes et al. (2000) implied that the value of information technology investment could be defined as the sum of economic value and option value. Cucchiella et al. (2010) explored the ROA help the manager to consider the manufacturing flexibility and, as a consequence, to improve firm performances. Fig.2 showed the managerial flexibility value (Copeland and Antikarov, 2001).
Fig. 2 Managerial flexibility value Source: Copeland et al. (2000).
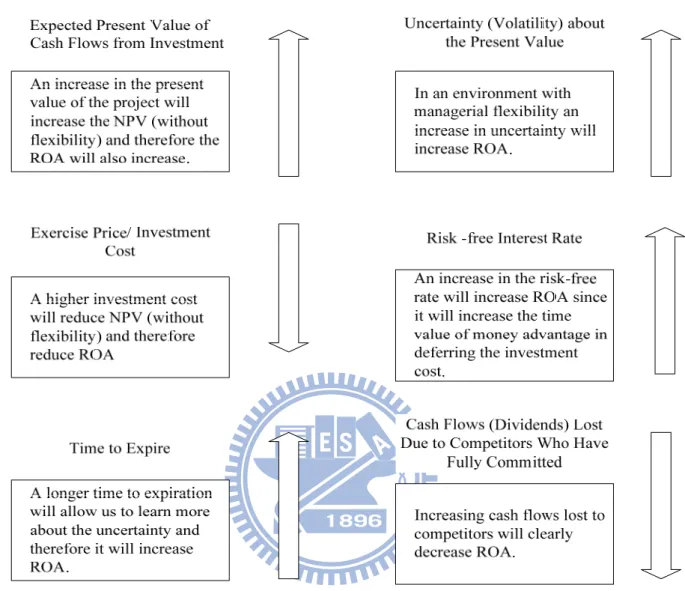
Real options are the right, but not obligation, to take an action, include deferring, expanding, contracting, or abandoning. The value of real options depends on six basic variables (Copeland and Antikarov, 2001). These six variables are illustrated in Fig. 3.
Fig. 3 Six variables that drive the real options analysis value Source: Copeland et al. (2000).
The traditional approach is to make investment decisions based on net present value. This assumes the existence of a static investment environment and takes only net cash flows into consideration. However, it is very important to analyze a dynamic investment environment in order to devise a flexible investment strategy to cope with future uncertainties in the investment environment. For that reason, the ROA has rapidly gained popularity as an investment decision method. The investment decisions based on the ROA emphasize the value of flexible
management and options ( Dixit and Pindyck, 1994). With regard to the management strategies of firms investing in uncertain environments, many such firms apply real options analysis (Chi, 2000; Reure and Leiblein, 2000), because of its ability to flexibly adjust investment strategies as new information is received.
In the recent years, scholars have stressed that the influence of decisions from competitors is also an important factor affecting the value of flexible management. Kulatilaka and Perotti (1998) suggested that when competitors appeared in the market, waiting to invest means forfeiting the first-mover advantage. Enterprises consequently cannot adopt a waiting strategy solely in view of market uncertainty and must take competitors into consideration when drafting investment strategies. As a result, the assessment of an investment case must therefore combine real options analysis with game theory. In a highly uncertain and complex investment environment, managers’ investment decision-making must employ a dynamic decision-making analysis model, and the real options approach was more capable to respond to complex investment environments than the traditional net present value method (Myers, 1977; Dixit and Pindyck, 1994). In addition, corporate strategies must be taken into consideration in order to further rationalize the expected results of analysis. Smit and Trigeorgis (2006) pointed out that strategic investment projects should be based on an expanded (or strategic) net present value (NPV) criterion that incorporated not only the passive (or direct) NPV of expected cash flows from investing immediately and the flexibility value from active management (real options), but also the strategic (game theory) value from competitive interactions. Smit and Ankum (1993) applied the game options principle as an analytical tool to evaluate a project’s value and support the overall operating and investment strategy. Smit (2003) showed that the game options approach could make a more complete assessment of a strategic option value in an interactive competitive setting. Miller and Waller
(2003) pointed out that project planning was an important decision management tool and encouraged managers to utilize real options to process investment evaluation under future uncertain conditions and to explore how to use the opportunity to evade potential threats. Yeo and Qiu (2003) suggested utilizing the ROA to allow for a more feasible judgment in making investment decisions.
Aloysius (2002) introduced the concept that the most suitable investment decision for investors involved cooperation via symmetrical information in the duopoly market. The advantage for competitor is that cooperation will not be the most appropriate approach. Kong and Kwok (2007) applied real options and game theory to analyze the oligopoly market. Assuming that there are two competing firms and they have incurred asymmetric sunk costs, there will be a leading investor in the market. The firm with a competitive edge will make the first investment, or the two firms will invest at the same time. If a firm is more competitive, it will enter the market by setting up an optimal investment threshold value for the market leader and follower. When the preemptive thresholds of both firms happen to coincide, the two firms will enter the market simultaneously. Smit and Trigeorgis (2006) applied real options and game theory to the investment planning of strategic alliances. Pawlina and Kort (2006) noted that in an oligopoly, the investment costs are asymmetric and there is an optimal investment strategy. The study’s result shows that a marginal increase in the investment cost of the firm with a cost disadvantage can enhance that firm’s own value within a certain range of the asymmetry level. Jin et al. (2009) used a financial tool “option-based” mathematical model for the joint production and the maintenance system provided useful maintenance decisions in the environment of uncertain demand. Hsu (2010) considered ROA to model venture capital investment opportunities. The paper found that staging not only gives the VC a waiting option but also mitigates the agency
problem of the entrepreneur undertaking too conservative activities.
De Giovanni et al. (2008) analyzed the dynamic structure of a return process using subordinated laws and showed how subordinated models can be used to price contingent claims. The subordinated asset price models will consider the hyperbolic model. Kalashnikov et al. (2009) justified the concept of conjectural variations equilibrium applied to the mixed duopoly model by demonstrating the concavity of the expected profit function. Huang and Hsu (2008) enhanced the capability of explaining intemporal decision-making behavior and proposed an anticipative hyperbolic discounted utility model that revised the conventional hyperbolic discounted utility model by introducing anticipative parameters under the consideration of the anticipation of future gains or losses. Therefore, the paper assumes that the investment additional returns to obtain extra from the competition between two competing VC firms form a hyperbolic function.
2.4. Jump-Diffusion Process
The continuous-time jump–diffusion modeling of asset return processes has a long history in finance (Merton, 1976). While the generalized Wiener process includes a broad relation of possible continuous processes, it is rarely of interest to study processes that change discretely at infrequent intervals. The Poisson process is suited this kind of revision. It is more ideally to model an economic variable as a process that makes infrequent but discrete jumps. An example would be entry by a new competitor in a market with only some firms, so that price suddenly drops.
Jump-diffusion process was suited for modeling purposes on the structure of risk model. It was more rational to model an economic variable as a process that makes occasional but discrete
jumps. Dixit and Pindyck (1994) suggested the price of oil as a mixed Brownian motion–jump process; during normal times the price fluctuates continuously, but the price could also take large jumps or fell if a war or revolution begins or ends. Chi (2010) assumed that the evolution of the profit followed a double exponential jump–diffusion process. Pennings and Sereno (2011) constructed a compound option approach for evaluating pharmaceutical R&D investment projects. Technical uncertainty was modeled as a Poisson jump that allows for failure and thus abandonment of the drug development. Feng (2011) used jump diffusion risk models a solution method to a general class of ruin-related quantities. Tauchen and Zhou (2011) researched investment grade bond spread indices, the estimated jump volatility had more forecasting power than interest rate factors and volatility factors including option-implied volatility, with control for systematic risk factors. The jump volatility risk factor seemed to capture the low frequency movements in credit spread and commoved counter cyclically with the price–dividend ratio and company default rate.
Kou and wang (2004) reported to incorporate the asymmetric leptokurtic features in asset pricing, a variety of models have been proposed, including, chaos theory, fractal Brownian motion, stable processes and time-changed Brownian motions. In a matching development, different models are also proposed to incorporate the “volatility smile” in option pricing. Popular ones are (a) stochastic volatility and GARCH models; (b) constant elasticity of variance (CEV) model; (c) normal jump diffusion models; (d) affine stochastic volatility and affine jump diffusion models; and (e) models based on Lévy processes. Therefore, this study attempts to adopts real options combining game theory, it evaluates theoretical models to figure out the threshold for earnings per share (EPS) based on following the geometric Brownian motion (GBM) involved in a Poisson jump-process.
Chapter 3. Research Model
3.1. Assumptions
The study adopts real options combining game theory, it evaluates theoretical models to figure out the threshold for earnings per share (EPS) based on following the geometric Brownian motion (GBM) involved in a Poisson jump-process. Assuming that there are only two VC firms in the newly created market, when they are interested in investing in the start-up company, the investment scale is equal, which means the same investment input. The different competitive and investment strategies of the two VC firms will be distinguished by the condition of a leader’s dominating strategies (duopoly), an entry-deterred game (specific monopoly), and simultaneous investment based on the market condition and competitor strategy of the project. Based on the investment of two VC firms, the start-up company can gain more additional returns to obtain extra and added values. Different strategies verify the additional returns to obtain extra. The two VC firms have different competitive advantages; although their investment inputs are the same, contributions and sharing are different.
The project value of the start-up company is affected by the external market environment and its operating condition. Assuming that the VC firm investing in the start-up company follows the stochastic EPS, P , the value variation growth over time is described by the jump-diffusion process which includes the GBM (continuous process) P and Poisson process (discrete process) G
D
P as follows:
G D
Among the above factors, : drift over time, : volatility over time, dW is the increment of a standard Wiener process W of zero mean and unit standard deviation dt , and
:the deterministic amplitude specifying the jump size (fall) in the jump-process 0 . 1
The jump-process follows the Poisson process with an arrival rate of and then dq and dW
are independent (so that E dW( dq) ) : 0
1, with prob. 0, with prob. 1 dt dq dt (2)
The stochastic P follows the jump-diffusion process because the start-up company is also affected by the competition from other firms. When the start-up company applies for new product development, P will decrease if competitors also apply for new patents.
Then, the different competitive and investment strategies of the two VC firms will be distinguished by the condition of a leader’s dominating strategies (duopoly), an entry-deterred game (specific monopoly), and simultaneous investment based on the market condition and competitor strategy of the project. Assume the start-up company and the two VC firms negotiate the additional returns to obtain extra and D x x( ,1 2) belongs to the two VC firms. That is the investments of the two VC firms’ different competition and investment strategies reflect the additional returns to obtain extra investment behavior function as D x x( ,1 2). D x x1( ,1 2) belongs to VC firm 1. D x x2( ,1 2) belongs to VC firm 2. Moreover D x x( ,1 2)=D x x1( ,1 2)+D x x2( ,1 2), among which:
1 2
x : VC firm 1 project decision.
(0: if VC firm 1 has not invested; 1: if VC firm 1 has invested). x : VC firm 2 project decision.
(0: if VC firm 2 has not invested; 1: if VC firm 2 has invested).
The study examines the market acceptance of the products of new ventures against the background of the market uncertainties of the two VC firms. It estimates the responses of the opponents under a competitive landscape in order to determine whether investments are viable. Table 1 illustrates possible scenarios. The study assumes that VC firm 1 is the leading competitor.
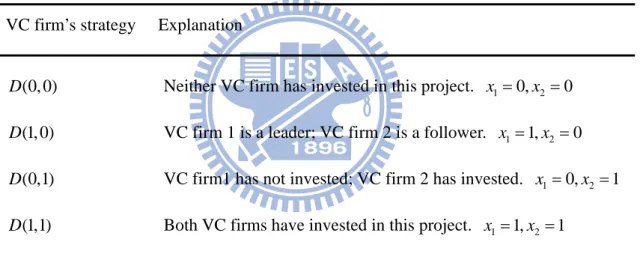
Table1. The function of investment behavior
VC firm’s strategy Explanation
(0, 0)
D Neither VC firm has invested in this project. x10,x2 0 (1, 0)
D VC firm 1 is a leader; VC firm 2 is a follower. x11,x2 0 (0,1)
D VC firm1 has not invested; VC firm 2 has invested. x10,x2 1 (1,1)
D Both VC firms have invested in this project. x11,x2 1
In order to conduct a further study on the effect generated by the additional returns to obtain extra D x x( ,1 2) behavior of both parties under a duopoly market, the correlation of variables x 1
and x is assumed as follows: 2
1 2 1 2
( , ) ( )( )
D x x x h x (3) k
It is assumed that the additional returns to obtain extra function are a hyperbolic function (Kalashnikov et al., 2009; De Giovanni et al., 2008; Huang and Hsu, 2008). Where h k, and R
1
k . k and h separately represent the technology, finance, market, and business h
know-how in VC firm 1 and VC firm 2. The study assume VC firm 1 as the market leader. Its business know-how has a comparative advantage, which is hard for VC firm 2 to compete. When dealing with the start-up company, VC firm 1 can have a better bargain. According to the assumption in the study, VC firm 1 can have larger shares of the pies in the start-up company. As the two VC firms intend to invest in the start-up company, their investment strategies are a function of mutual speculation and influence.
The additional returns to obtain extra of the two VC firms is expressed by Eqn. (3). Thus, it is assumed that D x x ,i( ,1 2) i1, 2 are the additional returns to obtain extra for VC firm 1 and VC firm 2 upon different investment strategies respectively. Meanwhile, the five investment stages are “Seed Stage”, “Startup Stage”, “Expansion Stage”, “Mezzanine Stage”, and “Turnaround Stage”. This study assumes that two VC firms implement the investment at the Startup Stage. For this stage, the start-up company has completed product development and needs further funds to initiate commercial manufacturing and sales. Logically, the start-up company has passed the seed stage. It owns the potential investment value before the EPS meets threshold, that is, VC firms implement the investment. The investment strategy, D
0, 0 , reflects the additional returns to obtain extra of the value function of the potential response investment D
0, 0 . h kWhen the two VC firms evaluate the benefits of investing in a start-up company, the four expected additional returns to obtain extra investment scenarios by different opponents’ reactions and their investment strategies are shown in Table 2.
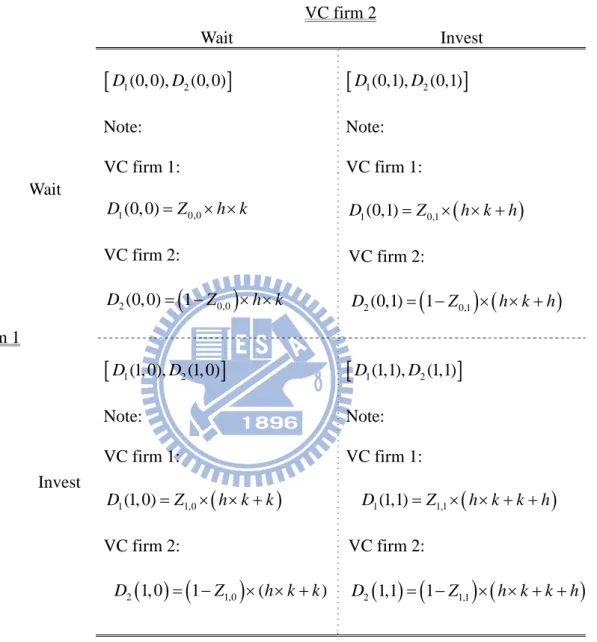
Table 2. Share of the additional returns to obtain extra matrix for VC firm 1and VC firm 2 upon different competition strategy
VC firm 2 Wait Invest VC firm 1 Wait
D1(0, 0),D2(0, 0)
Note: VC firm 1: 1(0, 0) 0,0 D Z h k VC firm 2:
2(0, 0) 1 0,0 D Z h k
D1(0,1),D2(0,1)
Note: VC firm 1:
1(0,1) 0,1 D Z h k h VC firm 2:
2(0,1) 1 0,1 D Z h k h Invest
D1(1, 0),D2(1, 0)
Note: VC firm 1:
1(1, 0) 1,0 D Z h k k VC firm 2:
2 1, 0 1 1,0 ( ) D Z h k k
D1(1,1),D2(1,1)
Note: VC firm 1:
1(1,1) 1,1 D Z h k k h VC firm 2:
2 1,1 1 1,1 D Z h k k hNote: 1. Distributing the additional returns to obtain extra in each cell for
VC firm1,VC firm 2
.2. Eqn. (3) is derived by the two VC firms’ additional returns to obtain extra sharing under different strategies:
(1)D x x( ,1 2)(x1h x)( 2k)x x1 2hx2kx1hkD x x1( ,1 2)D x x2( ,1 2).
(2)
1 2
1( ,1 2) x x, ( ,1 2)
D x x Z D x x ,D x x1( ,1 2)is the additional returns to obtain extra for
VC firm1.
(3)
1 2
2( ,1 2) 1 x x, ( ,1 2)
D x x Z D x x ,D x x2( ,1 2)is the additional returns to obtain extra
for VC firm 2.
3.
1,2
0Zx x , 1 Zx x1,2 is the distribution ratio for VC firm 1 under D x x( ,1 2).
1Zx x1,2
is the distribution ratio for VC firm 2.The four expected additional returns to obtain extra scenarios from the various opponents’ reactions and their investment strategies are as follows: (1)
D1(0, 0),D2(0, 0)
represents the condition that both VC firms are taking a waiting strategy. The expected additional returns to obtain extra are D(0, 0) . VC firm 1 shares h k D1(0, 0)Z0,0 and VC firm 2 shares h k2(0, 0) (1 0,0)
D Z , h k 0Z0,0 ; (2) 1
D1(1, 0),D2(1, 0)
: when VC firm 1 invests first while VC firm 2 adopts the waiting strategy, the expected additional returns to obtain extra are(1, 0)
D . VC firm 1 shares h k k D1(1, 0)Z1,0 (h k k) and VC firm 2 shares
2(1, 0) (1 1,0) ( )
D Z h k k , 0Z1,0 ; (3) 1
D1(0,1),D2(0,1)
: VC firm 1 delays investments by forgoing investment opportunities, while VC firm 2 remains interested in making investments. The expected additional returns to obtain extra are D(0,1) . VC firm 1 h k hshares D1(0,1)Z0,1 (h k h) and VC firm 2 shares D2(0,1) (1 Z0,1) ( h k h) ,
0,1
investing at the same time. Here, the expected additional returns to obtain extra are (1,1) 1
D . VC firm 1 shares h k h k D1(1,1)Z1,1 (1 h k k h) and VC firm 2 shares D2(1,1) (1 Z1,1) (1 , h k k h) 0Z1,1 . 1
Therefore, the four expected response investment additional returns to obtain extra are (1,1) (1, 0) (0,1) (0, 0)
D D D D . Since VC firm 1 and VC firm 2 implement the investments simultaneously, they adopt the cooperation strategy with synthetic effects viewing the market optimistically. The expected investment additional returns to obtain extra D(1,1) are the highest. The second is D(1, 0). VC firm 1 dominates the investment opportunity and sets a high threshold, which then makes VC firm 2 give up the investment opportunity. The third is D(0,1). VC firm 2 views the market optimistically, while VC firm 1 views it pessimistically. VC firm 2 implements the investment and then becomes specific monopoly as illustrated D
1, 0 D(0,1). The last is(0, 0)
D . Neither of the two VC firms enter the market although they are interested in investing and are the start-up company’s consultants. The market will reflect that and increase the returns. The start-up company will pay the consultation fees to the two VC firms. The descending of ranking is D(1,1)D(1, 0)D(0,1)D(0, 0). Below, the study attempts to conduct the market entry threshold under different market environments formed by different VC competition strategies.
3.2. Specific Monopoly Model
First, VC firm 1 delays or even opts out of investments due to its negative view of the market. However, VC firm 2 holds a different perspective. Believing that early investments will create a niche, it is determined to go ahead with investments. As a result, the market becomes a
specific monopoly. The potential profitability value of the entry-deterred game (specific monopoly) investment is M P and according to ( ) Ito's Lemma ( ˆˆ Ito , 1951), the increment can be calculated as follows:
2 1 ( ) ( ) ( ) ( (1 )) ( ) 2 P G PP G dM P M P dP M P dP M P M P dq (4)By incorporating Eqn. (1) and (2) into Eqn. (4), we can derive the following expected value:
2 2 1 [ ( )] ( ) ( ) ( (1 )) ( ) 2 P PP E dM P PM P P M P M P M P dt (5)
Here, the change of the potential profitability value is formed by the change of capital gains. Following the Bellman equation, the continuation region is given by:
2 2 2 2 ( ) ( ) (0,1) 1 ( ) ( ) ( (1 )) ( ) (0,1) 2 P PP M P dt E dM P P D dt PM P P M P M P M P P D dt (6)Where is a discount rate, and the above formula explains that the expected potential profitability value of the unit time is equivalent to EPS and can satisfy the assumption that the marginal EPS is quite reasonable (equivalent to the condition of satisfying the risk premium).
Furthermore, [ ( ) 1 2 2 ( ) ( (1 )) ( )]
2
P PP
PM P P M P M P M P dt
is formed by the
change of capital gains in unit time dt , and EPS multiplied by the additional returns to obtain extra P D 2(0,1)dt is formed by the cash flow change in unit time dt .
*
S
P
P0
solution part) and capital gains (see Appendix 2 for the general solution part). VC firms change in line with whether to implement the investment in the start-up company. As in the regionPPS of the Fig.4, VC firm 2 has not implemented the investment. At the stage, capital gains are based on waiting. When EPS meets the threshold value PS as PPS, that will be the optimal time for input sunk cost I . After the implementation, the region in Fig.4, PPS, means the expected cash flows. If the investment strategy of these two VC firm is D(0,1), VC firm 1 delays or even opts out of investments due to its depression of the market. However, VC firm 2 holds a different perspective. VC firm 2’s potential profitability value of the entry-deterred game (specific monopoly) investment is M P ; the value includes capital gains and cash flows. ( )
Fig. 4 Investment decisions
Thus it can be seen that the profitability value function of sole investment in the project is:
1 2 1 2 0, 0 , ( ) 0,1 , S S P D A P P P M P P D I P P (7)where 1 2 2 2 2 1 2 1 1 2 ( (1 ) ) 2 2 1
and it is assumed that
0
. Therefore, is the expected return, is the jump-diffusion process
following the Poisson process with an uncertain arrival rate, and is the magnitude of influence for the jump size in the jump-diffusion process. Here, I denotes the sunk cost of investment equity shares by VC firms, P represents the threshold of a specific monopoly S*
investment that VC firms invest in the start-up company, and A is the undetermined parameter. 1
However, the solutions in Eqn. (7) have straightforward economic interpretations. In the region P PS
, VC firm 2 chooses waiting to invest in the new start-up company. Its value
includes the expected potential investment returns, capital gains 1
1
A P , and the consultation fees
2(0, 0)
P D . Moreover, there is positive probability that P process will move into the region
S
PP at the certain future time when the investment will resume and profits P D2
0,1I
will accrue. The value M P when ( ) P PS
is just the expected present value of such future
flow. Next consider the region P PS
. Suppose for a moment that the firm is forced to continue
operation of the project forever (Dixit and Pindyck, 1994).
The value-matching condition (VMC) is utilized as follows: before the investment in the project, the profitability value function of the threshold is equivalent to the beneficial value function of the threshold after the investment in the project (which means the satisfactory value is the only condition). The smooth-pasting condition (SPC) is also utilized as follows: the marginal value of the project should be equivalent during the first order of differential function
(meaning the equivalent condition of satisfying the marginal value). According to the VMC and SPC (Dixit and Pindyck, 1994), the threshold PS and parameter A under the specific 1
monopoly of Eqn. (7) are indicated in the following Eqn. (8):
1 1 2 2 1 2 2 1 1 1 0, 0 0,1 : ( ) 0, 0 0,1 : ( ) S S S S P D P D VMC A P I D D SPC A P (8)After sorting Eqn. (8), the threshold PS and undetermined parameter A of the EPS of the 1
investment under the specific monopoly are as follows:
1 1 2 2 ( ) 1 (0,1) (0, 0) S I P D D (9)
1 1 2 2 1 1 0,1 (0, 0) (PS ) D D A (10)3.3. Leader’s Dominating Strategy (Duopoly) Model
Assuming that there are two VC firms in the newly created market, the leader invests in this project and the strategy for the follower is to wait for more opportune timing.
3.3.1. Follower’s Value Function and Threshold
The first step is to come up with the solution of the market entry threshold value for the follower (VC firm 2). When the leader (VC firm 1) has invested in this project, the potential profitability value of the follower’s investment is F P , and according to ( ) Ito's Lemma ( ˆˆ Ito ,
1951), the increment can be calculated as follows (derived from M P ): ( ) 1 2 1 2 (0, 0) , ( ) (1,1) , F F P D N P P P F P P D I P P (11)
Here, D2(1,1) denotes the additional returns to obtain extra for VC firm 2 when the two VC firms enter the market at the same time, PF represents the threshold of the duopoly of the follower’s investment, and N is the undetermined parameter. The value-matching condition 1 (VMC) is utilized as follows: before the investment in the project, the profitability value function of the threshold is equivalent to the beneficial value function of the threshold after the investment in the project (which means the satisfactory value is the only condition). The smooth-pasting condition (SPC) is also utilized as follows: the marginal value of the project should be equivalent during the first order of differential function (meaning the equivalent condition of satisfying the marginal value). According to the VMC and SPC (Dixit and Pindyck, 1994), the threshold PF and undetermined parameter N under the duopoly of the follower are indicated 1
in Eqn. (12): 1 1 2 2 1 1 2 2 1 1 (0, 0) (1,1) : ( ) (0, 0) (1,1) : ( ) F F F F P D P D VMC N P I D D SPC N P (12)
After sorting Eqn. (12), the threshold PF and undetermined parameter N of the EPS of 1
1 1 2 2 ( ) 1 (1,1) (0, 0) F I P D D (13) 1 1 2 2 1 1 (PF ) D (1,1) D (0, 0) N (14)
3.3.2. Leader’s Value Function and Threshold
Before the follower invests in this project, the leader can obtain P D 1(1, 0) return. However, when the follower invests in the market, the return will change to P D 1(1,1), where
( )
L P is the potential profitability value of the leader. According to Ito's Lemma ( ˆˆ Ito , 1951),
the increment is described as follows (derived from M P ): ( )
2 2 1 [ ( )] ( ) ( ) ( (1 )) ( ) 2 P PP E dL P PL P P L P L P L P dt (15)
Here, the change of the potential profitability value is formed by the change of capital gains.
Following the Bellman equation, the continuation region is then given by:
1 2 2 2 2 1 2 2 ( ) ( ) (1, ) , 0,1 1 ( ) ( ) ( (1 )) ( ) (1, ) , 0,1 2 P PP L P dt E dL P P D x dt x PL P dt P L P dt L P L P dt P D x dt x (16)As mentioned above, the change of the potential profitability value is formed by the changes of capital gains and cash flows.
Moreover, 1 2 2 ( ) ( ) ( (1 )) ( ) 2 P PP PL P P L P L P L P dt is formed by the
change of capital gains in unit time dt , and EPS multiplied by the additional returns to obtain extra P D 1(1,x dt x2) , 2 0,1 is formed by the change of cash flow in unit time dt . When
F
PP, the potential profitability value function of the leader’s investment in the project is:
1 2 1 1 2 (1, 0) ( ) P D L P E P E P (17)
where E E are the parameters of the pending decision. To satisfy the boundary condition, 1, 2 when P , the potential profitability value function ( )0 L P is equal to 0; when PF
is
discounted to PL, the potential profitability value function is equal to the profitability value function of PPF as follows: 1 (0) 0 (1,1) ( ) F F L P D L P (18)
After sorting Eqns. (17) and (18), the undetermined parameters E E and potential 1, 2 profitability value function of the leader’s investment L P are as follows: ( )
1 1 1 1 1 2 (1,1) (1, 0) ( ) 0 F D D E P E (19)
1 1 1 1 1 (1,1) (1, 0) (1, 0) , ( ) (1,1) , F F F F P D D P D P P P P L P P D P P (20)The potential project value G P before the leader’s investment is ( ) 1 1 K P P D1(0, 0)
(the inference is the same as shown in Appendix 1 and 2) and K is the undetermined parameter 1 for the value of capital gains of the project before the leader’s investment. For the VMC, before investing in the project, the profitability value function of the leader threshold is equivalent to the beneficiary value function of the leader threshold. The profitability value L P( L) of the project invested by the leader under the threshold PL is equivalent to the potential investment profitability value of the leader G P( L )
plus the sunk cost of investment I . That is:
( L ) ( L )
G P I L P (21)
For the SPC, the marginal value of the project and under the equivalent first order of differentiation, the undetermined parameter K and the threshold 1 PL
can be found and after arrangement the result is as shown as Eqn. (22):
1 1 1 1 1 1 1 1 1 1 1 1 1 1 1 1 (0, 0) (1, 0) : ( ) ( ) (0, 0) (1, 0) : ( ) ( ) L L L L L L P D P D VMC K P E P I D D SPC K P E P (22)
After sorting Eqn. (22), the threshold PL
and undetermined parameter K of the EPS of 1 the investment under the duopoly of the leader are as follows:
1 1 1 1 ( ) 1 (1, 0) (0, 0) L I P D D (23)
1 1 1 1 1 1 1 (PL ) D(1, 0) D(0, 0) K E (24)
3.4. Simultaneous Investment Model
Assuming that two VC firms enter into investment simultaneously, as well, VC firm 1 and VC firm 2 implement strategies of cooperation. According to ˆIto's Lemma ( ˆIto , 1951), the increment is described as follows (derived from M P ): ( )
1 1 0, 0 , ( ) 1,1 , J J P D H P P P J P P D I P P (25)The value-matching condition (VMC) is utilized as follows: before the investment in the project, the profitability value function of the threshold is equivalent to the beneficial value function of the threshold after the investment in the project (which means the satisfactory value is the only condition). The smooth-pasting condition (SPC) is also utilized as follows: the marginal value of the project should be equivalent during the first order of differential function (meaning the equivalent condition of satisfying the marginal value). According to the VMC and SPC (Dixit and Pindyck, 1994), the threshold PJ and parameter H under the simultaneous investment 1
are: 1 1 1 1 1 1 (0, 0) (1,1) : ( ) (0, 0) (1,1) : ( ) J J J J P D P D VMC H P I D D SPC H P (26)
After sorting Eqn. (26), the threshold PJ
and undetermined parameter H of the EPS of 1 the investment under the simultaneous investment are as follows:
1 1 ( ) 1 (1,1) (0, 0) J I P D D (27) 1 1 1 1 (PJ ) D(1,1) D(0, 0) H (28)
Chapter 4. Numerical Example
4.1. Data Assumptions
The numerical analysis is based on the Taiwan Venture Capital Industry 2008 Yearbook, published by the Taiwan Venture Capital Association (TVCA) and the Taiwan Economic Journal to determine relevant variables. The assumed parameter value of this section is as follows: the drift over time 0.22 , the volatility over time 0.56, the discount interest rate 0.39, the deterministic amplitude specifying the jump size in the jump-process 0.28, the arrival rate 0.18, and the sunk cost I 18 million. The potential response investment return function is D x x( ,1 2)(x1h x)( 2 and then k) h million and 3 k million. Furthermore, 5 the numerical analysis example assumes (1) Z0,0 0.5. Neither VC firm has invested enter the market since they wait for the investment opportunities. The equal investment opportunities share fifty percent of return investment expectation; (2) Z1,0 . VC firm 1 implements the investment 1 first; meanwhile, VC firm 2 adopts the waiting strategy. Assume VC firm 1 is the market leader and the only one in the market. VC firm 1 can set up a high entry threshold based on competitive advantages. That drives VC firm 2 to give up the investment. Then, VC firm 2 shares zero percent of return investment expectation; (3) Z0,1 . VC firm 1 gives up the investment 0 opportunity due to a pessimistic view on the market; meanwhile, the return investment expectation is 0; (4) Z1,10.5 These two VC firms implement the investment at the same time and share fifty percent of return investment expectation. The potential response investment returns for the two VC firms adopting different investment strategies are shown in Table 3.
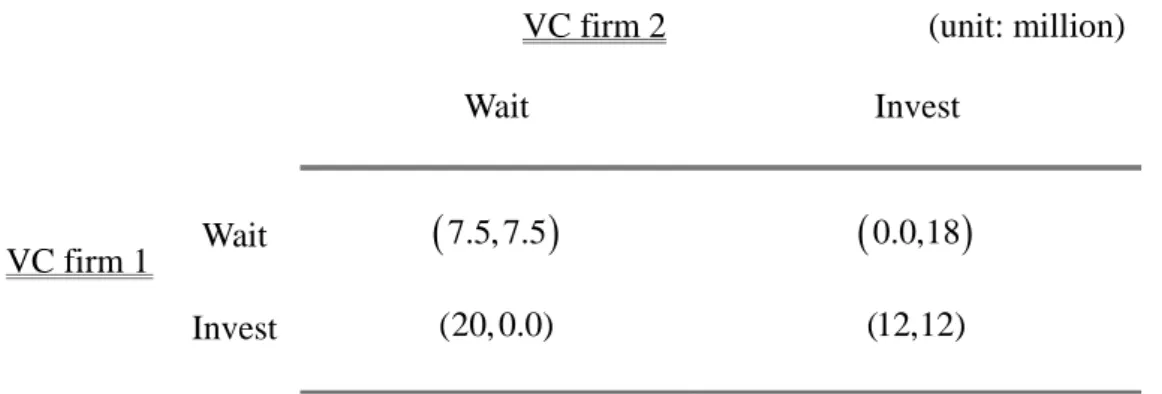
Table 3. The returns matrix for VC firm 1and VC firm 2 upon different competition strategy
VC firm 2 (unit: million)
Wait Invest
VC firm 1 Wait
7.5, 7.5
0.0,18
Invest (20, 0.0) (12,12)
Note: Eqn. (3) is derived by the two VC firms’ additional returns to obtain extra sharing under different strategies:
1. D x x( ,1 2)(x1h x)( 2k)x x1 2hx2kx1hkD x x1( ,1 2)D x x2( ,1 2).
2.
1 2
1( ,1 2) x x, ( ,1 2)
D x x Z D x x ,D x x1( ,1 2)is the additional returns to obtain extra for
VC firm1.
3.
1 2
2( ,1 2) 1 x x, ( ,1 2)
D x x Z D x x ,D x x2( ,1 2)is the additional returns to obtain
extra for VC firm 2.
4. D(0, 0)D1(0, 0)D2(0, 0)15.
5. D(0,1)D1(0,1)D2(0,1)18.
7. D(1,1)D1(1,1)D2(1,1)24.
4.2. Results
Different market structures, including the specific monopoly, the leader’s dominating strategies (duopoly), and simultaneous entry are formed into the model according to different investment strategies of the two VC firms. The numerical analysis is based on the assumptions of the aforesaid parameter values and the model developed in Section 2 so as to derive the optimal market entry EPS threshold values under the optimal investment strategy. By combining with the previous simulated parameter value, the results are collectively arranged as in Table 4.
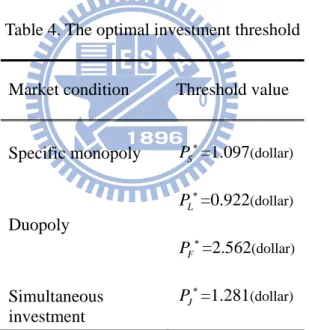
Table 4. The optimal investment threshold
Market condition Threshold value
Specific monopoly PS =1.097(dollar) Duopoly L P=0.922(dollar) F P=2.562(dollar) Simultaneous investment J P=1.281(dollar)
The calculation result of the numerical example is as follows. It is assumed that VC firm 1 is the market leader. If the market leader forgoes investment opportunities and VC firm 2 continues to invest, the market will become an entry-deterred game (specific monopoly). In this instance, the EPS threshold value under the optimal investment strategy is PS=1.097 (dollar). If the investment environment is growing optimism, VC firm 1, as the market leader, will invest as
soon as possible. In this instance, the EPS threshold value of the market leader under the optimal investment strategy is PL=0.922 (dollar). Because VC firm 2 is the market follower, the EPS threshold value of the market follower under the optimal investment strategy is PF=2.562 (dollar). Another possible scenario is that both VC firms cooperate and invest at the same time in order to create synergy and a win-win result. Accordingly, the EPS threshold value under the optimal investment strategy is PJ=1.281 (dollar).
By summarizing the above-mentioned results and based on the collective sorting of the value functions of various stages and relevant thresholds, the correlation can be described as shown in Table 4, which explains when the market becomes a duopoly, the threshold for the market leader PL=0.922 (dollar) is lower than that for the follower PF=2.562 (dollar) because the market leader boasts competitive advantages and is the first to make investments. The investment strategy of the market follower in a duopoly is more conservative because the market leader is already in the market. Unless new companies demonstrate obvious advantages, the market follower will simply wait for future investment opportunities. Therefore, the EPS threshold value of the investment strategy is higher at PF=2.562 (dollar). However, if the market leader chooses to drop investment opportunities, but the market follower goes ahead with investments, the investment market will become an entry-deterred game (specific monopoly). Because the market leader forgoes investment opportunities, the market follower will become more cautious in evaluating the investment environment. The decision maker requires a higher EPS to enter the market. The EPS threshold value of the investment strategy is PS=1.097 (dollar). Under the scenario that the two VC firms collaborate to generate synergy and achieve a win-win result, their investment strategies will become more competitive between VC firms.
Therefore, the EPS threshold value under the optimal investment strategy is PJ=1.281 (dollar). In the overall market, both VC firms enter the market. VC firm 1 is the earliest entrant in the duopoly market. The second entrant to the market is the entry-deterred game (specific monopoly) and then the simultaneous entries of the two VC firms working together. The latest entrant to the market is the market follower in a duopoly market. Its investment strategy is also the most conservative.
The numerical analysis is based on the Taiwan Venture Capital Industry 2008 Yearbook, published by the Taiwan Venture Capital Association (TVCA). During the period from 1984 to 2007, the average annual EPS of VC firms were 0.51 (dollar). The average annual EPS of the sampled VC firms was the highest at 2.06 (dollar) in 2000, while the lowest at -1.47 (dollar) in 1986. In 1998, the average EPS of the top 10 VC firms was as high as 6.52 (dollar). The investment horizon of the seed stage was as long as five years. However, some VC firms reported losses. For example, 30% (number of write-offs) of the investments suffered from losses in 2007. The rate was even higher at 50% (number of write-offs) in 2006. Compared with the analysis of the values in the study, the derived EPS threshold value for the market entry of VC firms is higher than the average annual EPS according to TVCA statistics. This is because there is a high number of write-offs and that is also why VC firms are conservative in their investments in start-up companies. They tend to take action when the external environment is ripe for investments. However, the average EPS of the top10 VC firms was once as high as 6.25 (dollar). That also entices the market leader to enter the market when the EPS hits the threshold value of
L
4.3. Sensitivity Analysis
This section describes the sensitivity analysis on the relevant variables presented in the study: the volatility over time , the discount rate , the achievement rate , the deterministic amplitude specified for the jump size(fall) in the jump-process , etc. It is assumed that other parameters are constant when exploring the influence of the change of a single parameter on the optimal threshold value.
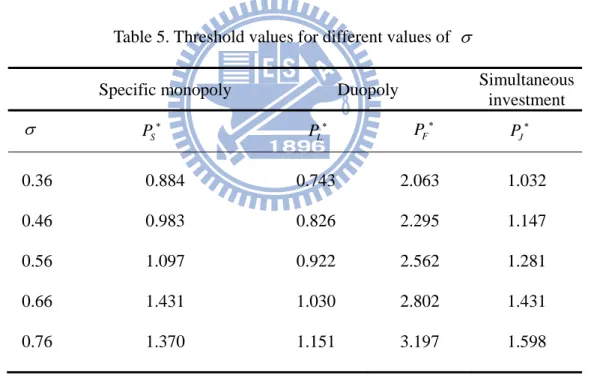
First, the study focus on the volatility over time . Table 5 lists the influence of its change on the optimal threshold value under the optimal investment decisions.
Table 5. Threshold values for different values of
Specific monopoly Duopoly Simultaneous
investment 0.36 0.884 0.743 2.063 1.032 0.46 0.983 0.826 2.295 1.147 0.56 1.097 0.922 2.562 1.281 0.66 1.431 1.030 2.802 1.431 0.76 1.370 1.151 3.197 1.598
As shown in Table 5, when increases, the levels of uncertainties and risks associated with the investments by VC firms in the start-up company also increase. The optimal threshold value rises as a result. When the risk increases, decision makers will adopt a waiting strategy and hope for better opportunities as they are pessimistic about the investment environment.
S P PL F P PJ
Table 6 shows the influence of the change of the discount rate on the optimal threshold value under the optimal investment decisions.
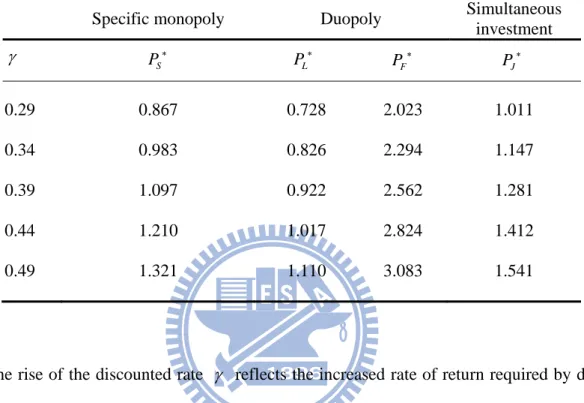
Table 6. Threshold values for different values of
Specific monopoly Duopoly Simultaneous
investment 0.29 0.867 0.728 2.023 1.011 0.34 0.983 0.826 2.294 1.147 0.39 1.097 0.922 2.562 1.281 0.44 1.210 1.017 2.824 1.412 0.49 1.321 1.110 3.083 1.541
The rise of the discounted rate reflects the increased rate of return required by decision makers. At this point, investment strategies become conservative. No investments will be made until EPS grows to a higher level. The optimal threshold value under the optimal investment decisions will also increase.
Tables 7 and 8 respectively show the influences of the changes of the achievement rate and the magnitude of influence for the jump size (fall) in the jump-process on the optimal threshold value under the optimal investment decisions.
S P PL F P PJ