國人不孕症盛行率調查及環境賀爾蒙壬基苯酚與男性精液品質相關性探討
79
0
0
全文
(2) 致謝 研究所的生活彷彿昨日到今日,ㄧ切總是讓人措手不及。幸運的是, 在這兩年自己可以遇到可以為學生盡心盡力的好老師,宋鴻樟老師,為 人慈祥、謙卑,做學問時又可以感受到老師對研究態度的嚴謹。這份碩 士論文之所以能夠如期完成,在所有指導自己實驗的老師,實在是功不 可沒,郭錦堂老師、吳錦景老師、葉志清老師等,願意挪出自己寶貴的 時間來指導,心中除了感謝還是感謝。此外,婦產科不孕症門診李茂盛 醫師與其研究團隊在收樣時的幫忙也是這次研究順利完成相當重要的ㄧ 環。辦公室的學長姐,鈴雅學姊、建彰學長也在統計分析上給了我許多 寶貴的意見。最後,ㄧ定要感謝這次碩士論文口試的委員,宋鴻樟老師、 毛義方老師、李茂盛醫生及郭錦堂老師,可以授予對這份研究的肯定。. I.
(3) 摘要 不孕症隨著工業化的發展似乎有越來越嚴重的趨勢,其中男性精液 品質降低的證據也經過許多研究證實。環境賀爾蒙壬基苯酚具有弱的雌 激素作用,並具生物累積作用,推測可能對精液品質下降也有影響。 本研究首先利用健保歸人檔探討台灣不孕盛行情況,區分病因別、 年齡、區域別、都市化程度分別探討不孕症盛行率,以及不孕症婦女懷 孕情形。 另外於中部一不孕症診所執行一橫斷式研究,探討環境賀爾蒙壬基 苯酚與男性精液品質的相關性;100 位男性同意並參與此試驗,透過問卷 訪視,收取社會人口學變項、生活習慣、飲食習慣等資訊。並收集男性 尿液,分別利用高效能液相層析儀及酵素連結免疫吸附分析法分析壬基 苯酚內在暴露量及 DNA 氧化損害能力指標(8-hydroxydeoxyguanosine)。 自 1996 年至 2003 年,台灣不孕症盛行情形,女性遠比男性高 5. 5. (576-681/10 vs. 73-133/10 ),男性及女性不孕的就診病患分別集中於 30-35 歲及 25-35 歲。男性不孕的病因大多屬於非特異性(88%),女性不 孕的病因除了非特異性(77%),無卵性月經也佔了多數(18%)。依都市化 程度去觀察女性不孕症盛行的情形,自 1998 年後,都市化高地區的女性 不孕症較盛行。八年間總計有 3078 名女性不孕者,其中 47%經治療而懷 孕成功。 依據尿液分析,男性研究對象的壬基苯酚內在暴露量平均為 16.4 μ g/g creatinine,在生活習慣上,長期服用保健食品者其壬基苯酚含量 高於未服用保健食品者(19.7 vs. 14.2μg/g creatinine, p < 0.05), 蛋類及沙拉的攝取較多者,壬基苯酚內在暴露量有增加的趨勢。 尿液壬基苯酚濃度與氧化損害能力有顯著的相關。在評估精子數目 正常與否與壬基苯酚內在暴露量的差異,精子數目不正常男性相對於正. II.
(4) 常男性有較高的壬基苯酚濃度(20.2 vs. 14.0 μg/g creatinine )。壬 基苯酚濃度超過 17.37 μg/g creatinine,精子數目不正常的相對危險 性為 4.31,控制其他因子後為 4.85,皆達到統計上顯著關係。 男性的精子數目可能與壬基苯酚內在暴露量有相關,尿液壬基苯酚 濃度較高的男性,需進ㄧ步配合飲食調查來釐清。. 關鍵字:飲食、不孕症、健保歸人檔、壬基苯酚、DNA 氧化損害能力指標. III.
(5) Abstract The prevalence of infertility is in increasing trend among populations in the industrial countries. The decrement of sperm quality among populations has been also proved by several researches. One of the evidences has been associated with environmental hormone. Nonylphenol, one of environmental hormones possessing weak oestrogenic effect and biological accumulation, may result in abnormal semen quality. The reimbursement claim data for medical services obtained from the National Health Insurance (NHI) program were used to analyze the prevalence of infertility and the pregnancy rate among infertile women with medical assistances. In addition, a cross-sectional study was conducted at an infertile clinic in Middle Taiwan. With IRB approval and informed consented, 100 males were recruited to this study. A questionnaire consisted of information on socio-demographic characteristics, lifestyle, and dietary consumption was completed by each participant and a urine specimen was collected. Urinary nonylphenol level and 8-hydroxydeoxyguanosine were detected using high performance liquid chromatography and ELISA kit, respectively. The infertility clinic provided the information on sperm quality examined for the participants. From 1996 to 2003, 3078 women and 605 men received infertile cares in a cohort of 200,000 established in the NHI program. The prevalence rate of infertility in females were higher than that in males (576-681/105 VS. 73-133/105 or). Approximately 80% infertile males and 87% females were in ages 30 to 39 years. Among infertile persons, 88% males and 77% females were diagnosed as unspecified origin. Around 47% of 3078 infertile females became pregnant after medical assistances. The average urinary nonylphenol level measured for the 100 males recruited at the infertile clinic was 16.4μg/g creatinine. The average concentration of urinary nonylphenol was higher in men who used healthy IV.
(6) food than in men who didn’t use (19.7 vs. 14.2μg/g creatinine, p < 0.05). Urinary nonylphenol level increased with the increment of consumption of egg and salad. There was significant association between urinary nonylphenol level and 8-hydroxydeoxyguanosine. Males with abnormal sperm concentration have higher urinary nonylphenol level than those with normal sperm concentration (20.2 vs. 14.0 μg/g creatinine). The odds ratio of abnormal sperm concentration was 4.31 for men with the urinary nonylphenol level excess 17.37 μg/g creatinine, compared with men with the level below 12.15 μg/g creatinine. After adjusting for other variables, the odds ratio increased slightly to 4.85 (p < 0.05). Males exposed to nonylphenol may associate with the decrement of sperm concentration. Males with higher urinary nonylphenol level need to be investigated on their food consumption in advance. Keywords: diet, infertility, National Health Insurance, nonylphenol level, 8-hydroxydeoxyguanosine. V.
(7) 目錄 致謝…………………………………………………………………………...I 摘要…………………………………………………………………………..II Abstract……………………………………………………………...……...IV 目錄…………………………………………………………………….........VI 表目錄………………………………………………………………….........IX 圖目錄………………………………………………………………….........XI. 第一章 、緒論................................................1 1-1 研究背景與研究動機.................................... 1 1-2 研究的重要性.......................................... 2 1-3 研究目的 ............................................. 3 1-4 研究問題與研究假設.................................... 3. 第二章 、文獻探討............................................4 2-1 壬基苯酚特性.......................................... 4 2-2 壬基苯酚之生物濃縮性.................................. 4 2-3 壬基苯酚生殖危害...................................... 5 2-4 精液品質下降趨勢調查.................................. 6 2-5 影響精液品質因素...................................... 7 2-6 台灣壬基苯酚的流布.................................... 9. VI.
(8) 第三章 、研究方法...........................................10 3-1 健保歸人檔不孕症分析................................. 10 3-2 壬基苯酚和男性不孕症 ................................ 12 3-2-1 研究設計 ....................................... 12 3-2-2 研究對象 ....................................... 12 3-2-3 研究工具擬定 ................................... 12 3-2-4 實驗室樣本處理分析............................. 13 3-2-4-1 肌酸酐分析................................ 13 3-2-4-2 壬基苯酚分析.............................. 15 3-2-4-3 精液分析.................................. 18 3-2-4-4 8-OHdG 分析 ............................... 20 3-3 統計資料與分析....................................... 21 3-4 研究架構 ............................................ 23 3-4-1 不孕症健保資料庫分析 ........................... 11 3-4-2 壬基苯酚、8-OHdG 與男性精液品質相關性探討....... 22 第四章 、 結果..............................................23 4-1 國人不孕症盛行率調查................................. 23 4-2 壬基苯酚與精液品質相關性探討 ........................ 33 4-2-1 男性社會人口學、生活型態及飲食習慣基本資料 ..... 33. VII.
(9) 4-2-2 社會人口學、生活型態及飲食習慣對男性壬基苯酚內在暴 露量的影響...................................... 34 4-2-3 社會人口學、生活型態對男性精液品質的影響 ....... 41 4-2-4 尿液中壬基苯酚含量與精液品質相關性探討 ......... 45 4-2-5 精液品質正常與否與壬基苯酚內在暴露量比較 ....... 46 4-2-6 探討影響精子數目正常與否相關性因子 ............. 48 4-2-7 壬基苯酚內在暴露量與精液品質正常與否之相對危險 性................................................... 54 第五章 、 討論..............................................58 第六章 、 結論與建議........................................60 第七章 、 參考文獻..........................................61. VIII.
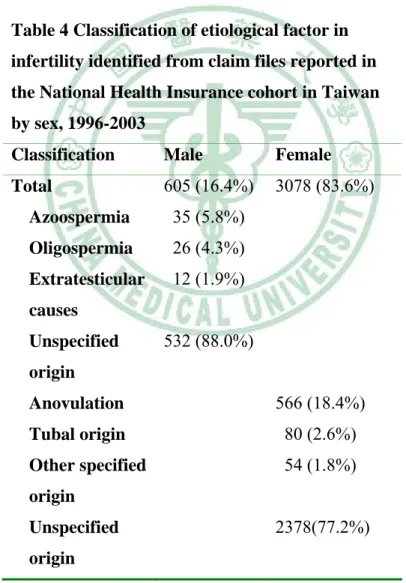
(10) 表目錄 Table 1 Prevalence of infertility and new-cases reported in National Health Insurance cohort in Taiwan from 1996 to 2003……………………………..24 Table 2 Prevalence of infertility and new-cases reported in National Health Insurance cohort for males in Taiwan from 1996 to 2003.…….....................25 Table 3 Prevalence of infertility and new-cases reported in National Health Insurance cohort for females in Taiwan from 1996 to 2003….......................26 Table 4 Classification of ecological factor in infertility identified from claim file reported in the National Health Insurance cohort in Taiwan by sex, 1996-2003………………………………….………………….......................27 Table 5 Distribution of infertile cases identified from claim file reported in the National Health Insurance cohort in Taiwan by age, district, urbanization and sex from 1996 through 2003…………….…………................................29 Table 6 Odds ratio for infertility with GD, age, district, and urbanization……………………………………………………………….....31 Table 7 Number of women with successful recovery from infertility and type of delivery by type of infertility identified from claim file reported in the National Health Insurance cohort in Taiwan from 1996 through 2003……………………………………………………………………….....32 Table 8 Distributions of urinary nonylphenol and 8-hydroxydeoxyguanosine in males by socio-demographic characteristics…………………………………………………….……….....36 Table 9 Distributions of urinary nonylphenol and 8-hydroxydeoxyguanosine in males by lifestyle ………….……………………………………………...37 Table 9 Distributions of urinary nonylphenol and 8-hydroxydeoxyguanosine in males by lifestyle (continued)……………………………………………………..……….. …..38 Table 10 Distributions of urinary nonylphenol and 8-hydroxydeoxyguanosine in males by dietary consumption….................................................................39 Table 10 Distributions of nonylphenol and 8-hydroxydeoxyguanosine in males by dietary consumption (continued)………..………….…..................40 Table 11 Distributions of sperm quality in males by socio-demographic characteristics……………………………………………………..……........42 Table 12 Distributions of sperm quality in males by lifestyle........................43 Table 12 Distributions of sperm quality in males by lifestyle (continued).......................................................................................................44 Table 13 The pearson correlation among age, body mass index, urinary. IX.
(11) nonylphenol, urinary 8-hydroxydeoxyguanosine, and quality of sperm………………………….......................................................................45 Table 14 Average urinary concentration of nonylphenol and 8-hydroxydeoxyguanosine by sperm quality based on concentration, mobility and morphology of sperm…………………………………………………...47 Table 15 Comparison between abnormal and normal sperm concentrations by socio-demographic characteristics………………..........................................49 Table 16 Comparison between abnormal and normal sperm concentrations by lifestyle…………………...……………………………………………….....50 Table 16 Comparison between abnormal and normal sperm concentrations by lifestyle (continued)……………………………………………………….....51 Table17 Comparison between abnormal and normal sperm concentrations by dietary consumption………………………...…………………………….....52 Table17 Comparison between abnormal and normal sperm concentrations by dietary consumption (continued)………………........................................…53 Table 18 Odds ratio for abnormal sperm concentrations associated with NP level in logistic regression……..…………………... …………………..…..55 Table 19 Odds ratio for abnormal sperm mobility associated with NP level in logistic regression……………..………….…………………........................56 Table 20 Odds ratio for abnormal sperm morphology associated with NP level in logistic regression…………………..……………………....……....57. X.
(12) 圖目錄 Figure 1: Annual infertility rate (per 100000) identified from claim file reported in the National Health Insurance cohort in Taiwan from 1996 to 2003………………………………………………………….……………....24 Figure 2: Annual infertility rate (per 100000) in males identified from claim file reported in the National Health Insurance cohort in Taiwan from 1996 to 2003…………………………………………..……………………….……..25 Figure 3: Annual infertility rate (per 100000) in males identified from claim file reported in the National Health Insurance cohort in Taiwan from 1996 to 2003………………………………….............……..…………………….….26. XI.
(13) 第一章 緒論 第一節. 研究背景與研究動機 過去二十年間越來越多研究報導,在工業化國家不孕症的盛行率有 上升的趨勢. 1-6。. 不孕症定義為:夫妻結婚之後,有正常的性行為關係,每. 週維持 2~3 次的頻率,而且沒有採取任何避孕的措施,超過一年以上, 7. 仍然沒有懷孕的跡象 。在台灣,估計大約有 15%的夫婦面臨不同程度的 生育問題,男性不孕的原因,以精液品質不佳為主,如精蟲數目過少、 活動力不足等等。許多針對精液品質的調查研究,也確實證實精液品質, 不論是精蟲數目、活動力、正常形態比例,皆有下降的趨勢. 8-14. 。. 影響精液品質的因素有相當多,有遺傳因素、生活習慣、抽菸和喝 酒等. 15-40. 。近年來由於工業發展,環境許多危害物質的暴露和精液品質的. 不良有相關. 17-22, 29-31. 。在這些環境危害物質中,存在著具模仿雌性激素結. 構的化學物質,可能為導致精液品質下降的原因之一. 17-22. ,如油漆、清潔. 劑、乳化劑、除草劑和殺蟲劑。這類容易模仿、加強、干擾、拮抗生物 體內賀爾蒙活動的化學物質,通稱為「外因性內分泌干擾化學物質」 41. (environmental endorcine disrupting chemicals) ,世界衛生組織所 下的定義為「一種外部性物質或化學混合物,可以改變內分泌系統作用, 結果對正常生物體或其後代,或其族群之健康造成負面的影響」。在日 本,內分泌干擾物質又稱為環境賀爾蒙。因為這類化學物質容易具生物 42. 濃縮及生物蓄積性,對人體健康的危害更不能忽視 。 環境賀爾蒙涵蓋的範圍相當廣,如殺蟲劑類、重金屬類、合成激素 42. 和烷基酚類等 ,又如壬基苯酚 (nonylphenol) ,為生活上及工業上大 量使用的非離子型介面活性劑,由於具備雙性構造,ㄧ端為極性親水端, 43. ㄧ端為非極性疏水端,故大多為清潔劑及乳化劑的原料 。環境中的壬基 苯 酚 , 主 要 是 透 過 壬 基 苯 酚 聚 乙 氧 基 醇 類 化 合 物 (nonylphenol 1.
(14) polyethoxylate, NPnEOs) 之代謝產物經由微生物的好氧與厭氧分解所 形成. 44-47. 。由於缺乏聚乙氧基醇的親水基端,壬基苯酚的水溶性極低(Kow. = 4.5). 48-49. ,因此被排放到環境中不易被微生物分解,又由於其結構類似 50. 雌性激素,具有弱的雌激素作用,已被認為環境賀爾蒙的一種 。 台灣每年生產及使用壬基苯酚類非離子型介面活性劑高達 48,000 45. 噸,且約有 35%會被排放至水體 ;臺灣 40 條河川中 NP 之檢出率約 54.2%, 平均濃度 4.9 μg/L,6 條河川底泥中含 NP 之檢出率 74%,平均濃度 2.6 45. mg/kg-dry wt (0.2-8.6 mg/kg) 。另一調查台灣五條主要河川 NP 濃度 約為 0.5-2.4μg/L,皆顯示台灣河川壬基苯酚濃度高於歐美其他地區許 46. 多 ;美國 30 條河川底泥平均壬基苯酚濃度大約為 0.003-3.0 mg/kg; 德國大約為 0.7 mg/kg。 48. 壬基苯酚已被證實具生物濃縮及生物累積性 ,台灣廢水僅少數經過 44. 處理,大部分皆直接排放至河川中 ,許多動物試驗皆證實壬基苯酚對生 殖的危害. 53-66. ,其中對雄性動物精液品質的降低有顯著的影響. 55, 61-62. ,民. 眾透過食物鏈暴露於壬基苯酚的機會相當大,壬基苯酚在人體的暴露程 度是否也會與男性精液品質降低有相關值得進ㄧ步去探討。 另外一些研究指出 DNA 氧化損害能力指標 8-OHdG,和男性的精液品 質也有相關,隨著損害能力增加,精液品質呈現下降趨勢. 67-70. ,是否與環. 境賀爾蒙壬基苯酚存在著相關性亦值得進ㄧ步探討。. 第二節. 研究的重要性 壬基苯酚親脂性的特性,容易於水中生物體內累積,之後透過食物 鏈的作用,可能最後於人體內累積,造成影響。在許多壬基苯酚的動物 試驗中,均已證實這類環境賀爾蒙的危害。故本研究著重於評估壬基苯 酚對人體的影響,尤其在男性生殖方面。. 2.
(15) 第三節. 研究目的 1. 依全民健保資料分析台灣男性女性目前不孕症盛行情況。 2. 探討影響男性尿液壬基苯酚內在暴露量的因子。 3. 探討影響男性精子數量、活動度,甚至不孕症的因子。 4. 分析壬基苯酚的內在暴露量是否與男性精子數量、活動度、型態正常 比有相關性存在。 5. 探討壬基苯酚暴露量與 DNA 氧化性傷害指標 8-OHdG 之間的相關性。. 第四節 研究問題與研究假設 環境賀爾蒙壬基苯酚具有弱的雌激素作用,在許多的動物試驗中發 現,可能對生殖系統造成危害,如限制睪丸的生長、雄性動物雌性化、 精子數量下降等等. 53-66. 。壬基苯酚自清潔劑大量使用,人體暴露廣泛,是. 否會影響男性生育健康是可探討的議題。由於男性精液品質逐年的下 降,是否和壬基苯酚暴露量有關為本研究的主題。 本研究雖以探討男性不孕症和壬基苯酚暴露的相關為主題,也同時利用 全民健康保險資料分析國人不孕症的現況。. 3.
(16) 第二章 文獻探討 第一節. 壬基苯酚特性 0. 壬基苯酚為淺黃色黏稠性液體,沸點 283-302 C,比重 0.95,在水中 0. 溶解度為 4.9±0.4 mg/L (25 C),大約為(2.22±0.18)*10. -5. 51. mol/L 。. 壬基苯酚主要藉由烷化作用,以酸催化酚和壬稀。在工業上的用途,因 為具備雙性(amphiphilic)構造,一端為極性親水端,一為非極性疏水 端,多為清潔劑與乳化劑等產品之原料。在壬基苯酚聚乙氧基醇類中親 水端,由聚乙氧基醇(ethoxylate, EO)聚合物所構成,疏水端則由壬基 苯酚(NPs)構成,故以壬基苯酚聚乙氧基醇類化合物存在(nonylphenol 46-47. polyethoxylates,NPEOs). C9H19. 。其化學結構式如下:. O. CH2CH2O. n. CH2CH2OH. n=0-18 環境中的壬基苯酚主要是透過壬基苯酚聚乙氧基醇類化合物之代謝 產物經由微生物的好氧與厭氧分解所形成。在分解的過程中,壬基苯酚 聚乙氧基醇類化合物的聚乙氧基醇,因分解而逐漸縮短,最後形成不具 乙基醇基的壬基苯酚. 44-47. ,由於化學結構類似動物雌性激素,會干擾內分. 泌機制進而造成內分泌失調影響生殖系統功能,已被認為是一種環境賀 爾蒙。. 第二節. 壬基苯酚之生物濃縮性 Servos 於瑞士 Glatt 河及其支流 Chiesbach 採集藻類、水生植物、 魚類及水鴨樣本,並測定其體內壬基苯酚濃度,結果顯示水中壬基苯酚 平均濃度為 3.9 μg/L,藻類濃度為 2.5-4.2 mg/kg dry wt,魚肉濃度 4.
(17) 48. 為 0.15-0.38 mg/kg dry wt,水鴨肌肉濃度為 1.2 mg/kg dry wt ;Snyder 等人的研究顯示壬基苯酚在 Pimephales promelas 於體內的生物濃縮係 數(bioconcentration factors,BCFs)為 245-380,魚肉的平均濃度達 49. 0.184 μg/g wet wt 。人體壬基苯酚的暴露主要經由飲食攝取,透過生 物累積性作用,可能使人類暴露於此高劑量的環境危害物質. 48-49. 。. 第三節. 壬基苯酚生殖危害 壬基苯酚生殖危害的研究,以動物試驗為主,主要發現包括雄性動 物生殖能力降低、生殖器官退化及雄性動物雌性化等。 63. Kinnberg 等人(2000) 以胎生魚評估壬基苯酚劑量效應關係對睪丸 組織的影響,發現在餵食 28 天壬基苯酚,生殖體細胞指標隨著濃度有下 降的趨勢。在組織學的檢驗也顯示壬基苯酚對睪丸組織有明顯的影響, 尤其當壬基苯酚濃度越高時越顯著。 64. Bechmann (1999) 以橈腳類動物評估生育能力、生命力、生長速率, 暴露在高濃度壬基苯酚橈腳類動物親代 (125 及 500 ug/L),其子代容 易致死,若暴露在濃度 62 ug/L,只有 6%的子代可以存活至成熟期。在 暴露於濃度 31 ug/L 的壬基苯酚,子代與親代性別比沒有顯著的改變。 65. Hossain 等人 (2001) 對暴露在壬基苯酚的老鼠評估其生殖毒性, 分別在懷孕 11~18 天的老鼠餵食不同劑量的壬基苯酚,3, 15, 75 mg/kg/day,子代副睪的重量顯著的降低,且呈現劑量效應關係。 54. Jobling 等人 (1996) 的研究顯示暴露於壬基苯酚的公鱒魚會刺激 66. 肝細胞合成卵黃前質並限制睪丸生長;Lifen Ren 等人 (1996) ,探討 壬基苯酚對卵黃前質基因表現的影響,發現餵食壬基苯酚的魚,卵黃前 質 mRNA 會被合成,前驅 mRNA 會開始消失,推測壬基苯酚可能參與後轉 錄(post-transcriptional)的過程。. 5.
(18) 53. Forget-Leray 等人 (2005) 以 copepods E urytemora affinis 橈 足類浮游為研究對象,探討橈足類浮游連續 30 天同時暴露於 17β-雌二 醇(17β-estradiol,E2)和壬基苯酚的影響,結果顯示子代的雌雄性 別比值為 1.42±0.2,明顯高於親代的 1.00±0.3,也比單純暴露於 E2 造 成子代的雌雄性別比值(1.25±0.1)高,顯示出 17β-雌二醇和壬基苯酚 對橈足類浮游子代的雌雄性別影響有加成效應。 56. Hill 等人 (2003) 於美國進行壬基苯酚暴露影響斑馬魚的研究,將 160 隻剛孵化的小魚分別養殖於 1、10、100 ng/L 的壬基苯酚的水溶液中, 結果顯示高暴露族群的體長和體重隨暴露劑量升高而明顯變短、變輕, 但是性別比則無統計上顯著差異。 61-62. Jager 等人(1999). 在南非的研究,分別餵食 Sprague-Dawley 大. 白鼠 100、250 和 400mg/kg/day 壬基苯酚,連續餵食 52 天後,大白鼠的 6. 6. 6. 精子數量分別為 43.79×10 、30.52×10 和 10.20×10 ,均比沒餵食的對照 6. 組(48.80×10 )低,且呈現明顯的劑量效應相關; 55. Han 等人(2004) 在中國大陸的研究也發現類似的結果,分別餵食 年齡 28~30 天的 Sprague-Dawley 大白鼠含 125 和 250mg/kg/day 壬基苯 6. 酚的玉米油,連續餵食 50 天後,大白鼠的精子數量分別為 4.394×10 和 6. 3.038×10 ,每天餵食 250mg/kg 壬基苯酚的大白鼠之精液數量明顯低於沒 6. 餵食的對照組(4.162×10 )。. 第四節. 精液品質下降趨勢調查 精液品質的下降似乎為全球一個重要的議題,許多研究均已證實男 性精液品質皆逐年在降低,尤其以精子數目的減少甚為嚴重。丹麥科學 12. 家 Carlsen 等人 (1992) 發表回顧了世界 20 多個國家的 61 份文獻後, 發現世界男子的精子數目自 1940 年至 1990 年下降了 50%。. 6.
(19) 蘇格蘭於 1989 年至 2002 年針對男性精蟲數目所做的一項研究,發現精 蟲數目從每毫升八千七百萬隻下降至每毫升六仟兩百萬隻,十四年精子 數目減少將近 30%。Auger (1995). 8. 等人於法國針對生育力正常的男性,. 自 1973 年到 1992 年,評估精液品質,精子數目平均每年下降 2.1%,從 每毫升八千九百萬隻下降至每毫升六千萬隻,且精子活動度及精子正常 形態比例平均每年降低 0.6%及 0.5%。 精液品質下降的因素很多,包括環境物理化學因子的暴露,物理很 化學因子也很多,是否和環境賀爾蒙類的物質暴露有關,有待更多的探 討。. 第五節. 影響精液品質因素 ㄧ、年齡 25. Sharon 等人 (2001) 回顧過去二十年(1980-1999)有關男性年齡與 精液品質的相關性,包括精液量、精子數目、精子活動力及精子正常形 態比例,在三十歲到五十歲的男性中,精液品質隨著年齡的增加而有下 降的趨勢,精液體積減少大約 3%-22%,精子活動力與正常形態比例也 分別降低 3%-37%及 4%-18%,但在精子數目並沒有發現異常。 二、體質量指數 (Body mass index) Jensen 等人 (2004). 26. 針對 1558 名平均年齡為 19 歲的丹麥年輕男 2. 性體質量指數(BMI)與精液品質的調查中,在 BMI 小於 20 kg/m 或大於 2. 20 kg/m 的男性,精子數目比起 BMI 正常的男性分別約降低 36.4%及 23.9 %。 三、壓力 Pook 等人(2004). 28. 針對有生育問題的夫婦評估壓力與男性精液品. 質的研究,以量表評估生育壓力的大小,發現生育壓力大的男性中,其. 7.
(20) 精子數目平均較沒有壓力的男性少了兩千萬,追蹤六個月後,兩組的精 子數目差異更達三千多萬,且壓力大的男性平均精子數目較一開始少了 一千五百萬。 四、環境危害物質 許多研究報告均指出環境的危害物質與男性精液品質的下降有相關 性存在。Oliva 等人 (2001). 29. 評估環境危害物質與精液品質的關係,職. 場工作較常暴露於殺蟲劑、有機溶劑及鉛等的男性,其精液品質不正常 的危險性比遠遠超出正常男性,另外也針對職場是否暴露於熱危害與精 液品質的關係探討,但並沒有發現顯著的關係。 五、8-OHdG 8-Hydroxydeoxyguanosine (8-OHdG) 為測量DNA氧化損害能力的一 個指標,最早發現8-OHdG與精液品質有相關的為1994年Fraga所做的研究 67. 。之後 Kodama 等人 (1997). 68. 發現不孕男性病患比起正常男性,其 5. 8-OHdG 值較高 (1.5 ± 0.2 vs. 1.0 ± 0.1 /10 dG);Ni 等人 (1997). 34. 的研究也有類似的結果,且發現 8-OHdG上升與精子數目、精子活動度和 精子正常形態比例有負相關。 六、其他 其他影響精液品質的因素還有許多,根據醫學報導,穿緊身褲或常 洗熱水澡的男性,由於生殖器官周圍溫度的升高,會導致精子的死亡; 男性生殖器官受損也會影響睪丸造精的品質,抽菸、喝酒等生活習慣, 也會連帶影響男性賀爾蒙作用,間接使睪丸造精功能下降. 23-24, 37. ;. 35. 遺傳的因素也可能導致男性精液品質的不正常 。 壬基苯酚對精液品質的影響尚在評估當中,2005年進行壬基苯酚與 男性不孕症的研究,僅發現男性精子數目不正常較正常者,其壬基苯酚 在尿液中有較高的濃度,但由於樣本數過少,仍需進ㄧ步探討。. 8.
(21) 第六節. 台灣壬基苯酚的流布 台灣每年的壬基苯酚製造量大約為 3 萬公噸,約有 30-40 %供國內 工業使用,大部分用為界面活性劑、塑膠抗氧化劑等基本原料。由於台 灣的污水僅 5 %經過處理後排放,故壬基苯酚對於台灣河川水造成相當 46. 程度的汙染 。在 2000 年由環境檢驗所檢測國內 40 條河川水質及 6 條河 川底泥之環境殘留,結果顯示台灣河川河水壬基苯酚平均檢出率為 54.2 %,陽性樣品平均濃度 4.87μg/L (0.89-50.0μg/L);以南部河川較為 嚴重,其檢出率 77.4%,陽性樣品平均濃度 7.54 mg/L(1.08-50.0μ g/L)。底泥平均檢出率為 74%,陽性樣品平均濃度 2,625 mg/kg dry wt 45. (250-8,580 g/kg dry wt);北部河川比南部嚴重 。 46. 丁望賢教授等人 也針對台灣北、中、南、東部總共 19 條河川分析 壬基苯酚濃度,偵測濃度最高達 5.1μg/L, 河川壬基苯酚檢出率中,有 99 %水樣超出目前歐盟對壬基苯酚風險評估預定提出的「預估無影響濃 度」,即 3.3μg/L,對環境生態以及人類健康的衝擊已不能漠視。 由於壬基苯酚具有雌性化的作用,國人的暴露量又較大,是否影響 國人的生育健康值得探討。本研究擬探討壬基苯酚暴露和男性的生育健 康相關,觀察和精子品質的關係。. 9.
(22) 第三章 研究方法 第一節. 健保歸人檔不孕症分析 國家衛生研究院於西元 2000 年隨機抽取 20 萬全民健康保險投保 人,回顧 1996 年至 1999 年門診就醫記錄、住院就醫記錄,也包括就醫、 用藥所需的花費,並持續追蹤至 2003 年。利用此資料庫,探討台灣不孕 症描述性流行病學,包括不孕症男性女性每年個別盛行率。此外,以年 齡別、地區別、人口密度個別分層計算其盛行率,利用邏輯斯回歸進ㄧ 步探討社會人口學變項是否影響不孕症的發生。最後,評估不孕症婦女 經治療懷孕的情況。. 10.
(23) 研究架構 不孕症健保資料庫分析. 健保資料庫. 不孕症. 男性不孕症. 女性不孕症. 病因別 年齡別 地區別 都市化程度. 病因別 年齡別 地區別 都市化程度. 受孕情況 自然分娩 剖腹產 不正常受孕. 11.
(24) 第二節. 壬基苯酚和男性不孕症 ㄧ、研究設計 橫斷性的研究,以分子流行病學的方法探討壬基苯酚暴露和男性精 液品質的相關特性。. 二、研究對象 以中部某婦產科不孕症門診夫婦為主,以不孕症的原因及精液品質 的檢查區分精液品質正常男性及異常男性。. 三、研究工具的擬定 在不孕症門診,詢問夫婦願意配合此研究的意願,在獲得同意的情 況下,進行 10 分鐘的問卷訪視,包括人口學資料、生活習慣、抽菸、喝 酒、嚼檳榔、熬夜習慣、飲食習慣資訊的取得,且夫婦能協助配合此研 究尿液檢體的取得,約 15cc;病歷資料訊息的取得,如男性精液品質檢 查的結果,也獲得醫師及受訪不孕症夫婦的同意許可。本研究獲得中國 醫藥大學人體試驗委員會(IRB) 許可。. 12.
(25) 四、實驗室樣本處理分析 (一) 肌酸酐分析 實驗材料與方法 試藥 1. 肌酸肝 (creatinine, standard solution 10mg/ml, USA) 2. 苦味酸 ( picric acid 0.5%, saturated, Sigma-Aldrich, USA ) 3. 磷酸二氫鉀 ( potassium dihydrogen phosphate, JT-BAKER, Phillipsburg, NJ, USA ) 4. 硫酸 ( sulfuric acid,98%, Merck, Germany) 5. 氫氧化鈉 ( sodium hydroxide, Merck, Germany ) 器材 1. 分光光度計 (spectrophotometer, UV-160A, Shimadzu, Tokyo, Japan) 2. 震盪槽 ( shaker bath, Firstek Scientific B603 ) 試藥配置 0.75N 氫氧化鈉溶液 取 100 ml 燒杯,先加入 70 ml 去離子水,再加入氫氧化鈉 3 g,攪拌均 勻後,定量至 100 ml。 去蛋白試劑 取 100 ml 燒杯,加入 67 ml 去離子水,再加入 0.633g 磷鎢酸鈉及 0.48 ml 硫酸,攪拌均勻後,定量至 100 ml。 肌酸酐標準溶液 (10 mg/dl) 電子天秤秤重肌酸酐 0.1g,定量至 100 ml,之後再 10 倍稀釋至濃度 10mg/dl。 分析. 13.
(26) 肌酸酐檢量線配置 分別取 10 mg/dl 肌酸酐標準溶液 0、0.5、1.0、1.5、2.0 ml,各加入 去離子水 2.0、1.5、1.0、0.5、0 ml 混合均勻,檢量線濃度範圍為 0、 2.5、5、7.5、10 mg/dl。各取出 0.5 ml,加入 3 ml 去蛋白試劑,靜置 十分鐘。取上清液 2 ml,加入 1 ml 苦味酸及 0.75 N 氫氧化鈉 1 ml, 0. 於 25 C 的水浴槽靜置 20 分鐘後取出。 尿液前處理 250 μL 尿液,以去離子水稀釋至 10 ml,取出 0.5 ml 稀釋尿液,加入 3 ml 去蛋白試劑,靜置十分鐘。取上清液 2 ml,加入 1 ml 苦味酸及 0. 0.75 N 氫氧化鈉 1 ml,於 25 C 的水浴槽靜置 20 分鐘後取出。呈色樣 本以分光光度計測定,波長為 520nm。. 14.
(27) (二) 壬基苯酚分析 實驗材料與方法 試藥 1 醋酸 (acetic acid, Fluka, USA) 2 醋酸胺 (ammonium acetate, Sigma-Aldrich, USA) 3 氫化甲烷 (acetonitrile, Tedia) 4 鹽酸 (hydrochloric acid 37%, Sigma-Aldrich, USA) 5 甲醇 (methanol, Mallinckrodt-Paris Kentucky, USA) 6 β-glucuronidase/arylsulfatase (5.2 U/ml / 2.1U/ml, Merck, Germany) 7 壬基苯酚 (4-nonylphenol, NP, 85% p-isomers, Fluka, USA) 器材 1. 離心機 ( centrifuge, Hitachi O5P-21, Tokyo, Japan) 2. 超音波震盪槽 ( electronic, Branson 8200, USA ) 3. 微量電子天秤 ( micro-scale, ER-182A, Tokyo, Japan ) 4. 酸鹼測定計 ( pH meter 320, Corning, UK ) 5. 震盪槽 ( shaker bath, Firstek Scientific B603 ) 6. 固相萃取管 ( Varian 500mg/3ml Bond Elut-PH, Palo Alto, USA ) 儀器 1. 樣本自動注入裝置 (autosampler, SIL10A, Shimadu, Japan) 2. 分離管住 (Supelco 5μm C18 150×4.6mm) 3. 保護管住 (Guard column) 4. 螢光偵測器 (fluorescence detector, RF-10Axl, Shimadzu, Japan) 5. 幫浦 (intelligent pump, LC-6A, Shimadzu, Japan) 6. 訊號聯結器 (interface). 15.
(28) 7. 層析軟體 (訊華 SIS-LAB 層析積分處理系統 98 版) 試藥配置 高濃度壬基苯酚標準品配置 取一 50 ml 定量瓶,秤壬基苯酚 0.0213 g,以甲醇定量至 50 ml,濃度 為 362.1 mg/L。 添加標準品配置 取 2 ml 濃度為 362.1 mg/L 的壬基苯酚標準品於 40 ml vial 瓶中,加入 18 ml 甲醇搖晃均勻,其濃度則為 36.21 mg/L 儲備標準溶液,再以同樣 的方法進行稀釋,則可得濃度為 36.21 mg/L 儲備標準液,配置完成後, 置於 4 ℃冰箱儲存備用。 1N 氯化氫溶液 先取少量 DI 水到 100 ml 定量瓶,加入 8.3 ml 之 12 N HCL,混合均勻後, 定量至 100 ml。 1N 醋酸溶液 取 5.6 ml 之 18 N 醋酸溶液到 100 ml 定量瓶,加 DI 水,定量至 100 ml。 1M 醋酸胺緩衝液 以微量電子天秤秤重醋酸胺 7.7 g,使溶於 80 ml DI 水,以 18 N 的醋酸 溶液,調整 pH = 5.3,之後加入 DI 水定量至 100 ml 分析 尿液樣本於分析前需經前處理及淨化處理,再利用高效能液相層析儀 (high performance liquid chromatography)進行層析,並串連螢光 偵測器定量壬基苯酚濃度。分析步驟如下: 1. 取 10 mL 尿液樣本置於 20 mL 玻璃瓶中,以醋酸調至 PH = 5.5。 2. 加入 1mL 1M 醋酸銨緩衝液(PH = 5.3)及 125μL β -glucuronidase/arylsulfatase(0.65 U/0.26 U)後均勻混合。. 16.
(29) 3. 將尿液樣本置於 37 ℃水浴槽中震盪 15 小時後。 4. 以 37 %氯化氫將尿液樣本酸化至 PH=3 後備用。 5. 加入 10 mL 甲醇於 Varian PH 固相萃取管清洗管柱,再加入 3. mL. 事先經 1M 氯化氫酸化至 PH = 3 的去離子水調理。 6. 將步驟 4 的樣本加入 Varian PH 固相萃取管中。 7. 以 5 mL 去離子水清洗固相萃取管後,加入 3 mL 甲醇沖提待測物 (壬基苯酚)。 8. 將收集之甲醇置於 1.8 vial 瓶中上機。 9. 以系列稀釋配製檢量線所需之一系列標準品濃度 5.84、17.53、 52.59、157.78、473.33g/L 後,分別置於 1.8 vial 瓶中上機。 10. 將前處理完的尿液樣本和一系列標準品注入附有螢光偵測器的 HPLC 分析。自動注入裝置設定注射 20μL 樣本,進入 Supelco 5 μm C18 150×4.6 mm 管柱中進行分離,移動相為氰化甲烷和去離 子水,比例為 70:30,流速為 1.0 mL/min。 11. 利用螢光偵測器測定樣本中壬基苯酚:設定激發波長 280 nm,發 射波長 305 nm。 12. 將一系列標準品分析結果和濃度作圖建立檢量線後,將尿液樣本 分析結果代入線性回歸方程式,可回推尿液樣本中壬基苯酚濃度。 所有尿液樣本分析後所得之壬基苯酚濃度均需經尿中肌酸酐校正後呈 現。. 17.
(30) (三) 精液分析 1. 將精液以手淫方式取出裝於無菌塑膠容器中。 2. 紀錄精液收集的時間、送達實驗室的時間、檢查的時間及禁慾的天數。 3. 將精液置於 37 ℃ CO2 incubator 或 water bath 中,10 分鐘讓其液 化。 4. 肉眼觀察其外觀,注意任何異常特性。正常精液為黏稠的、不透明的 白色或灰白色,有ㄧ股特殊的刺鼻味道。 5. 完全液化後將檢體移至 15 ml 刻度試管中,測量精液的量,並檢視檢 體是否液化完全。 6. 將精液混合均勻後開始檢查 精蟲計數 精蟲計數(Sperm count) ㄧ般常用血球計數盤計算,方法如下: 將混合均勻之精液以水做 5X,10X,20X,50X,100X 之其中兩種倍數稀 釋,滴加約 8μl 於計數盤中,靜置約 5 分鐘讓其沉澱下來,再加以計數。 兩種不同稀釋倍數的誤差,在低精蟲濃度時不可超過 10 %,在高精蟲濃 度(每 cc 大於六千萬以上)時不可超過 20 %。如果精蟲濃度超過每 cc ㄧ 億五千萬時,必須做較高倍數稀釋。計數時採計算紅血球的 5R 區或白血 球的 2W 區。 精蟲濃度換算:( million/ml ) n = a * 5 *b * 10000 a = 五小格內所有精蟲之總和 b = 精液稀釋倍數 10000 = 1 ml (精液量) 與 0.1μl (ㄧ大格之容積量)之比。 1 ml = 1000μl 5 = 換算成每ㄧ大格的精蟲量 (25 小格:5 小格). 18.
(31) 活動性: 取一滴精液置於玻片上蓋上蓋玻片,以 400 倍顯微鏡觀察,計算 100 隻 精蟲不論死活,算出活動精蟲的比率。只要有活動的精蟲就算具有活動 性 (Mobility)。 精蟲型態: 將精液混合均勻,取一滴於乾淨玻片上,將之推成薄片,空氣乾燥後直 接染色,利用染色的薄片以區別正常與不正常精蟲型態(Morphology)。 染色方法以 Papanicolaou stain、Liu’s stain、Giemsa stain、 Diff-Quick stain 等皆可。如果精蟲濃度低於每 cc ㄧ千萬時,必須將 精液以 2000 rpm 離心 15-20 分鐘,在取沉澱物作成 smear。 精液分析的部分由婦產科實驗室協助分析。. WHO 定義正常精液品質: 6. 1. 精蟲數目>20×10 1/ml 2. 精子活動度>50 % 3. 正常精蟲型態比例>20 %. 19.
(32) (四) 尿液中 8-OHdG 分析 74. 本研究參考 Yin 等發表之酵素連結免疫吸附分析法(enzyme-linked TM. immunosorbent assay,ELISA),使用美國 OXIS research 公司生產的 測量 8-OHdG 之 commercial ELISA kit,其原理是利用競爭型 ELISA 來偵 測 8-OHdG。其分析步驟如下: (1)分別加入 50 μl 尿液樣本或 8-OHdG 標準品於 commercial ELISA kit 上的不同 well,無使用之 well 加入 50 μl 二次去離子水以保持相 同溫度。 (2)於所有 well 加入 50 μl primary Ab (monoclonal Ab specific for 8-OHdG),置於 37 ℃培養 1 小時。 (3)以 250 μl PBS 清洗 3 次。 (4) 加入 100 μl secondary Ab (HRP (horseradish peroxidase)-conjugated Ab),置於 37 ℃培養 1 小時。 (5)以 250 μl PBS 清洗 3 次。 (6)加入 100 μl 呈色劑(3,3’,5,5’-tetramethylbenzidine),避光, 置於室溫下 15 分鐘。 (7)此時會出現淡藍色,加入 100 μl 中止劑(1M phosphoric acid)後 變為黃色,反應 3 分鐘。 (8)測 450 nm 吸光率(absorbance),5 分鐘內判讀完畢。 (9)取 8-OHdG 標準品 0.5、2、8、20、80、200 ng/ml 濃度之 log 值與 吸光率作圖,再以樣本之吸光率換算出濃度。 (10)所有 8-OHdG 濃度均以樣本本身之肌酸酐濃度校正後呈現(µg/g creatinine)。. 20.
(33) (五) 資料統計與分析 可能影響此研究相關變項皆納入探討,人口學資料包括年齡、BMI、 工作壓力、生活壓力、工作場合是否接觸有害物質;生活習慣包括是否 長期服用保健營養品或藥物,每週穿緊身褲的頻率、浸泡熱水澡的頻率、 劇烈運動的習慣;飲食習慣著重於牛肉、豬肉、雞鴨鵝肉、羊肉、全脂 奶、脫脂奶、魚肉、海鮮類食物,內臟類食物、蛋、水果、咖啡、茶、 生菜沙拉每月或每週攝取的頻率。資料建檔以 Microsoft Office XP Excel 2003 為主。統計分析軟體使用 SAS 8.2 版。 統計分析使用無母數分析方法,先探討各變項頻率的分布是否造成 男性壬基苯酚內在暴露量及 8-OHdG 的差異性,或者對精液品質有影響, 兩個變項比較使用 Wilcoxon rank sum test,三個變項或以上使用 Kruskal-wallis test;以皮爾森相關係數(pearson correlation)探討 男性壬基苯酚內在暴露量與年齡別、BMI、8-OHdG、精子數目、精子活動 力、精子正常形態比例之間的相關性;依據精液品質正常與否,分別將 精子數目、精子活動力、精子正常形態比例區分為正常者與不正常者, 比較男性壬基苯酚內在暴露量及 8-OHdG 的差異;最後將壬基苯酚依內在 暴露量分層,以邏輯式回歸探討精液品質與壬基苯酚內在暴露量危險 比,且觀察是否有劑量效應關係。. 21.
(34) 資料分析架構 壬基苯酚、8-OHdG 與男性精液品質相關性探討. 人口基本資料和生活型態 性別、年齡、身體質量指數、教 育程度、工作內容、抽菸、喝酒、 工作環境、生活習慣、穿著習 慣、用藥習慣、工作壓力和家庭 負擔等. 男性精液品質 精子數量 精子活動度 精子正常形態比例. 壬基苯酚內在暴露量及 8-OHdG氧化損害能力 尿液中壬基苯酚濃度、8-OHdG. 22.
(35) 第四章. 結果. 第一節. 國人不孕症盛行率調查 依據健保資料庫,不孕症盛行率自 1996 年到 2000 年有增加的趨勢, 從每十萬人 344 人增加到 2000 年的每十萬人 380 人,盛行率達到最高 (Table 1, Figure 1)。不孕症新增率則以 1997 年每十萬人新增 252 名 不孕症患者為最高。男性不孕症盛行率及新增率在 1999 年皆為最高,分 別為每十萬人 112 人及每十萬人新增 93 人 (Table 2, Figure 2)。女性 不孕症盛行率在 2000 年為最高,每十萬人有 681 人,新增率最高為在 1997 年,每十萬人新增 448 人(Table 3, Figure 3)。八年期間,不孕症人數 總共有 5507 人次,男性佔 732 人次,女性則有 4775 人次。在這八年當 中總共有 3683 人(男 606 人,女 3077 人) 因不孕症有就診記錄,其中有 1819 人次是重複就診的。. 23.
(36) Table 1 Prevalence of infertility and new-cases reported in National Health Insurance cohort in Taiwan from 1996 to 2003 Year. Population. Prevalence. New cases. No.. Rate*. No.. Rate*. Existing cases. 1996. 189999. 652. 344. 1997. 192724. 675. 351. 483. 252. 1998. 195050. 660. 339. 443. 228. 1999. 197486. 741. 375. 479. 244. 2000. 200000. 760. 380. 484. 243. 2001. 199978. 674. 337. 386. 194. 2002. 198989. 700. 352. 412. 208. 2003. 193966. 640. 330. 344. 178. 3683. 1996-2003. 3031. * Rate in per 105. Prevalence of infertility. per 105 390 380 370 360 350 340 330 320 310 300 1996. 1997. 1998. 1999. 2000. 2001. 2002. 2003. Year. Figure 1: Annual infertility rate (per 100000) identified from claim files reported in the National Health Insurance cohort in Taiwan from 1996 to 2003. 24.
(37) Table 2 Prevalence of infertility and new-cases reported in National Health Insurance cohort among males in Taiwan from 1996 to 2003 Year. Population. Existing. Prevalence. New cases. No.. Rate*. No.. Rate*. cases. 1996. 97236. 85. 88. 1997. 98721. 79. 80. 67. 68. 1998. 99916. 73. 73. 59. 59. 1999. 101197. 114. 112. 94. 93. 2000. 102521. 96. 94. 80. 78. 2001. 102517. 104. 101. 85. 83. 2002. 102054. 92. 90. 68. 67. 2003. 98400. 88. 89. 67. 68. 605. 1996-2003. 520. * Rate in per 105. per 105 Figure 2. Prevalence of infertility in males. 120 100 80 60 40 20 0 1996. 1997. 1998. 1999. 2000. 2001. 2002. 2003. Year. Figure 2: Annual infertility rate (per 100000) in males identified from claim files reported in the National Health Insurance cohort in Taiwan from 1996 to 2003. 25.
(38) Table 3 Prevalence of infertility and new-cases reported in National Health Insurance cohort among females in Taiwan from 1996 to 2003 Year. Population. Existing. Prevalence. New cases. No.. Rate*. No.. Rate*. cases. 1996. 92746. 567. 612. 1997. 93986. 598. 636. 416. 448. 1998. 95117. 588. 618. 384. 406. 1999. 96272. 627. 651. 385. 404. 2000. 97462. 664. 681. 404. 418. 2001. 97461. 570. 585. 301. 311. 2002. 96925. 608. 627. 344. 358. 2003. 95487. 552. 578. 277. 291. 3078. 1996-2003. 2511. Rate in per 105. Prevalence of infertility in females. per 105 700 650 600 550 500 1996. 1997. 1998. 1999. 2000. 2001. 2002. 2003. Year. Figure 3: Annual infertility rate (per 100000) in males identified from claim files reported in the National Health Insurance cohort in Taiwan from 1996 to 2003. 26.
(39) 從 1996 年到 2003 年所有被診斷為不孕症男性和女性的人中(每病例 ㄧ次計算),依據病因別區分,男性可分為無精子、精子稀少、睪丸組織 異常、非特異性原的不孕;在女性可分為無卵性月經、子宮或輸卵管組 織異常、其他特異原、其他非特異原。男性以非特異性原引起的不孕所 佔的比例最高,約 88%,共有 532 人;女性也是以非特異性原引起的不 孕站的比例最高,約 77%,共有 2378 人,排卵週期不規則佔 18%,566 人。(Table 4). Table 4 Classification of etiological factor in infertility identified from claim files reported in the National Health Insurance cohort in Taiwan by sex, 1996-2003 Classification. Male. Female. Total. 605 (16.4%). 3078 (83.6%). Azoospermia. 35 (5.8%). Oligospermia. 26 (4.3%). Extratesticular. 12 (1.9%). causes Unspecified. 532 (88.0%). origin Anovulation. 566 (18.4%). Tubal origin. 80 (2.6%). Other specified. 54 (1.8%). origin 2378(77.2%). Unspecified origin. 27.
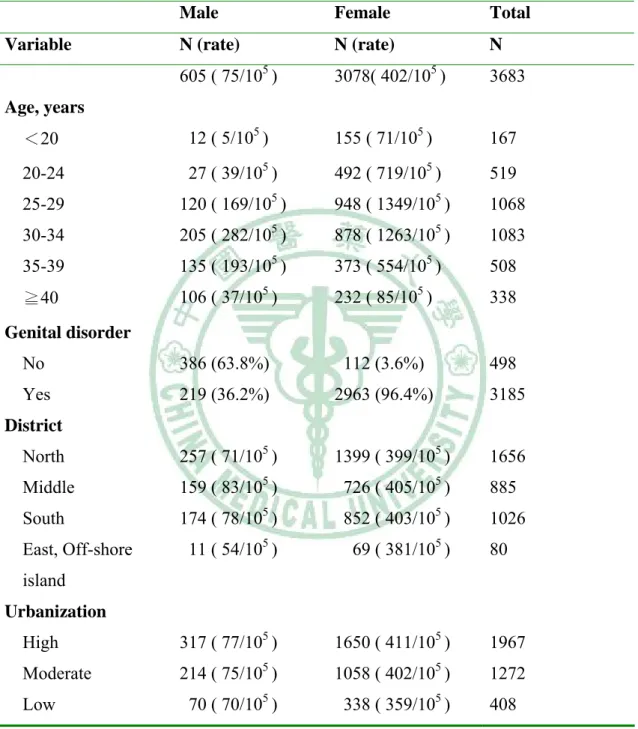
(40) 依照年齡別劃分,男性的不孕症就診紀錄主要集中在 30-34 歲,共 有 205 人,女性則以 25-29 歲不孕症人數為最多,共 948 人。若以地區 別劃分,男性女性不孕症皆以中部有較高的盛行率,分別為每十萬人 83 及 405 人。以都市化程度劃分,男性女性不孕症也都集中在都市化程度 為最高者,分別為每十萬人 77 及 411 人。(Table 5). 28.
(41) Table 5 Distribution of infertile cases identified from claim files reported in the National Health Insurance cohort in Taiwan by age, district, urbanization and sex from 1996 through 2003. Variable. Male. Female. Total. N (rate). N (rate). N. 605 ( 75/105 ). 3078( 402/105 ). 3683. Age, years <20. 12 ( 5/105 ). 155 ( 71/105 ). 167. 20-24. 27 ( 39/105 ). 492 ( 719/105 ). 519. 25-29. 120 ( 169/105 ). 948 ( 1349/105 ). 1068. 5. 5. 30-34. 205 ( 282/10 ). 878 ( 1263/10 ). 1083. 35-39. 135 ( 193/105 ). 373 ( 554/105 ). 508. ≧40. 106 ( 37/105 ). 232 ( 85/105 ). 338. No. 386 (63.8%). 112 (3.6%). 498. Yes. 219 (36.2%). 2963 (96.4%). 3185. 257 ( 71/105 ). 1399 ( 399/105 ). Genital disorder. District North. 5. 5. 1656. Middle. 159 ( 83/10 ). 726 ( 405/10 ). 885. South. 174 ( 78/105 ). 852 ( 403/105 ). 1026. 11 ( 54/105 ). 69 ( 381/105 ). High. 317 ( 77/105 ). 1650 ( 411/105 ). 1967. Moderate. 214 ( 75/105 ). 1058 ( 402/105 ). 1272. 70 ( 70/105 ). 338 ( 359/105 ). 408. East, Off-shore. 80. island Urbanization. Low. 29.
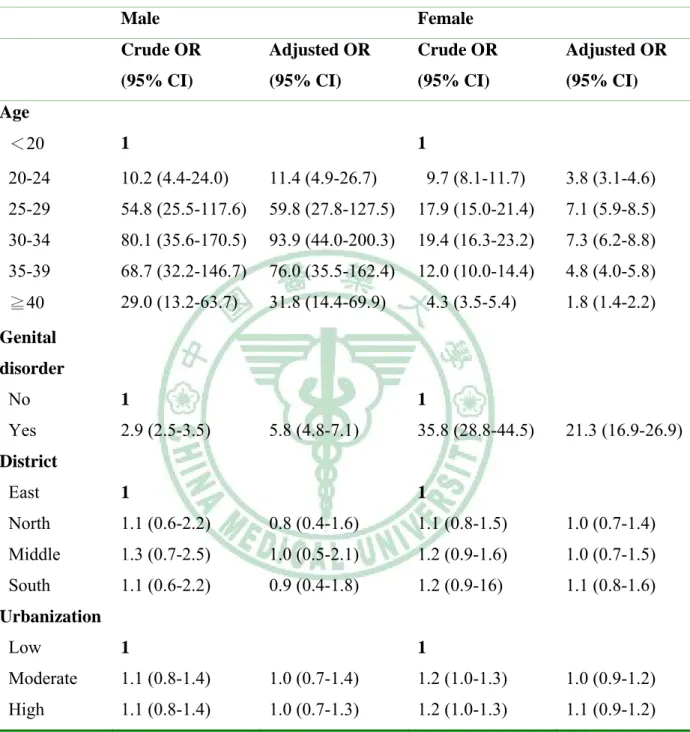
(42) 利用邏輯式回歸計算男性女性不孕症危險比,在男性方面,生殖器 官損害的男性被診斷為不孕症的危險比為 2.9,隨著年齡的增加,不孕症 危險比也有逐漸增加的趨勢,在地區別及都市化程度則都沒有達到統計 顯著意義;在女性方面,生殖器官損害的女性被診斷為不孕症的危險比 為 35.8,隨著年齡的增加,危險比也有增加的趨勢,都市化程度較高的 女性,被診斷為不孕症的危險比約為 1.2 (p<0.05),且有統計顯著的差 異,在地區別則沒有達到統計顯著的意義。以多變項邏輯式回歸比較各 變項不孕症危險比,在男性不孕症方面,生殖器官損害及年齡層較高的 男性,其危險比在控制其他變項後,都明顯增加且達到統計顯著意義; 在女性方面,僅剩下生殖器官損害與年齡層達到統計顯著的意義。(Table 6). 30.
(43) Table 6 Odds ratio for infertility with Genital disorder, age, district, and urbanization Male. Female. Crude OR. Adjusted OR. Crude OR. Adjusted OR. (95% CI). (95% CI). (95% CI). (95% CI). Age <20. 1. 20-24. 10.2 (4.4-24.0). 11.4 (4.9-26.7). 25-29. 54.8 (25.5-117.6). 30-34. 1 9.7 (8.1-11.7). 3.8 (3.1-4.6). 59.8 (27.8-127.5). 17.9 (15.0-21.4). 7.1 (5.9-8.5). 80.1 (35.6-170.5). 93.9 (44.0-200.3). 19.4 (16.3-23.2). 7.3 (6.2-8.8). 35-39. 68.7 (32.2-146.7). 76.0 (35.5-162.4). 12.0 (10.0-14.4). 4.8 (4.0-5.8). ≧40. 29.0 (13.2-63.7). 31.8 (14.4-69.9). 4.3 (3.5-5.4). 1.8 (1.4-2.2). Genital disorder No. 1. Yes. 2.9 (2.5-3.5). 1 5.8 (4.8-7.1). 35.8 (28.8-44.5). 21.3 (16.9-26.9). District East. 1. North. 1.1 (0.6-2.2). 0.8 (0.4-1.6). 1.1 (0.8-1.5). 1.0 (0.7-1.4). Middle. 1.3 (0.7-2.5). 1.0 (0.5-2.1). 1.2 (0.9-1.6). 1.0 (0.7-1.5). South. 1.1 (0.6-2.2). 0.9 (0.4-1.8). 1.2 (0.9-16). 1.1 (0.8-1.6). 1. Urbanization Low. 1. Moderate. 1.1 (0.8-1.4). 1.0 (0.7-1.4). 1.2 (1.0-1.3). 1.0 (0.9-1.2). High. 1.1 (0.8-1.4). 1.0 (0.7-1.3). 1.2 (1.0-1.3). 1.1 (0.9-1.2). 1. 31.
(44) 在八年所有被診斷為不孕症的 3078 位女性,經診治受孕成功的有 1487 人,不孕女性經治療而受孕的機率約為 48.3 %,生產方式包括自 然分娩和剖腹產為最多,子宮外孕、輸卵管外孕等不正常受孕也佔少數。 (Table 7). Table 7 Number of women with successful recovery from infertility and types of delivery by type of infertility identified from claim files reported in the National Health Insurance cohort in Taiwan from 1996 through 2003 Classification of. Total. Spontaneous. Caesarean. infertility. Ectopic. Total. pregnancy. recovery Rate (%). Anovulation. 566. 114. 74. 9. 35. Tubal origin. 80. 21. 15. 2. 48. Other specified. 54. 17. 14. 0. 57. 2378. 649. 532. 40. 51. 3078. 801. 635. 51. 48. origin Unspecified origin Total. 32.
(45) 第二節. 壬基苯酚與精液品質相關性探討 男性社會人口學、生活型態、飲食習慣基本資料 所有受試者男性平均年齡為 35.9 歲;BMI 平均為 24.5,體重過重者 (BMI>25)約佔 36%;教育程度在大學以下者占較多數,約為 64%;有 29% 男性工作會接觸到化學藥劑或輻射(Table 8);39%男性有長期服用保健 食品的習慣,大部分為維他命;13%男性長期服用藥物;48%男性每個禮 拜幾乎沒有運動的習慣;每個禮拜穿著緊身褲或三角內褲的頻率中,57% 男性幾乎沒有穿著緊身褲或三角內褲的習慣;83%男性沒有浸泡熱水澡的 習慣;47%的男性從來不抽菸,22%的男性已經戒菸,有抽菸習慣者為 31%; 有喝酒或嚼檳榔習慣男性分別約佔 26%及 11%,大部分男性沒有喝酒及嚼 檳榔的習慣;38%男性沒有熬夜的習慣,每週熬夜兩天及三天以上者,分 別約佔 34%及 28%(Table 9)。在飲食習慣上,不吃牛肉、每個月至少吃 ㄧ次、及每個禮拜至少吃ㄧ次者分別佔 18%、46%、36%;豬肉則分別為 2%、12%、86%;羊肉為 20%、59%、21%;雞鴨鵝肉為 4%、10%、86%;全 脂牛奶為 31%、42%、27%;脫脂牛奶為 32%、38%、30%;魚肉為 2%、30%、 68%;海鮮類食物為 4%、44%、52%;內臟類食物為 17%、61%、22%;蛋為 0%、18%、82%;水果為 4%、40%、56%;咖啡為 28%、37%、35%;茶為 12%、 32%、56%;生菜沙拉為 35%、52%、13% (Table 10)。. 33.
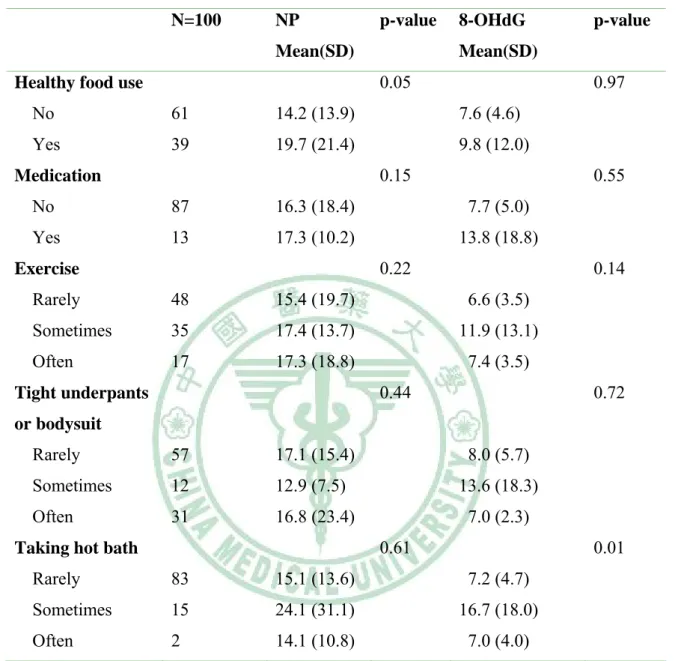
(46) 社會人口學、生活型態、飲食習慣對男性壬基苯酚內在暴露量的影響 男 性 壬 基 苯 酚 內 在 暴 露 量 以 尿 樣 含 量 計 平 均 為 16.44 μ g/g creatinine,年齡、BMI 與壬基苯酚的尿液中濃度皆沒有顯著的相關 (Table 8)。在社會人口學變項中,教育程度高低、工作壓力大小、生活 壓力大小、工作是否接觸化學藥劑或輻射,尿液中的壬基苯酚含量皆沒 有顯著的差異。在生活型態中,有服用保健食品者,尿液中的壬基苯酚 含量高於沒有服用保健食品者(19.71 v.s 14.24μg/g creatinine),且 有顯著的差異(p-value=0.05)。定期服用藥物、有無運動習慣、穿著緊 身褲或三角內褲頻率、洗熱水澡頻率,壬基苯酚暴露量皆無顯著的差異 (Table 9);尿液的壬基苯酚含量和抽菸的相關性很小,戒菸和戒檳榔的 人的含量較高,但不顯著,是否熬夜亦不相關(Table 9)。在飲食習慣, 每個禮拜至少吃ㄧ次蛋比起每個月至少吃ㄧ次蛋的男性,其壬基苯酚有 顯著的差異(17.93 v.s 9.86μg/g creatinine, p-value=0.03);另外, 不吃生菜沙拉、每個月至少吃ㄧ次、每個禮拜至少吃ㄧ次,壬基苯酚有 增加的趨勢(12.51, 17.18, 24.14 μg/g creatinine),並有顯著的差 異(p-value=0.01);其他如牛肉、豬肉、羊肉、雞鴨鵝肉、全脂牛奶、 脫脂牛奶、魚肉、海鮮類食物、內臟類食物、水果、咖啡以及茶攝取的 頻率,壬基苯酚皆沒有顯著的差異(Table 10)。 另外針對 8-OHdG 在社會人口學、生活型態與飲食習慣的分布,在生 活習慣上,偶而洗熱水澡的男性,其 8-OHdG 有較高的濃度, 16.7 μg/g creatinine;有喝酒習慣的人,所測得的 8-OHdG 較不喝酒或藉酒的男性 為低,6.1μg/g creatinine,且兩者都有顯著的差異(p<0.05)(Table 8)。在飲食習慣上,有喝茶習慣的男性,8-OHdG 皆明顯高於沒有喝茶習 慣的人 (8.3-10.3 v.s 3.9 μg/g creatinine, p=0.006);不吃沙拉的 男性,8-OHdG 也明顯低於有吃沙拉的男性 (5.6 v.s 9.8-12.0 μg/g. 34.
(47) creatinine, p=0.002)。. 35.
(48) Table 8 Distributions of urinary nonylphenol and 8-hydroxydeoxyguanosine in males by socio-demographic characteristics N=100. NP Mean(SD). p-value. 16.44 (17.4) Age, years Mean(SD) ≦30 31-35 36-40 >40 BMI, kg/m2 Mean(SD) ≦25 >25 Education ≦Senior high Vocational school ≧College Working stress Light Medium Heavy Life stress Light Medium Heavy. 8-OHdG Mean(SD). p-value. 8.5 (8.4). 35.9 (5.4) 16 32 29 23. 16.0 (12.7) 17.5 (19.3) 17.1 (22.2) 14.3 (8.10). 0.93. 6.9 (3.0) 8.1 (5.1) 8.2 (6.1) 10.6 (15.0). 0.79. 24.5 (3.4) 64 36. 15.2 (14.3) 18.5 (21.9). 0.54. 8.8 (9.8) 8.0 (5.0). 0.77. 0.48. 0.33. 31 33. 24.0 (28.2) 11.8 (5.6). 10.9 (13.9) 8.1 (5.5). 36. 14.4 (9.2). 7.2 (5.0) 0.91. 25 59 16. 17.9 (18.4) 15.1 (12.0) 18.8 (28.6). 0.59 7.4 (5.0) 9.3 (10.2) 7.6 (5.0). 0.17 33 61 5. 18.5 (17.1) 13.6 (10.9) 40.7 (55.4). Working with radiation or chemical No 70 15.3 (13.7) Yes 29 19.1 (23.9) NP: Nonylphenol, μg/g creatinine. 8.6 (6.3) 8.7 (9.7) 7.0 (2.2) 0.60. 8-OHdG: 8-hydroxydeoxyguanosine,μg/g creatinine. 36. 0.99. 0.78. 7.8 (5.1) 10.1 (13.3).
(49) Table 9 Distributions of urinary nonylphenol and 8-hydroxydeoxyguanosine in males by lifestyle N=100. NP. p-value. Mean(SD). 8-OHdG Mean(SD). 0.05. Healthy food use. 0.97. No. 61. 14.2 (13.9). 7.6 (4.6). Yes. 39. 19.7 (21.4). 9.8 (12.0) 0.15. Medication. 0.55. No. 87. 16.3 (18.4). 7.7 (5.0). Yes. 13. 17.3 (10.2). 13.8 (18.8) 0.22. Exercise. 0.14. Rarely. 48. 15.4 (19.7). 6.6 (3.5). Sometimes. 35. 17.4 (13.7). 11.9 (13.1). Often. 17. 17.3 (18.8). 7.4 (3.5) 0.44. Tight underpants. p-value. 0.72. or bodysuit Rarely. 57. 17.1 (15.4). 8.0 (5.7). Sometimes. 12. 12.9 (7.5). 13.6 (18.3). Often. 31. 16.8 (23.4). 7.0 (2.3) 0.61. Taking hot bath. 0.01. Rarely. 83. 15.1 (13.6). 7.2 (4.7). Sometimes. 15. 24.1 (31.1). 16.7 (18.0). Often. 2. 14.1 (10.8). 7.0 (4.0). NP: Nonylphenol, μg/g creatinine 8-OHdG: 8-hydroxydeoxyguanosine,μg/g creatinine. 37.
(50) Table 9 Distributions of urinary nonylphenol and 8-hydroxydeoxyguanosine in males by lifestyle (continued) N=100. NP. p-value. Mean(SD). 8-OHdG Mean(SD). 0.81. Cigarette Smoking. 0.3. No. 47. 16.2 (15.3). 8.2 (10.5). Cessation. 22. 16.6 (14.5). 8.6 (4.9). Yes. 31. 16.7 (22.6). 8.8 (6.3) 0.78. Alcohol drinking. 0.048. No. 69. 16.5 (18.0). 9.2 (9.5). Cessation. 5. 22.3 (17.3). 10.7 (0.2). Yes. 26. 15.4 (16.3). 6.1 (3.6) 0.07. Areca quid. 0.14. No. 78. 16.4 (18.3). 8.4 (9.0). Cessation. 11. 23.6 (18.4). 8.6 (8.0). Yes. 11. 10.5 (5.8). 9.2 (3.6) 0.89. Stay up nights. 0.50. No. 38. 15.2 (12.2). 6.9 (3.7). Sometimes. 34. 19.9 (26.0). 8.3 (5.6). Often. 28. 14.4 (10.7). 10.6 (13.0). NP: Nonylphenol, μg/g creatinine 8-OHdG: 8-hydroxydeoxyguanosine, μg/g creatinine. 38. p-value.
(51) Table 10 Distributions of urinary nonylphenol and 8-hydroxydeoxyguanosine in males by dietary consumption N=100 Beef No Sometimes Often Pork No Sometimes Often Mutton No Sometimes Often Chicken No Sometimes Often Whole milk No Sometimes Often Skim milk No Sometimes Often Fish No Sometimes Often. NP Mean(SD). p-value. 8-OHdG Mean(SD). 0.13 18 46 36. 16.2(11.0) 17.7(16.3) 15.0(21.6). 0.88 11.8(16.5) 7.4(4.4) 8.2(5.5). 0.81 2 12 86. 16.2 (9.1) 13.6 (7.0) 16.9 (18.7). 0.47 37.4 (44.0) 8.7 (6.5) 7.6 (4.8). 0.65 20 59 21. 18.5 (21.6) 15.3 (11.0) 17.7 (26.8. 0.15 10.2 (16.5) 7.7 (4.5) 8.9 (5.4). 0.77 4 10 86. 15.1 (5.5) 16.5 (14.3) 16.5 (18.3). 0.44 21.9 (31.1) 6.7 (5.3) 7.9 (5.1). 0.84 31 42 27. 17.6 (22.1) 14.8 (12.0) 17.8 (19.0). 0.52 7.3 (4.8) 9.3 (10.8) 8.5 (6.7). 0.06 31 38 30. 19.7 (18.3) 12.0 (8.7) 17.4 (22.5). 0.89 9.9 (14.1) 7.6 (4.3) 8.6 (6.1). 0.76 2 30 67. 16.2 (9.1) 13.0 (8.1) 16.1 (15.0). Shellfish No 4 13.4 (6.2) Sometimes 44 17.3 (21.1) Often 52 16.0 (14.6) NP: Nonylphenol μg/g creatinine. 0.41 37.4 (44.0) 7.4 (4.9) 8.0 (5.1). 0.64. 8-OHdG: 8-hydroxydeoxyguanosineμg/g creatinine. 39. p-value. 0.53 21.3 (31.5) 6.7 (3.3) 8.9 (6.1).
(52) Table 10 Distributions of nonylphenol and 8-hydroxydeoxyguanosine in males by dietary consumption (continued) N=100. NP. p-value 8-OHdG. Mean(SD) No. Mean(SD) 0.61. Viscera 17. 0.20. 13.3 (5.7). 10.3 (16.4). Sometimes 61. 18.0 (20.1). 7.5 (4.7). Often. 15.0 (14.9). 9.6 (6.2). 22. 0.03. Egg No. 0. Sometimes 18 Often. 82. None. 0.88 None. 9.9 (5.5). 10.7 (15.3). 17.9 (18.8). 7.9 (5.3) 0.37. Fruit No. 4. 0.26. 8.5 (3.0). 4.7 (0.8). Sometimes 40. 17.5 (20.7). 9.7 (11.4). Often. 16.2 (15.1). 7.9 (5.3). 56. 0.79. Coffee No. 28. 0.09. 17.2 (19.2). 6.6 (4.6). Sometimes 37. 13.5 (9.3). 10.3 (11.9). Often. 18.8 (21.7). 8.1 (5.6). 35. 0.24. Tea No. 0.006. 12. 22.1 (18.7). 3.9 (1.6). Sometimes 32. 14.8 (11.6). 10.3 (12.4). Often. 16.2 (19.9). 8.3 (5.6). 56. 0.01. Salad No. 0.002. 35. 12.6 (12.7). 5.6 (2.5). Sometimes 52. 17.2 (15.0). 9.8 (10.7). Often. 24.1 (30.4). 13. p-value. NP: Nonylphenol μg/g creatinine 8-OHdG: 8-hydroxydeoxyguanosineμg/g creatinine. 40. 12.0 (7.7).
(53) 社會人口學、生活型態對男性精液品質的影響 男性的精液品質,不論是精子數目、活動力及正常形態比例在社會 人口學特徵或生活型態的比較,皆沒有顯著的差異(Table 11, 12),唯 年齡在趨勢檢定中,精液品質皆隨著年齡層的增加而有顯著下降的趨勢 (Table 11)。. 41.
(54) Table 11 Distributions of sperm quality in males by socio-demographic characteristics N. Concentration. p. N. Mean(SD). Mobility. N. Mean(SD) 0.33. Age, years. p. Morphology. p. Mean(SD) 0.03. 0.13. ≦30. 16. 72.5 (42.2). 16. 73.7 (23.4). 12. 13.0 (8.2). 31-35. 26. 63.9 (48.5). 25. 66.1 (26.6). 16. 10.8 (6.9). 36-40. 28. 50.9 (37.4). 27. 58.9 (26.8). 16. 8.8 (7.2). >40. 18. 46.0 (38.7). 18. 50.4 (25.9). 16. 6.8 (6.5). p for trend. 0.04. 0.01. 0.02. BMI, kg/m2. 0.65. 0.17. 0.29. ≦25. 56. 55.1 (43.1). 55. 60.8 (29.1). 36. 9.9 (7.8). >25. 32. 62.1 (44.1). 31. 63.9 (22.1). 24. 9.2 (6.7). 0.38. Education. 0.90. 0.78. ≦Senior high. 26. 59.3 (45.8). 24. 68.0 (26.5). 19. 9.9 (7.1). Vocational. 30. 62.7 (45.7). 30. 64.9 (22.8). 23. 10.7 (6.9). 32. 51.6 (39.5). 32. 54.6 (29.2). 18. 8.2 (1.2). school ≧College. 0.45. Working stress. 0.90. 0.47. Light. 24. 66.8 (47.0). 24. 60.6 (30.7). 19. 7.9 (6.6). Medium. 49. 55.2 (44.5). 47. 61.0 (27.1). 32. 10.5 (8.1). Heavy. 15. 48.0 (31.8). 15. 67.1 (18.1). 9. 5.7 (0.6). 0.31. Life stress. 0.33. 0.18. Light. 32. 49.2 (42.5). 32. 55.9 (31.3). 21. 7.6 (7.2). Medium. 52. 61.2 (41.2). 50. 64.5 (23.1). 37. 10.8 (7.2). Heavy. 3. 67.1 (83.4). 3. 75.8 (28.4). 2. 10.0 (11.3). 0.67. Working with. 1.00. 0.86. radiation or chemical No. 63. 59.8 (45.5). 62. 61.3 (28.2). 43. 9.8 (7.5). Yes. 25. 52.4 (37.7). 24. 63.6 (22.9). 17. 9.2 (7.1). BMI: Body mass index. 42.
(55) Table 12 Distributions of sperm quality in males by lifestyle N. Concentration. p. N. Mean(SD). Mobility. N. Mean(SD) 0.19. Healthy food. p. Morphology Mean(SD). 1.00. 1.00. No. 54. 63.4 (46.5). 54. 61.6 (27.8). 44. 9.6 (7.4). Yes. 34. 48.6 (36.6). 32. 62.5 (25.2). 16. 9.6 (7.2). 0.82. Medication. 0.67. 0.64. No. 77. 58.1 (43.4). 75. 61.8 (26.4). 50. 9.5 (7.6). Yes. 11. 54.5 (44.9). 11. 63.1 (30.0). 10. 10.2 (6.3). 0.83. Exercise. 0.99. 0.17. Rarely. 39. 60.8 (44.0). 38. 61.6 (29.0). 30. 10.7 (7.5). Sometimes. 33. 55.1 (42.5). 32. 62.3 (24.5). 21. 6.9 (5.2). Often. 16. 55.4 (45.8). 16. 62.0 (27.0). 9. 12.6 (9.4). 0.61. Tight underpants. p. 0.82. 0.93. or bodysuit Rarely. 50. 55.7 (46.5). 48. 62.4 (26.7). 30. 9.5 (7.0). Sometimes. 11. 63.9 (35.6). 11. 65.7 (25.2). 8. 10.3 (6.5). Often. 27. 58.9 (41.3). 27. 59.6 (28.1). 22. 9.6 (8.3). 0.09. Taking hot bath. 0.95. 0.56. Rarely. 58. 61.4 (45.2). 72. 62.2 (26.9). 51. 9.6 (7.5). Sometimes. 12. 32.4 (20.1). 12. 58.9 (28.9). 8. 9.1 (6.8). Often. 2. 71.0 (24.8). 2. 70.1 (0.2). 1. 17.0 (0.0). 43.
(56) Table 12 Distributions of sperm quality in males by lifestyle (continued) N. Concentration. p. N. Mobility. Mean(SD). N. Mean(SD) 0.77. Cigarette Smoking. p. Morphology Mean(SD). 0.37. 0.18. No. 42. 56.7 (38.9). 41. 59.2 (25.9). 28. 8.8 (7.6). Cessation. 20. 52.0 (44.0). 19. 59.1 (31.8). 17. 8.5 (6.4). Yes. 26. 63.6 (50.2). 26. 68.4 (23.6). 15. 12.5 (7.5). 0.21. Alcohol drinking. 0.21. 0.78. No. 60. 62.2 (46.0). 58. 66.1 (23.4). 37. 10.2 (7.6). Cessation. 4. 25.5 (29.2). 4. 48.5 (41.3). 4. 8.3 (7.5). Yes. 24. 51.8 (36.0). 24. 54.1 (30.3). 19. 8.8 (6.9). 0.21. Areca quid. 1.00. 0.82. No. 68. 61.3 (42.9). 67. 62.4 (25.4). 44. 9.5 (7.4). Cessation. 9. 41.1 (30.6). 8. 65.7 (21.1). 7. 10.3 (5.6). Yes. 11. 48.9 (53.4). 11. 56.3 (37.9). 9. 9.8 (8.8). 0.57. Stay up nights. 0.97. 0.94. No. 34. 53.2 (39.5). 33. 62.3 (27.7). 24. 9.7 (7.9). Sometimes. 27. 63.3 (41.3). 27. 62.9 (24.4). 18. 9.1 (6.8). Often. 27. 57.8 (50.5). 26. 60.4 (28.6). 18. 10.1 (7.4). 44. p.
(57) 尿液中壬基苯酚含量與精液品質相關性探討 男性尿液中壬基苯酚含量與精子數目、精子活動力、精子正常形態 比例皆沒有顯著的相關性,僅與精子數目有負的相關性;年齡的增長與 精液品質的下降有顯著的相關性。男性壬基苯酚內在暴露量與 8-OHdG 有 顯著的正相關存在;精子數目、活動力及正常形態比例之間有顯著相關 (Table 13)。. Table 13 The Pearson correlation among age, body mass index, urinary nonylphenol, urinary 8-hydroxydeoxyguanosine, and quality of sperm. Age BMI. Age. BMI. NP. 8-OHdG. Concentration. Mobility. Morphology. 1. 0.200. 0.022. 0.072. -0.268*. -0.268**. -0.389*. 1. 0.002. -0.023. -0.065. -0.145. -0.131. 1. 0.214*. -0.081. 0.028. 0.206. 1. 0.142. 0.107. -0.082. 1. 0.549**. 0.475**. 1. 0.586**. NP 8-OHdG Concentration Mobility. 1. Morphology *:p-value<0.05 **:p-value<0.01 BMI: Body mass index, kg/m2 NP: Nonylphenol, μg/g creatinine 8-OHdG: 8-hydroxydeoxyguanosine, μg/g creatinine. 45.
(58) 精液品質正常與否與壬基苯酚內在暴露量的比較 6. 分別依精液品質正常與否,分別區分精子數目(>20×10 1/ml)、精 子活動力(>50%)、精子正常形態比例(>14%)正常與否,比較壬基苯酚 內在暴露量的差異性(Table 14)。精子數目正常者(n=70)比起不正常者 (n=18),壬基苯酚濃度明顯較低(14.0 vs 20.2 μg/g creatinine),且 有顯著的差異。在精子活動力與精子正常形態比例正常與不正常者,壬 基苯酚濃度則無顯著的差異分別為 14.2 vs 14.7μg/g creatinine 及 14.4 vs 13.0 μg/g creatinine。8-OHdG 在任何精液品質指標皆沒有顯 著的差異。在依照精液品質區分正常與至少一項不正常、至少兩項、三 項都不正常評估壬基苯酚與 8-OHdG 之間的差異,也皆未達到統計顯著的 差異,但精液品質三項檢查結果都不正常的男性,其壬基苯酚及 8-OHdG 的濃度皆為最高,分別為 17.43 μg/g creatinine 及 8.42 μg/g creatinine。. 46.
(59) Table 14 Average urinary concentration of nonylphenol and 8-hydroxydeoxyguanosine by sperm quality based on concentration, mobility and morphology of sperm Male. NP. p-value. Mean(SD). 8-OHdG. p-value. Mean(SD) 0.027. Concentration. 0.59. Normal. 70. 14.0 (12.7). 7.9 (5.3). Abnormal. 18. 20.2 (15.7). 8.8 (3.7) 0.47. Mobility. 0.62. Normal. 61. 14.2 (13.2). 8.1 (5.3). Abnormal. 25. 14.6 (9.9). 7.3 (4.1) 0.16. Morphology. 0.49. Normal. 16. 14.4 (8.5). 8.2 (5.1). Abnormal. 44. 13.0 (13.4). 7.2 (3.8) 0.15. Number of. 0.85. abnormal item of sperm quality Zero. 15. 14.0 (8.7). 8.3 (5.3). One. 26. 13.1 (15.8). 6.7 (3.0). Two. 10. 9.4 (4.9). 7.3 (4.8). Three. 9. 17.4 (11.3). 8.4 (4.9). NP: Nonylphenol, μg/g creatinine 8-OHdG: 8-hydroxydeoxyguanosine, μg/g creatinine. 47.
(60) 探討影響精子數目正常與否相關性因子 依照精子數目正常與否,觀察其社會人口學特徵、生活習慣及飲食 習慣間是否也有差異性的存在,而排除對壬基苯酚暴露量與精子數目相 關的影響。所有社會人口學特徵、生活習慣及飲食習慣不論在精子數目 正常男性或不正常男性,皆沒有達到統計上顯著的差異(Table 15, 16, 17)。. 48.
(61) Table 15 Comparison between abnormal and normal sperm concentrations by socio-demographic characteristics Abnormal. Normal. (N=18). (N=70). p-value 0.89. Age, years ≦30. 2 (11.1). 14 (20.0). 31-35. 6 (33.3). 20 (28.6). 36-40. 6 (33.3). 22 (31.4). >40. 4 (22.3). 16 (20.0). BMI, kg/m2. 0.43. ≦25. 10 (55.6). 46 (65.7). >25. 8 (44.4). 24 (34.3) 0.64. Education ≦Senior high. 7 (38.9). 29 (27.1). Vocational. 5 (27.8). 25 (35.7). 6 (33.3). 26 (37.2). school ≧College. 0.88. Working stress Light Medium Heavy. 5 (27.8). 19 (27.1). 11 (61.1). 38 (54.3). 2 (11.1). 13 (18.6) 0.10. Life stress Light. 10 (55.6). 22 (31.2). Medium. 7 (38.9). 45 (65.2). Heavy. 1 (5.5). 2 (2.9) 0.57. Working with radiation or chemical No. 12 (66.7). 51 (72.9). Yes. 6 (33.3). 19 (27.1). BMI: Body mass index. 49.
(62) Table 16 Comparison between abnormal and normal sperm concentrations by lifestyle Abnormal. Normal. (N=18). (N=70) 0.29. Healthy food No. 9 (50.0). 45 (64.3). Yes. 9 (50.0). 25 (35.7) 1.00. Medication No Yes. p-value. 16(88.9). 61 (87.1). 2 (11.1). 9 (12.9) 0.17. Exercise Rarely. 7 (33.9). 32 (45.7). Sometimes. 5 (27.8). 28 (40.0). Often. 6 (33.3). 10 (14.3) 0.65. Tight underpants or bodysuit Rarely. 12 (66.7). 38 (54.3). Sometimes. 2 (11.1). 9 (12.9). Often. 4 (22.2). 23 (32.9) 0.82. Taking hot bath Rarely. 15 (83.3). 59(84.3). Sometimes. 3 (16.7). 9 (12.9). Often. 0 (0.0). 2 (2.8). 50.
(63) Table 16 Comparison between abnormal and normal sperm concentrations by lifestyle (continued) Abnormal. Normal. (N=18). (N=70). p-value 0.51. Cigarette Smoking No. 7(38.9). 34(50.0). Cessation. 6(33.3). 14(20.0. Yes. 5(27.8). 21(30.0) 0.26. Alcohol drinking No. 11(61.1). 49(70.0). Cessation. 2(11.1). 2(2.9). Yes. 5(27.8). 19(27.1) 0.42. Areca quid No. 12(66.7). 56(80.0). Cessation. 3(16.7). 6(8.6). Yes. 3(16.6). 8(11.4) 0.10. Stay up nights No. 8(44.4). 26(37.1). Sometimes. 2(11.2). 25(35.7). Often. 8(44.4). 19(27.1). 51.
(64) Table 17 Comparison between abnormal and normal sperm concentrations by dietary consumption Abnormal (N=18) Beef No Sometimes Often Pork No Sometimes Often Mutton No Sometimes Often Chicken No Sometimes Often Whole milk No Sometimes Often Skim milk No Sometimes Often Fish No Sometimes Often Shellfish No Sometimes Often. Normal (N=70). p-value 0.78. 4 (22.2) 9 (50.0) 5 (27.8). 13 (18.6) 31 (44.3) 26 (37.1) 0.75. 0 (0) 3 (16.7) 15 (83.3). 1 (1.4) 8 (11.4) 61 (87.2) 0.16. 6 (33.3) 10 (55.6) 2 (11.1). 10 (14.3) 44 (62.9) 16 (22.8) 0.18. 0 (0.0) 4 (22.2) 14 (77.8). 3 (4.3) 5 (7.1) 62 (88.6) 0.71. 7 (38.9) 6 (33.3) 5 (27.8). 21 (30.0) 31 (44.3) 18 (25.7) 1.00. 6 (33.3) 7 (38.9) 5 (27.8). 20 (29.0) 28 (40.6) 21 (30.4) 0.10. 0 (0.0) 8 (44.4) 10 (55.6). 1 (1.4) 15 (21.4) 54 (77.2) 0.80. 0 (0.0) 9 (50.0) 9 (50.0). 3 (4.3) 28 (40.0) 39 (55.7). 52.
(65) Table 17 Comparison between abnormal and normal sperm concentrations by dietary consumption (continued) Abnormal. Normal. (N=18). (N=70) 0.65. Viscera No Sometimes Often. 2 (11.1). 13 (18.6). 11 (61.1). 43 (61.4). 5 (27.8). 14 (20.0) 0.73. Egg Sometimes Often. 4 (22.2). 12 (17.1). 14 (77.8). 58 (82.9) 0.67. Fruit No. 0 (0.0). 4 (5.7). Sometimes. 9 (50.0). 28 (40.0). Often. 9 (50.0). 38 (54.3) 1.00. Coffee No. 5 (27.8). 19 (27.1). Sometimes. 7 (38.9). 25 (35.7). Often. 6 (33.3). 26 (37.1) 0.69. Tea No. 3 (16.7). 7 (10.0). Sometimes. 6 (33.3). 23 (32.9). Often. 9 (50.0). 40 (57.1) 0.55. Salad No Sometimes Often. p-value. 5 (27.8). 29 (41.4). 10 (55.7). 32 (45.7). 3 (16.5). 9 (12.9). 53.
(66) 壬基苯酚內在暴露量與精液品質正常與否之相對危險性 將壬基苯酚內在暴露量依四分位數分層,分成濃度小於 12.15、 12.15 -17.37 及大於 17.37 μg/g creatinine 三組,探討與精液品質 之 相 對 危 險 性 。 壬 基 苯 酚 內 在 暴 露 量 增 加 超 過 17.37 μ g/g creatinine,其精子數目正常與否之勝算比為 4.31 ,且有達到統計顯 著的意義(Table 18); 之後依逐步回歸 (stepwise) 選擇其他影響壬基 苯酚內在暴露量的因子,包括年齡、生活型態和飲食,皆沒有達到統計 顯著,故僅將年齡加入回歸方程式中,調整年齡的因素後,壬基苯酚在 濃度超過 17.37 μg/g creatinine 時,其勝算比增加至 4.9 (95% CI. 1.3-18.7) ,且達到統計顯著意義。在精子活動力危險性也是有因壬基 苯酚濃度而增加的趨勢,但沒有達到統計顯著的意義(Table 19)。在精 子正常形態比例,則發現不到任何的趨勢(Table 20)。. 54.
數據


+7


相關文件
Now, nearly all of the current flows through wire S since it has a much lower resistance than the light bulb. The light bulb does not glow because the current flowing through it
Co-teaching has great potential when defined as a form of collaboration that involves equal partners contributing different types of expertise to the process of planning,
嚴重精神病 (Severe Mental Illness, SMI) 、一般精神障礙 (Common Mental Disorders, CMD).
批判性思考 + 創造力 創造力示例二 創造力 創造力 示例二 示例二: 示例二 : :環境調查 : 環境調查 環境調查 環境調查..
According to Ho (2003), Canto Pop “has developed since the early 1970s with a demand from Hong Kong audiences for popular music in their own dialect, Cantonese. Cantonese is one
a) Visitor arrivals is growing at a compound annual growth rate. The number of visitors fluctuates from 2012 to 2018 and does not increase in compound growth rate in reality.
* All rights reserved, Tei-Wei Kuo, National Taiwan University,
• A teaching strategy to conduct with young learners who have acquired some skills and strategies in reading, through shared reading and supported reading.. • A good
