國立交通大學
國立交通大學
國立交通大學
國立交通大學
光電工程
光電工程
光電工程
光電工程研究所
研究所
研究所
研究所
博
博
博
博
士
士
士
士
論
論
論
論
文
文
文
文
以
以
以
以分離式
分離式
分離式螢光粉波長轉換機制所形成
分離式
螢光粉波長轉換機制所形成
螢光粉波長轉換機制所形成的
螢光粉波長轉換機制所形成
的
的
的平
平
平
平面光源
面光源
面光源
面光源
之
之
之
之研究
研究
研究
研究
Study on Planar Lighting Systems Using Remote
Phosphor Wavelength Conversion
研 究 生:黃信道
指導教授:蔡娟娟 教授
黃乙白 副教授
中
中
中
中
華
華
華
華
民
民
民
民
國
國
國
國
一
一○○
一
一
○○
○○
○○
年
年
年
年
一
一
一
一
月
月
月
月
以
以
以
以分離式
分離式
分離式螢光粉波長轉換機制所形成
分離式
螢光粉波長轉換機制所形成
螢光粉波長轉換機制所形成的
螢光粉波長轉換機制所形成
的
的
的平
平
平
平面光源
面光源
面光源
面光源
之
之
之
之研究
研究
研究
研究
Study on Planar Lighting Systems Using Remote
Phosphor Wavelength Conversion
研 究 生: 黃信道 Student: Hsin-Tao Huang
指導教授: 蔡娟娟
Advisor: Dr. Chuang-Chuang Tsai
指導教授:
黃乙白
Dr. Yi-Pai Huang
國 立 交 通 大 學 電機學院
光電工程研究所
博 士 論 文
A Thesis
Submitted to Institute of Electro-Optical Engineering National Chiao Tung
University
in partial Fulfillment of the Requirements for the
Degree of
Doctorate of Philosophy
in
Electro-Optical Engineering
January 2011
以
以
以
以分離式
分離式
分離式螢光粉波長轉換機制所形成
分離式
螢光粉波長轉換機制所形成
螢光粉波長轉換機制所形成的
螢光粉波長轉換機制所形成
的
的
的平
平
平
平面光源
面光源
面光源
面光源
之
之
之
之研究
研究
研究
研究
博士研究生:黃信道
指導教授
:蔡娟娟 教授
黃乙白 副教授
國立交通大學 光電工程研究所
摘
要
本論文研製之螢光粉波長轉換機制所形成的平面光源技術,主要專注於解決目前 LED 發光二極體做為平面光源應用時在光學與色彩表現上不均勻的問題,以及進一步提 升發光模組的光學效益之研究。雖然 LED 光源具有綠色環保以及節能減碳之技術優勢, 但因 LED 屬於點光源,故傳統 LED 在形成面光源之後,在發光效益、光源特性以及發 光品質仍有待進一步的改善。因此關於本論文的研究,從 LED 發光二極體的螢光粉封 裝進行研討,再深入至 LED 發光模組的研究,最後再將相關研究結論應用於雙面顯示 之系統。研究中發展了一種新的"螢光粉沿晶塗佈(Conformal Phosphor Coating, CPC)技術
"以及另一種"分離式螢光粉塗層(Remote Phosphor Coating, RPC)技術",並分別以該兩種
技術研究改善 LED 光源的顏色不均以及發光不均等問題,並進一步提升 LED 面光源模 組的發光效率。
形成一理想的螢光層塗層厚度,而有效降低了 LED 在不同視角之下的顏色不均勻問題, 同時採用物理原理的脈衝式 CPC 技術又具有環保無化學污染的技術優勢。而採用 RPC 技術則具有高發光效益之特性,但該技術應用在平面光源模組之相關研究卻是非常稀 少。研究結果顯示利用 RPC 技術經最佳化參數設計之後,可以兼具低色偏以及高發光效 益之特性,同時 RPC 技術因為兼具波長轉換機制以及光擴散機制之二重效果,所以以 RPC 技術可以輕易的形成均勻發光之平面光源模組。研究結果顯示採用 RPC 技術的 TFT-LCD 背光源模組或是照明模組,其光學與色彩表現結果皆優於採用傳統白光 LED 的光源模組。 本論文除了研究以波長 457 nm 的藍光,激發分離式的黃色螢光粉塗層而形成平面 光源之外,另採用波長 254 nm 的 UV 光源,激發 R/G/B 三色螢光粉混合塗層的平面光 源技術。因為 UV LED 尚未發展成熟,本論文採用 UV CCFL 作為本研究的基礎光源。 由於作為一次光源的 UV 光本身為不可見光,並不參與波長轉換之後的混光行為,當 R/G/B 螢光粉的激發頻譜經最佳化之後,以這樣的光源技術作為 TFT-LCD 背光源模組 使用,可以達成高色彩飽和度之光學表現,同時並避免了混光不均所造成的色偏問題﹔ 若作為照明使用,又能達成高演色性的高品質光源需求。因為這樣的平面光源技術具有 雙面對稱且均勻發光之光學特性,因此預期本技術所完成的雙面顯示系統將具有作為數 位電子看板或是促進新應用之潛力。 本研究從 LED 元件的螢光粉封裝技術出發,再至 LED 發光模組的色彩分析與光學 研究,最後結合熱傳模擬與熱輻射分析並應用於雙面顯示之數位電子看板系統。由樣品 實測結果顯示,本研究具有低色偏、高發光效益且兼具薄型化之機構特性,同時又無化 學污染等問題,因此本成果將完成一個新階段的 LED 光源系統之發展。
Study on Planar Lighting Systems Using Remote
Phosphor Wavelength Conversion
Ph.D. student:Hsin-Tao Huang
Advisors:Dr. Chuang-Chuang Tsai
Dr.
Yi-Pai Huang
Institute of Electro-Optical Engineering
National Chiao Tung University
ABSTRACT
This study investigates planar lighting that is based on remote phosphor conversion to solve the problems of color deviation, non-uniform light distribution and low luminance efficiency of LED lighting. The LED is an emerging solid state light source that could potentially replace traditional light sources, and the interest in the use of LEDs for general illumination has been rapidly increasing. The point-type lighting of LEDs demands a focus on illumination performance, and understanding of the features of uniformity, light distribution and efficiency when LEDs are used in planar lighting. Conventional white LEDs is not simultaneously satisfactory in all these respects. This study focuses on LED devices using "conformal phosphor coating, CPC" and LED lighting module using "remote phosphor coating, RPC" method. Eventually, a dual-sided display system was produced to realize the color and optics performance as compared to conventional planar lighting systems.
The results of this study reveal that the placement and arrangement of phosphors critically determine both the luminous efficiency and the color deviation. Since the phosphor
blue light is backscattered by the phosphor and lost by absorption by the LED chips. Additionally, the high temperature of an operating wLEDs causes thermal quenching, reducing the light radiation efficiency of the phosphor and InGaN blue LEDs. Therefore, the placing of phosphor remote to the LED chip has been explored to analyze the luminous efficiency and color deviation of lighting module.
The study of CPC by the pulsed spray (PS) method to an array of blue LED devices is investigated. PS can yield a wide range of color temperatures (Tc) from 2500 K to 9500 K with high color accuracy. Unlike other coating approaches, PS is a mechanical spray-based, environmentally friendly method that does not produce harmful ionic pollution in chemical reactions.
In an investigation of RPC, a planar lighting module of blue LEDs was utilized to excite a yellow phosphor film. The phosphor film herein acts simultaneously as a wavelength converter and a light diffuser simultaneously. The proposed configuration yields a lower color deviation than a conventional wLEDs lighting system, and a uniform luminous distribution, from an ultra-slim structure. Most importantly, the configuration does not include a conventional diffuser plate or light guide plate (LGP). Accordingly, an RPC lighting system with excellent optical performance can be realized in a compact module.
Hence, an ultraviolet (UV)-excited flat lighting (UFL) system, comprising a RPC is examined. An R/G/B trichromatic RPC is excited using a 254 nm UV light to achieve high color rendering and high luminous backlighting in a slim TFT-LCD display. A UFL system provides symmetrical dual-sided illumination without conventional optical reflectors. Furthermore, UFL exploits the thermal radiation mechanism to release the large amount of heat that is produced by the illumination system, preventing thermal accumulation. These characteristics of the UFL scheme were studied and compared with those of conventional lighting. A dual-sided display based on UFL lighting has potential for use in digital signage or
public information displays, for example.
This present investigation provides clear evidence of the low color deviation of LED devices. The color analysis and optics of an LED lighting module are studied. The findings are important since they suggest that a dual-sided display system with thermal radiation was low color deviation, high luminous efficiency and a compact mechanism design. The RPC scheme is environmentally friendly that does not involve chemical reactions that generate pollution. RPC lighting performs excellently in LED planar lighting systems.
誌謝
誌謝
誌謝
誌謝
真誠感恩生命中的貴人,我才能完成博士學業。 在交通大學的博士論文研究期間,最感謝指導教授蔡娟娟教授以及黃乙白博士在研究 工作與論文撰寫上的指導;同時也感謝金益世公司(KISmart Corporation)包含簡學仁董事 長、林澄鋒副董事長、簡偉隆總經理、張文吉副總經理以及其他同仁等等的體恤,方便 我在工作中亦能兼顧學校的修課與研究的進行,使我能在三年半的時間內,順利完成四 篇國際學術期刊論文(SCI)、十篇國際研討會議論文(Oral Presentation Paper)的發表以及 最後的博士論文。 在工作十年之後選擇再攻讀博士學位,真的是一個很大的挑戰,感謝自己的雙親黃錦 雲先生與許月華女士默默的支持著我,更感謝我的另一半香嬪無怨無悔的支撐著家,讓 我在工作、家庭與學業的多方煎熬當中,仍能讓兩個寶貝兒子和田與和閩幸福成長,我 的岳父、岳母吳榮華先生與吳曾淑英女士也不時的鼓勵著我,因為擁有這麼多親人的 愛,我才能有足夠的意志熬到今天。 同時,口試委員紀國鐘教授、謝漢萍教授、郭浩中教授、電控系趙昌博教授、中興大 學材料系武東星教授、台大光電所黃建璋教授以及中央大學光電系張正陽教授在論文口 試時的指正,讓我的論文邏輯更加完整。另外,台灣禪宗佛教會的師兄師姐們在精神上 的鼓勵,以及悟覺妙天師父的身心靈引導,讓我能在千頭萬緒的研究中,看見一線金光 乍現,精神專注如山,靈感如山泉般湧至。而前瞻光學實驗室的建翔、博文、智清等也 在我的研究上給予我很多的協助。再次,我發自內心真誠的感謝。 陳之藩先生說:要謝的人太多,就謝天吧!而我,卻要跟生命中所有的貴人一一真誠 感恩、道謝!Table of Contents
摘要
摘要
摘要
摘要 ...iii
Abstract ... v
致謝
致謝
致謝
致謝 ...viii
Table of Contents... ix
List of Tables...xii
Figure Caption...xiii
Chapter 1
Introduction ... 1
1.1 Preface ... 11.2 Issues of Current wLEDs Phosphor Distribution ... 4
1.2.1 Conformal Phosphor Coating... 5
1.2.2 Remote Phosphor Coating... 7
1.3 Motivation and Objectives ... 11
1.4 Organization of This Thesis ... 13
Chapter 2
Theoretical Backgrounds... 16
2.1 Radiometry and Photometry... 16
2.1.1 Spectral Power Distribution ... 18
2.1.2 Eye Sensitivity Functions... 19
2.1.3 Solid Angle... 20
2.1.4 Luminous Intensity... 21
2.1.5 Luminous Flux ... 21
2.1.6 Luminance ... 21
2.1.7 Illuminance... 22
2.1.8 Lambert's Cosine Law and Lambertian Surface ... 22
2.2 Ray Tracing ... 23
2.2.1 Law of Refraction (Snell's Law) ... 23
2.2.2 Law of Reflection... 24
2.2.3 Fresnel's Equations... 24
2.3 Bidirectional scattering distribution functions (BSDFs) ... 25
2.4 Light and Vision... 28
2.4.1 Full-width at half-maximum (FWHM) ... 28
2.4.2 Glare ... 29
2.4.3 Haze... 29
2.4.4 Mura ... 30
2.5.1 Tristimulus Values ... 32
2.5.2 CIE Chromaticity Coordinates ... 33
2.5.3 Color Difference... 35
2.5.4 Color Temperature ... 36
2.5.5 Correlated Color Temperature ... 37
2.5.6 Color Saturation ... 39
2.5.7 Color Rendering Index ... 41
Chapter 3
Experimental Details... 44
3.1 Phosphor... 44
3.2 Remote Phosphor Converter ... 47
3.3 Optical Materials ... 49
3.4 Experiment Process ... 50
Chapter 4
Low Color Deviation LED Devices using Conformal Phosphor Coating.... 52
4.1 Why Conformal Phosphor... 52
4.2 Color Distribution Analysis ... 53
4.3 Color Temperature Range ... 55
4.4 Environmental Influence ... 57
4.5 Summary ... 59
Chapter 5
High Efficiency LED Lighting Module using Remote Phosphor Scheme ... 60
5.1 Why Remote Phosphor... 60
5.2 Sample Preparation ... 61
5.3 RPC Light-emission Measurement ... 63
5.4 Theoretical Modeling ... 65
5.5 Optimized Configuration and Luminous Uniformity... 68
5.6 Color Temperature ... 69
5.7 Angular Color Deviation ... 72
5.8 Summary ... 74
Chapter 6
Ultra Slim Dual-sided Display System using UV-excited Fluorescent
Lighting (UFL)... 76
6.1 Why Dual-sided Display ... 76
6.2 What UV-excited Flat Lighting (UFL) ... 77
6.3 Experimental Indices Definition ... 78
6.4 Sample Preparation ... 80
6.6 Dual-sided Displays ... 83
6.7 Thermal Releasing Analysis... 86
6.8 Summary ... 89
Chapter 7
Conclusion and Future Works ... 90
7.1 Conclusion... 90
7.1.1 Part I: LED Devices ... 90
7.1.2 Part II: LED Lighting Module... 91
7.1.3 Part III: Dual-sided Display System... 95
7.1.4 Conclusion... 97
7.2 Future Works... 100
References ... 105
Publication List... 114
Journal Papers... 114
International Conference Papers ... 114
US Patents ... 115 Taiwan Patents ... 116 Awards... 117
Curriculum Vitae ... 118
Personal Information ... 118 Education ... 118 Experience... 118L
IST OF
T
ABLES
TABLE 1-1COMPARISON OF DIFFERENT BL SYSTEMS... 10 TABLE 2-1SI PHOTOMETRY UNITS... 18 TABLE 3-1OPTICAL CHARACTERISTICS OF RPC. ... 48 TABLE 4-1.OPTICAL COMPARISON BETWEEN CONVENTIONAL DISPENSING AND CPC BY PSA
. ... 55 TABLE 5-1OPTICAL COMPARISON BETWEEN CONVENTIONAL LIGHTING AND RPC LIGHTING.A,B
... 74 TABLE 6-1THE COMPARISON OF DIFFERENT DUAL-SIDED DISPLAY. ... 84 TABLE 6-2COMPARISON OF MEASURED TEMPERATURE OF CONVENTIONAL SINGLE-SIDED DISPLAY WITH UFLUFL
DUAL-SIDED DISPLAY.A
... 88 TABLE 7-1THE EFFICIENCY PREDICTION OF RPC BACKLIGHTING. ... 104
F
IGURE
C
APTION
FIG.1-1TFT-LCD DISPLAYS ARE BECOMING THE MAIN CHOICE FOR GREAT DIVERSITY NEW APPLICATIONS... 1
FIG.1-2FOURTH GENERATION OF THE FPD INDUSTRY... 2
FIG.1-3THE PROPOSED REMOTE PHOSPHOR CONVERTER (RPC) LIGHTING SYSTEM IN THIS DISSERTATION... 3
FIG.1-4A NEW GROWTH APPLICATIONS OF DUAL-SIDED DISPLAY IN PRIVATE OR PUBLIC SCENES. ... 4
FIG.1-5PHOSPHOR PLACEMENTS IN LED.(A)PROXIMATE PHOSPHOR DISTRIBUTION BY CONVENTIONAL DISPENSING.(B)PROXIMATE CONFORMAL PHOSPHOR DISTRIBUTION.(C)REMOTE PHOSPHOR DISTRIBUTION [39]. ... 5
FIG.1-6SCHEMATIC DIAGRAM OF THE SLURRY COATING PROCESS [44]. ... 6
FIG.1-7CCT VS. VIEWING ANGLE FOR LEDS WITH CONFORMAL PHOSPHOR LAYER SHOWING IMPROVEMENT IN UNIFORMITY COMPARED TO TRADITIONAL WHITE LED[41]. ... 7
FIG.1-8(A)UNIFORM DISTRIBUTION OF THIN LAYER ABOVE LED CHIPS (REMOTE PHOSPHOR).(B)REMOTE PHOSPHOR DISTRIBUTION IN DIFFUSE REFLECTOR [49]. ... 8
FIG.1-9COMPARED WITH TYPICAL WLEDS LIGHTING, REMOTE PHOSPHOR REVEALS HIGHER LIGHT OUTPUT AND EFFICACY [53]. ... 8
FIG.1-10CROSS-SECTIONAL VIEWS OF SEVERAL PCLED PACKAGES.(A) CONFORMAL PHOSPHOR COATING;(B) REMOTE PHOSPHOR WITH SCATTERED PHOTON EXTRACTION;(C) REMOTE PHOSPHOR WITH HEMISPHERICAL DOME; AND (D)ELIXIR[50]. ... 9
FIG.1-11AMBIENT TEMPERATURE DEPENDENCE OF RELATIVE RADIANT EFFICIENCY OF YAG PHOSPHOR AND INGAN BLUE LED[52]. ... 10
FIG.1-12THREE PARTS IN THIS THESIS. ... 11
FIG.1-13THE ORGANIZATION OF THIS INVESTIGATION. ... 13
FIG.2-1WAVELENGTHS OF ELECTROMAGNETIC RADIATION AND LIGHT [2]... 16
FIG.2-2DEFINITION OF RADIOMETRIC AND PHOTOMETRIC QUANTITIES [3]... 17
FIG.2-3EXAMPLE OF A TYPICAL SPECTRAL POWER DISTRIBUTION (SPD)[6]... 18
FIG.2-4EYE SENSITIVITY FUNCTION OF TWO TYPES OF VISION CAN BE DESCRIBED BY PHOTOPIC AND SCOTOPIC RESPONSE CURVES [3]. ... 20
FIG.2-5THE DEFINITION OF SOLID ANGLE [7]... 20
FIG.2-6LAMBERT'S COSINE LAW [7-8]... 22
FIG.2-7LAMBERTIAN SURFACE [7-8]... 22
FIG.2-8BSDFS IS A SUPERSET AND THE GENERALIZATION OF THE BTDFS AND BRDFS [15]... 26
FIG.2-9SCHEMATIC MEASUREMENT SETUP OF BSDFS [13]. ... 26
FIG.2-10PHOTOMETRIC AND GEOMETRIC QUANTITIES IN THE SPHERICAL COORDINATE SYSTEM [16]. ... 27
FIG.2-11FUALL WIDTH AT HALF MAXIMUM (FWHM)[17]. ... 28
FIG.2-12THE CONFIGURATION OF HAZE MEASUREMENT... 30
FIG.2-13THE MEASURED POINT OF LIGHT DISTRIBUTION UNIFORMITY. ... 31
FIG.2-16CIE1931(X,Y) CHROMATICITY DIAGRAM.MONOCHROMATIC COLORS ARE LOCATED ON THE PERIMETER
AND WHITE LIGHT IS LOCATED IN THE CENTER OF THE DIAGRAM [22]. ... 34
FIG.2-17CIE1976(U',V') UNIFORM CHROMATICITY DIAGRAM CALCULATED USING THE CIE1931(2° STANDARD OBSERVER).THE CHROMATICITY DIFFERENCE IS DIRECTLY PROPORTIONAL TO THE GEOMETRIC DISTANCE [22]. ... 35
FIG.2-18COLOR TEMPERATURE CHART OF GENERAL LIGHT SOURCES [23]. ... 37
FIG.2-19PLANCKIAN LOCUS (THICK LINE) AND ISO-TEMPERATURE LINES (FINE LINES)[3]. ... 38
FIG.2-20SPECTRAL PROPERTIES OF THE CCFL LIGHTING VERSUS RGB-LED LIGHTING WHEN MATCHING WITH THE SPECTRAL TRANSMITTANCE FACTOR OF COLOR FILTER [25]... 39
FIG.2-21THE TRIANGLE IS THE GAMUT AVAILABLE TO A TYPICAL COMPUTER MONITOR, IT DOES NOT COVER THE ENTIRE SPACE.THE CORNERS OF THE TRIANGLE ARE THE PRIMARY COLORS FOR THIS GAMUT [30]. ... 40
FIG.2-22THE HIGHER CRI PROVIDES RICHER AND FULLER LOOKING SURFACES, MERCHANDISE AND FOOD [38].. 41
FIG.2-23CIE TEST COLOR SAMPLES USED TO CALCULATE THE GENERAL COLOR RENDERING INDEX (RA)(CIE13.3 -1995)[22]... 42
FIG.2-24CIE TEST COLOR SAMPLES USED TO CALCULATE THE SPECIAL COLOR RENDERING INDICES CRI9-CRI14 [22]. ... 43
FIG.3-1(A)YAG PHOSPHOR POWDER [124].(B)SEM MORPHOLOGY OF YAG:CE3+ PHOSPHOR.(C)THE SIZE DISTRIBUTION OF PHOSPHOR PARTICLES.(D)THE SPECTRAL PROPERTIES OF THE BLUE EXCITATION AND YELLOW EMISSION.(E)BLUE LIGHT EXCITATION. ... 45
FIG.3-2THE SPECTRAL PROPERTIES OF THE PHOSPHOR VERSUS THE SPECTRAL TRANSMITTANCE FACTOR OF CF (PHOSPHOR PHOTO CITED FROM [124]). ... 46
FIG.3-3THE SCHEME OF COATING PROCESS IN THIS RESEARCH... 47
FIG.3-4(A)THE REMOTE PHOSPHOR CONVERTER (RPC);(B) THE COATED PET FILMS WITH TRICHROMATIC PHOSPHOR. ... 48
FIG.3-5VIEWS OF YAG PHOSPHOR FILM.(A)APPEARANCE.(B)SEM MICROGRAPH. ... 48
FIG.3-6THE SCHEME REVEALS THE EFFECTIVE FUNCTION OF BEF AND PCF MATERIALS [67]. ... 49
FIG.3-7MECHANICAL STRUCTURE OF PULSED-SPRAY COATER. ... 50
FIG.3-8SCHEMATICALLY DEPICTS THE SIMPLIFIED PROCESS OF SLOT-DIE COATING. ... 51
FIG.3-9MECHANICAL STRUCTURE OF SLOT-DIE COATER. ... 51
FIG.4-1PHOSPHOR COATING USING PS SCHEME.(A)AN ARRAY OF BLUE LED CHIPS ON BOARD (COB);(B) THE MAGNIFICATION OF INDIVIDUAL LED. ... 53
FIG.4-2CIE1976 CHROMATICITY INDICES VERSUS ANGULAR DISTRIBUTION OF LED WHEN THE LIGHT IS EMITTED AT ANGLES FROM -60° TO +60°.(A)CONVENTIONAL DISPENSING;(B) CONFORMAL COATING USING PS... 54
FIG.4-3RELATIONSHIP BETWEEN PHOSPHOR LOADING (MG/CM2) AND COLOR TEMPERATURE (TC). ... 55
FIG.4-4CIE1931 CHROMATICITY INDICES VERSUS ANGULAR DISTRIBUTION OF LED AT TC CENTRE AROUND 9500 K.(A)CONVENTIONAL DISPENSING;(B) CONFORMAL COATING USING PS. ... 56
FIG.4-5(A)CONOSCOPIC MEASURED POINT AND RANGE FROM +60°~0°~-60°.(B)COLOR TEMPERATURE (TC)-ANGULAR DISTRIBUTION... 56
FIG.4-6THE CIE1931 CHROMATICITY DIAGRAM.RED TRIANGLE DENOTES THE WHITE POINT WITH DIFFERENT COLOR TEMPERATURE (TC). ... 57 FIG.4-7SEM MICROGRAPHS OF PHOSPHOR COATING USING PS.(A)TOP VIEW;(B) CROSS-SECTIONAL VIEW;(C)
ILLUMINATED LIGHTING MODULE WITH PHOSPHOR COATED BY PS. ... 58 FIG.5-1SCHEMATICALLY DEPICTS THE PACKING METHOD OF LED.(A)THE PACKAGE OF DISPENSING PHOSPHOR;
(B)THE PACKAGE OF REMOTE PHOSPHOR... 61 FIG.5-2THE PROPOSED LIGHT-EMISSION SYSTEM CONSTRUCTED BY RPC. ... 61 FIG.5-3THE SEM PICTURE OF THE PLASTIC SUBSTRATE WITH MICRO LINE LENTICULAR (MLL) ARRAYS.(PITCH:
80µM, HEIGHT:80µM). ... 62 FIG.5-4(A)THE LIGHTING MODULE INTEGRATES AN ARRAY OF BLUE LEDS WITH YAGRPC LAYER;(B)THE
OBVERSE VIEW OF RPC COUPLED WITH TWO SHEETS OF MICRO LINE LENTICULAR (MLL) ARRAY (ARROW MARKED THE STRUCTURAL DIRECTION ON MLL)... 63 FIG.5-5MEASURED BTDFS RESULT OF (A) DIFFUSED BLUE LIGHT,(B) UP CONVERTED YELLOW LIGHT;(C)
LIGHT-EMITTING MECHANISM OF RPC LIGHTING SYSTEM; MEASURED BRDFS RESULT OF (D) REFLECTED BLUE LIGHT,(E) DOWN CONVERTED YELLOW LIGHT... 64 FIG.5-6THE COMPARISON OF LUMINANCE IN ANGULAR DISTRIBUTION, BETWEEN CONVENTIONAL LIGHTING AND
RPC LIGHTING. ... 65 FIG.5-7THE DEFINITION OF PHOTOMETRIC IN THIS THEORETICAL CALCULATION. ... 66 FIG.5-8THE COMPARISON OF LUMINOUS UNIFORMITY (UPL) WITH (H/P) RATIO. ... 68
FIG.5-9THE COMPARISON OF LUMINOUS UNIFORMITY (UPL) AT (H)=5 MM AND (P)=12 MM.(A) CONVENTIONAL
WLEDS LIGHTING,(B)RPC LIGHTING INTEGRATED WITH MLL SHEETS. ... 69 FIG.5-10THE CIE1931 CHROMATICITY DIAGRAM.RED CROSS-MARK DENOTES THE WHITE POINT WITH DIFFERENT
COLOR TEMPERATURE (TC). ... 70 FIG.5-11RELATIONSHIP BETWEEN TC AND (A) PHOSPHOR THICKNESS,(B)LED DRIVING CURRENT,(C)LED GAP.
(D)THE RELATIONSHIP OF LUMINOUS FLUX WITH LED GAP... 71 FIG.5-12(A)THE MEASUREMENT OF OPTICAL CHARACTERISTICS BY CONOSCOPIC APPROACH.THE COLOR
DISTRIBUTION OF (B) CONVENTIONAL WLEDS LIGHTING SYSTEM,(C)RPC LIGHTING SYSTEM WHEN VIEW ANGLE VARIES FROM Θ=0° TO Θ=60° AT FIXED φ=0°.(D)THE SPECTRAL PROPERTIES OF BOTH
CONVENTIONAL AND RPC LIGHTING AT VIEW POINT OF Θ=0°,φ=0°.THE SPECTRAL PROPERTIES OF (E)
CONVENTIONAL WLEDS LIGHTING SYSTEM,(F)RPC LIGHTING SYSTEM AT Θ=60°,φ=0°. ... 73 FIG.6-1DUAL-SIDED APPLICATION CONSTRUCTED BY (A)A CONVENTIONAL PAIR OF SINGLE-SIDED DISPLAY
APPLIED BACK-TO-BACK;(B)UFL DUAL-SIDED DISPLAY. ... 77 FIG.6-2SCHEMATIC RELATIONS BETWEEN THE INCLUDED ANGLE (∆) AND LUMINOUS DISTRIBUTION IN THE ENTIRE ILLUMINATION AREA. ... 79 FIG.6-3THE RELATIONSHIP BETWEEN (∆) AND (UPL) ACCORDING TO UFL AND CONVENTIONAL DIRECT-EMISSION
BL SYSTEM. ... 79 FIG.6-4(A)MEASUREMENT CONSTRUCTION OF ANGULAR-LUMINANCE DISTRIBUTION.(B)&(C): RAY TRACING
DISTRIBUTION OF UFL ILLUMINATION. ... 81
FIG.6-5THE LUMINOUS UNIFORMITY SIMULATION RESULT... 82
FIG.6-6THE BL LUMINANCE IN SPATIAL DISTRIBUTION, RAY TRACING AND LUMINOUS UNIFORMITY OF THE EXPERIMENTAL SAMPLES AT ∆=135°,I=6.5 MA.(A),(B) AND (C) REPRESENT CONVENTIONAL DIRECT-EMISSION BL;(D),(E) AND (F) REPRESENT UFLBL. ... 83
FIG.6-7LUMINOUS DISTRIBUTION OF DUAL-SIDED ILLUMINATION (A)FLS LIGHTING;(B)UFL LIGHTING,(C)UFL FRONT VIEW,(D)UFL BACK VIEW... 85
FIG.6-8ULTRA-SLIM DUAL-SIDED BACKLIGHTING MODULE (28.8 MM THICKNESS). ... 86
FIG.6-9THERMAL SIMULATION BY FLOTHERM®. ... 87
FIG.6-10THERMAL DISTRIBUTION MEASUREMENT BY FLOTHERM® REGARDING (A)FLS DUAL-SIDED BL;(B) UFL DUAL-SIDED BL. ... 88
FIG.7-1CONFORMAL COATING TECHNOLOGY COMPARISON. ... 91
FIG.7-2CORRELATIONS BETWEEN LIGHTING MODULE THICKNESS AND LUMINOUS EFFICIENCY IN DIFFERENT PLANAR LIGHTING MODULES. ... 92
FIG.7-7ULTRA-SLIM DUAL-SIDED DISPLAY SYSTEM USING UFL LIGHTING BY RPC SCHEME. ... 95
FIG.7-8INEFFECTIVE APPLICATIONS OF TWO CONVENTIONAL SETS OF SINGLE-SIDED LCDS INSTALLED BACK-TO-BACK. ... 95
FIG.7-9DUAL-SIDED LIGHTING TECHNOLOGY COMPARISON. ... 96
FIG.7-13THE ACCOMPLISHMENT OF OBJECTIVES IN THIS INVESTIGATION. ... 99
FIG.7-14THE APPLICATIONS MEET THE REQUIREMENT OF ASYMMETRY DUAL-SIDED DISPLAY... 100
FIG.7-15THE ENVIRONMENTAL ILLUMINATION AFFECTS THE DEMAND OF DISPLAY LUMINANCE. ... 101
FIG.7-16THE FUTURE WORKS OF RPC SCHEME IN DUAL-SIDED DISPLAY SYSTEM.FROM PICTURE (A) TO (B), IT ILLUSTRATES THE CURRENT ACCOMPLISHMENT; WHEREAS, FROM PICTURE (B) TO (C) TO (D), THESE SUGGEST PROPOSAL OF ASYMMETRY ILLUMINATION AND BLUE LED LIGHT SOURCE IN FUTURE WORKS. ... 101
FIG.7-17TO VERIFY THE COLOR VARIATION OF RPC SCHEME USING TFT-LCD DISPLAY SYSTEM WITH LOCAL DIMMING FUNCTION.(A)SMALL AREA ON PATTERN, AND (B) SMALL AREA DIMMING PATTERN. ... 102
FIG.7-18THE PROPOSAL OF RPC SCHEME ASSOCIATED WITH COLOR FILTER LESS TO INCREASE LUMINANCE EFFICIENCY.(A)CONVENTIONAL TFT-LCD MODULE;(B)PHILIPS PRESENTATION;(C)NCTU PROPOSAL (PARTLY INFORMATION CITED FROM [122])... 103
FIG.7-19EVOLUTION OF LUMINOUS EFFICACY PERFORMANCE OF WHITE LIGHT SOURCES.COMMERCIALLY AVAILABLE HIGH-POWER LED PERFORMANCE IS INDICATED BY THE POINTS ALONG THE SOLID BLUE CURVE. THE U.S.DEPARTMENT OF ENERGY (DOE) PROJECTIONS IS INDICATED BY THE DASHED PURPLE LINE [125]. THE EFFICIENCY PREDICTION OF RPC BACKLIGHTING IN THIS INVESTIGATION IS INDICATED BY BACK DASH LINE... 104
Chapter 1
Introduction
1.1 Preface
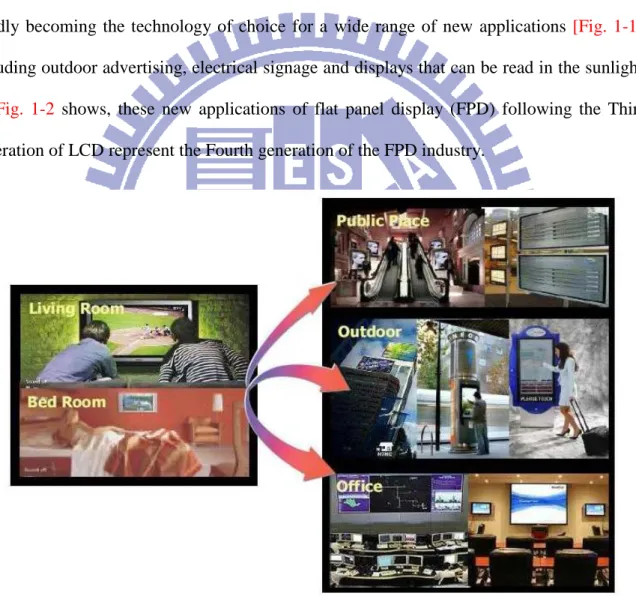
This investigation considers a compact lighting module with a uniform and planar distribution of bright light for use in TFT-LCD backlighting applications. LCD displays are
rapidly becoming the technology of choice for a wide range of new applications [Fig. 1-1],
including outdoor advertising, electrical signage and displays that can be read in the sunlight.
As Fig. 1-2 shows, these new applications of flat panel display (FPD) following the Third
generation of LCD represent the Fourth generation of the FPD industry.
Fig. 1-1 TFT-LCD displays are becoming the main choice for great diversity new applications.
Backlighting requires high brightness, a uniform light distribution and accurate color distribution through the display area. A conventional lighting module that is constructed from
fluorescent tubes or solid-state light emitting diodes (LEDs) as light source converts electrical energy into light, but does not satisfy the optical, color, efficient and mechanical requirements of future displays. This investigation seeks to address this issue by developing a novel optical mechanism of a planar light radiation system from a compact device that satisfies the requirements of display with significantly improved efficiency, uniformity, and thermal characteristics over those of a conventional backlighting system.
Fig. 1-2 Fourth generation of the FPD industry.
In particular, since the development of planar lighting, LEDs are being used more as TFT-LCD backlights or for general lighting. LEDs have the potential to reduce pollution considerably, save energy, save financial resources, and add functions to various applications.
However, point-typed LEDs are difficult to achieve a uniform and planar illumination [1].
This investigation develops a novel lighting system that uses an array of blue LEDs to excite a yellow phosphor remotely, yielding a high luminous efficiency with uniform and planar light emission. Herein, the remote phosphor simultaneously acts as a wavelength converter and a light diffuser. The optical properties of the proposed lighting system, the angular color deviation, the locations of the phosphor and the light-emitting uniformity, are explored. A thin lighting module with high light-emitting uniformity but without a conventional diffuser plate or light guiding plate (LGP) is demonstrated. A low color deviation was achieved.
Accordingly, the proposed lighting system offers superior optical performance using a
compact module [Fig. 1-3].
Blue LED Reflector
Metal Back Cover
Micro Line Lenticular (MLL) Remote phosphor converter (RPC) Thinner Profile (c) Blue LED Reflector
Metal Back Cover
Micro Line Lenticular (MLL) Remote phosphor
converter (RPC)
Thinner Profile (c)
LGP
Upper Diffuser Film BEF Film
Lower Diffuser Film
Reflection Sheet
LED Frame
(b)
LGP
Upper Diffuser Film BEF Film
Lower Diffuser Film
Reflection Sheet
LED Frame
(b)
Reflector Film Metal Back Cover wLED
Upper Diffuser Film BEF Film
Lower Diffuser Film Diffuser Plate (a)
Reflector Film Metal Back Cover wLED
Upper Diffuser Film BEF Film
Lower Diffuser Film Diffuser Plate (a) p h
Direct-emitting
Edge-emitting
Proposed
Blue LED ReflectorMetal Back Cover
Micro Line Lenticular (MLL) Remote phosphor converter (RPC) Thinner Profile (c) Blue LED Reflector
Metal Back Cover
Micro Line Lenticular (MLL) Remote phosphor
converter (RPC)
Thinner Profile (c)
LGP
Upper Diffuser Film BEF Film
Lower Diffuser Film
Reflection Sheet
LED Frame
(b)
LGP
Upper Diffuser Film BEF Film
Lower Diffuser Film
Reflection Sheet
LED Frame
(b)
Reflector Film Metal Back Cover wLED
Upper Diffuser Film BEF Film
Lower Diffuser Film Diffuser Plate (a)
Reflector Film Metal Back Cover wLED
Upper Diffuser Film BEF Film
Lower Diffuser Film Diffuser Plate (a)
p h
Direct-emitting
Edge-emitting
Proposed
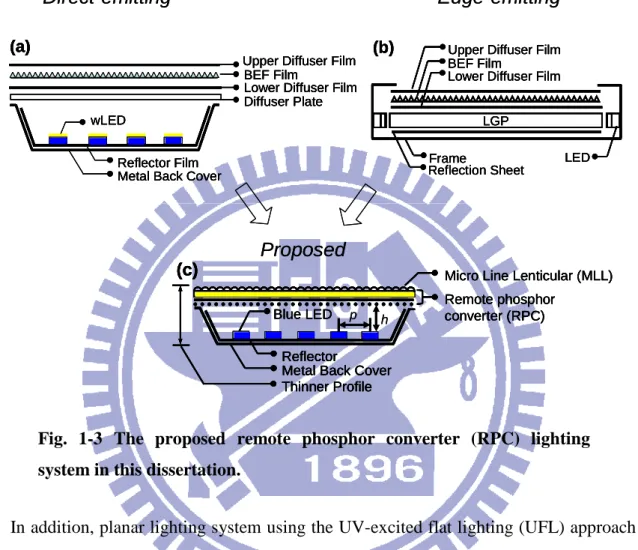
Fig. 1-3 The proposed remote phosphor converter (RPC) lighting system in this dissertation.
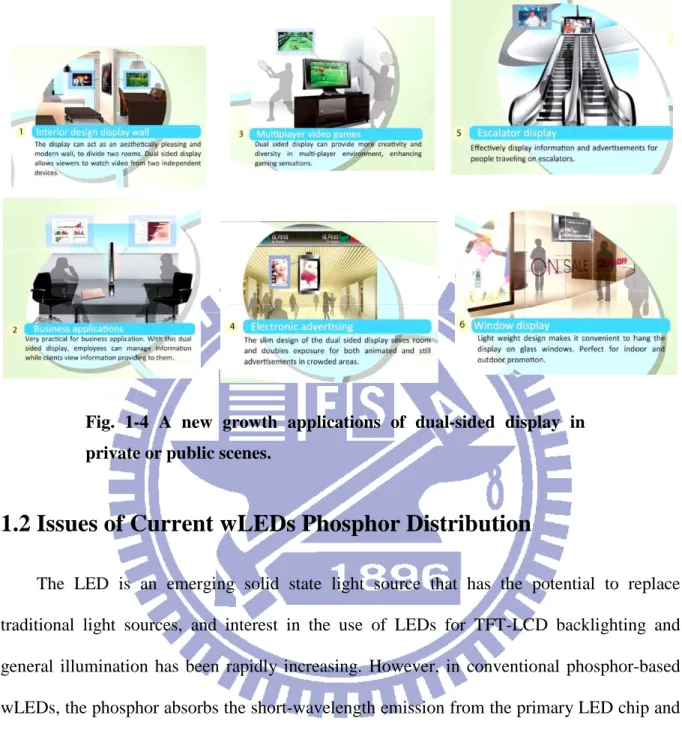
In addition, planar lighting system using the UV-excited flat lighting (UFL) approach is investigated herein. It involves the use of a remote phosphor film to convert the wavelength of ultraviolet light to visible light, and has high brightness as well as planar and uniform illumination. In particular, a compact UFL system with low power consumption that provides symmetrical dual-sided illumination is developed. Since future display applications will be very diverse, including digital signage and public information displays, they cannot all be based on single-sided LCD. These characteristics of the UFL approach motivate new-aged
applications in TFT-LCD backlighting [Fig. 1-4]. For instance, dual-sided displays can add
Fig. 1-4 A new growth applications of dual-sided display in private or public scenes.
1.2 Issues of Current wLEDs Phosphor Distribution
The LED is an emerging solid state light source that has the potential to replace traditional light sources, and interest in the use of LEDs for TFT-LCD backlighting and general illumination has been rapidly increasing. However, in conventional phosphor-based wLEDs, the phosphor absorbs the short-wavelength emission from the primary LED chip and down-converts it to a longer-wavelength emission. For example, the phosphor-based wLED
uses herein a blue GaInN LED that pumped a YAG:Ce3+ yellow phosphor. The phosphor
density and thickness are selected to transmit only a fraction of the blue light. The mixing of yellow phosphorescence with the blue electroluminescence produces white light. The amount, density and distribution of phosphor inside LED packages are varied to optimize the
Fig. 1-5 Phosphor placements in LED. (a) Proximate phosphor distribution by conventional dispensing. (b) Proximate conformal phosphor distribution. (c) Remote phosphor distribution [39].
Since the phosphor is close to the LED die in the wLEDs package, a significant fraction of the blue light is backscattered by the phosphor and then absorbed by the LED chips. Additionally, the high temperature of an operating wLEDs causes thermal quenching, which reduces the light radiation efficiency of the YAG phosphor and the InGaN blue LEDs. Hence, this investigation studies distribution of phosphor in the LED package. When phosphor is
separated from the LED chip surface, it is said to be remotely distribution [Fig. 1-5 (c)], but
when the phosphor is close to the LED chip surface, it said to be proximately distribution [Fig.
1-5 (a) & (b)].
1.2.1 Conformal Phosphor Coating
The placement and arrangement of phosphors are critical for both the luminous source efficiency and color rendering index of the wLEDs. Typical arrangements of phosphor in
wLEDs are shown in Fig. 1-5. The conventional wLEDs are fabricated by dispensing the
view angles. Figure 1-5(b) shows another phosphor distribution, in which the phosphor layer
conformally coats the LED chip [40- 48]. In this case, the color variation at different viewing
angles is reduced dramatically due to the thickness uniformity of the phosphor layer, which provides the blue emission with an equal optical path length in the phosphor material, independent of the emission direction.
In order to coat the yellow phosphor on a GaInN chip conformally, several methods such as slurry, settling and electrophoretic deposition can be available, and the slurry coating
scheme is most often employed for reasons of coating efficiency and uniformity [Fig. 1-6].
The slurry method is widely used for manufacturing luminescent phosphor screens of color cathode ray tubes (CRTs). It is based on a phosphor suspension in a water-soluble photoresist, dichromated polyvinyl alcohol (PVA), or other photosensitive emulsions. When phosphor slurry was under exposure, photochemical reactions occur and result in cross-linking in the
photoresist. Then the slurry was developed with water to obtain the patterns required [44].
Conventional Conformal Conventional
Conformal
Fig. 1-7 CCT vs. viewing angle for LEDs with conformal phosphor layer showing improvement in uniformity compared to traditional white LED [41].
The uniformity of conformal phosphor layer results in higher color uniformity of the LEDs when compared with the conventional dispensing method. A comparison of CCT as a
function of viewing angle is shown in [Fig. 1-7].
For both dispensing and conformal phosphor distributions, phosphors are closely distributed around the LED chip. Because the phosphorescence emission is isotropic, a large portion of the light emitted from phosphor directly impinges on the LED chip. The contacts and bonding metals of the LED chip are absorptive at the phosphorescence wavelength.
1.2.2 Remote Phosphor Coating
Placing the phosphor layer at a sufficiently large distance from the LED chip, as shown
in [Fig. 1-5(c)], reduces the probability of the phosphorescence directly hitting the chip. The
phosphor forms a uniform layer on the top of the reflector cup, which we refer to as remote phosphor. The thickness of the remote phosphor can be well controlled, which results in
varying color temperature [49- 62]. In addition, the separation of phosphor from the LED chip
(a)
(b) (a)
(b)
Fig. 1-8 (a) Uniform distribution of thin layer above LED chips (remote phosphor). (b) Remote phosphor distribution in diffuse reflector [49].
Fig. 1-9 Compared with typical wLEDs lighting, remote phosphor reveals higher light output and efficacy [53].
Figure 1-8 shows a remote phosphor configuration, in which phosphor layer of uniform
thickness is distributed over the reflector cup. However, there is still a large probability of lights being reflected by the reflector cup and being re-absorbed by the LED chip, as shown by Ray 1 and Ray 3. This is due to the specular surface of the reflector cup and its particular
geometry which can result in trapped optical modes. J. K. Kim et al. [49] announced strongly
diffused reflector cup. The improvement of light extraction efficiency by using the remote phosphor arrangement and a diffused reflector cup is 15.4% improvement in experiments.
Fig. 1-10 Cross-sectional views of several pcLED packages. (a) conformal phosphor coating; (b) remote phosphor with scattered photon extraction; (c) remote phosphor with hemispherical dome; and (d) ELiXIR [50].
In addition, N. Narendran stated extracting phosphor-scattered photons to improve white
LED efficiency [53]. The result illustrates the 61% more light output and efficacy of remote
phosphor [Fig. 1-9]. S. C. Allen and A. J. Steckl indicated the configuration [Fig. 1-10(a)] is
least efficient because the phosphor directs 60% of total white light emission (consisting of
reflected blue and emitted yellow) back toward the chip, where high loss occurs [50]. A
remote phosphor LED [Fig. 1-10(b)] was shown more efficient than the LED [Fig. 1-10(a)]
because of the separation of the die and extraction of backward-emitted rays from the sides of the optic. Significant losses still occur inside the phosphor layer due to ray trapping by total
internal reflection (TIR). The LED configuration of [Fig. 1-10(c)] introduced by Luo et al.
uses a remote phosphor, diffused reflector cup, and hemispherical optic to minimize trapped
light. The enhanced light extraction by internal reflection (ELiXIR) LED [Fig. 1-10(d)]
utilizes a remote phosphor with a hemispherical dome that is separated from the chip by an air gap. Internal reflection at the phosphor/air interface redirects much of the backward phosphor
Furthermore, Y. Ito et al. announced that all phosphors have thermal quenching
characteristic [52]. Figure 1-11 shows the temperature dependence of the relative radiant
efficiency of YAG phosphor as an example. An increase in temperature from 25 °C to 100 °C results in a 20% decrease in radiant efficiency. The phosphor remotely is almost at ambient temperature because it does not contact with the LED chips.
︴
︴
︴
︴
︴
︴
︴
︴
︴
︴
︴
︴
︴
︴
︴
︴
︴
︴
︴
︴
︴
︴
︴
︴
︴
︴
︴
︴
︴
︴
︴
︴
︴
︴
︴
︴
︴
︴
︴
︴
︴
︴
︴
︴
︴
︴
︴
︴
Fig. 1-11 Ambient temperature dependence of relative radiant efficiency of YAG phosphor and InGaN blue LED [52].
Table 1-1 Comparison of different BL systems.
BL Type Direct-view BL Edge-view BL SONY BL
Light Source CCFL White LED Blue LED
Large Configuration ◇◇◇◇ ▽▽▽▽ ○○○○ Slim Configuration ▽▽▽▽ ○○○○
--Color Saturation ○○○○ ▽▽▽▽ ◇◇◇◇ Luminous Efficiency ○○○○ ▽▽▽▽
--Thermal Releasing ○○○○ ▽▽▽▽ ○○○○ ○ ○ ○
1.3 Motivation and Objectives
Conventional planar lighting herein has been developed by exploiting direct-emission
using a diffuser plate [Fig. 1-3(a)] or edge-emission using a light guide plate (LGP) [Fig.
1-3(b)] [63- 66]. Direct-emission yields high luminous efficiency in lighting systems, while
edge-emission is more suitable for the application of thin module configurations. These approaches cannot easily support high luminous efficiency and a thin lighting module simultaneously. Device Lighting Module Display System Phosphor White LED Blue LED T h in n e r
High luminous efficiency
Visible CCFL Lamp T h in n e r UV Lamp UFL Tech niqu e UFL Tech niqu e Rem ote Phos phor Rem ote Phos phor Conf orm al Phos phor Conf orm al Phos phor White Light
Reflector Blue LED
Device Device Lighting Module Lighting Module Display System Display System Phosphor Phosphor White LED White LED Blue LED T h in n e r
High luminous efficiency
Blue LED T h in n e r
High luminous efficiency
Visible CCFL Lamp Visible CCFL Lamp T h in n e r UV Lamp T h in n e r UV Lamp UFL Tech niqu e UFL Tech niqu e Rem ote Phos phor Rem ote Phos phor Conf orm al Phos phor Conf orm al Phos phor White Light
Reflector Blue LED White Light
Reflector Blue LED
Fig. 1-12 Three parts in this thesis.
A direct-emission BL system, i.e. capable of satisfying a high power efficiency and high color saturation requirement by mixing the emitted R, G and B lights, and an edge-emission
compares the optomechanical features of the above-mentioned BL systems in large sized backlight applications.
A direct-emission BL in contrast with edge-emission BL is especially favorable for large TFT-LCD applications because of its high power efficiency and high luminance. The conventional configuration of a direct-emission BL set generally consists of a metal holder with plural light sources, e.g., CCFL and LED, inside and a diffuser plate above the light source to effectively suppress the non-uniform luminance distribution. The direct-emission
BL design [Fig. 1-3(a)] with either a CCFL or an LED light source, does not have a slim
configuration. In contrast, edge-emission BL [Fig. 1-3(b)] has thin BL outline, but the issues
of inadequate color saturation of the LED light source, LED color binning and the thermal
effect must be solved before commercialization is possible [94-102].
In 2008, SONY Corporation announced a novel remote phosphor converter (RPC) method, which has been used in wLEDs packages, and related studies have focused on
increasing luminous efficiency [53-57]. Using an array of blue LED light sources, Y. Ito et al.
generated a planar white light for BL applications by exciting a yellow remote phosphor film. Because of the difference between luminance-angular distribution of blue light and excited yellow light, color deviations are easily observed as the viewing angle varies from a normal to
a large viewing angle [52].
In this investigation, a novel planar lighting system that is utilized in display applications is selected. It has a planar and uniform luminous distribution, slim configuration, high luminance, high color saturation, long lifetime and fast manufacturing process, making it effective for future use in a wide range of display applications, including digital signage and public information displays, which cannot all be based on current backlighting schemes. As
shown in Fig. 1-12, this thesis has three parts and evaluates small devices, middle-scale
on color distribution in high-quality lighting applications. A study of lighting modules is conducted with a view to achieving high luminous efficiency, uniform luminous distribution and low color deviation. Accordingly, a novel display system is constructed for a wide range of display applications.
1.4 Organization of This Thesis
Figure 1-13 presents the organization of this investigation; it comprises three parts
covering devices, lighting modules and display systems. First, the chapter 1 includes a preface and considers current issues, as well as the motivation for, and the goals of this work. Chapter 2 elucidates the theoretical background, including the use of photometry and colorimetry to evaluate a lighting system. Ray tracing and bidirectional scattering distribution functions (BSDFs) are utilized to develop a model for optical simulation. The proposed planar lighting system is compared with conventional lighting system. Glare, haze, Moiré and full width at half maximum (FWHM) are introduced and used in the optical evaluation.
Ch 4
Ch 6
Ch 5 •254 nm UV light source
•R/G/B phosphor •Slot die coating •Dual-sided display •High NTSC •High brightness •Low power consumption •Thinner profile
•Light weight
•457 nm blue light source •YAG phosphor
•Pulsed-spray coating • High CRI
•Low color deviation •No chemical pollution
•457 nm blue light source •YAG phosphor
•Slot die coating •High Tc •High efficiency •Low color deviation •Thinner profile Ch 4 Ch 6 Ch 5 •254 nm UV light source •R/G/B phosphor •Slot die coating •Dual-sided display •High NTSC •High brightness •Low power consumption •Thinner profile
•Light weight
•457 nm blue light source •YAG phosphor
•Pulsed-spray coating • High CRI
•Low color deviation •No chemical pollution
•457 nm blue light source •YAG phosphor
•Slot die coating •High Tc •High efficiency •Low color deviation •Thinner profile
Fig. 1-13 The organization of this investigation.
research. It describes the phosphor, the preparation of the remote phosphor film and related processes. Chapters 4 to 6 present the main developments of this research.
Chapter 4: low color deviation LED device, the distribution of phosphor by the pulse spraying of a conformal coating is discussed in this paragraph. This method differs from conventional dispensing method, settling method, spin coating, self-exposure or electrophoretic deposition (EPD). The proposed pulsed spray process in this investigation involves the application of phosphor by exploiting mechanical principles without risk of chemical pollution. Furthermore, it can be applied to wire-bonded LEDs and an array of LED chips on a substrate to fabricate a large-area, planar illumination system of high optical quality, which is easy to manufacture.
Chapter 5: high luminous efficiency LEDs lighting, the research regarding planar lighting in which an array of blue LEDs is utilized to excite a yellow remote phosphor film is presented. The proposed optics configuration can provide little angular color deviation and uniform luminous distribution using an ultra-slim structure for TFT-LCD backlighting applications. Most importantly, the configuration does not exploit a conventional diffuser plate or a light guide plate. Accordingly, an RP lighting system with strong optical performance in a compact module can be realized.
Chapter 6: ultra slim display system, a particular optical characteristic of UFL lighting is elucidated. Its symmetrical illumination satisfies the requirements of dual-sided LCD application. Additionally, UFL lighting exploits a thermal radiation mechanism to release the large amount of heat that is produced upon illumination, preventing thermal accumulation over the long term, when used in displays. These characteristics of UFL have motivated a wide range of lighting applications of digital signage and public informational displays.
Remote phosphor provides high optical performance and has a compact mechanical configuration. Future work will study the combined realization of low color deviation and high power efficiency. Therefore, the asymmetric illumination of two sides of dual-sided display will be studied. Furthermore, reduction of the dependency of color filters on the remote phosphor scheme will be increasingly important in combing high luminance with low power consumption. In conclusion, any innovative lighting system that is developed in the future should provide high color saturation (100% NTSC) for backlighting and high color rendering (100% CRI) for general lighting applications.
Chapter 2
Theoretical Backgrounds
The theoretical background regarding this research will be reviewed in this chapter. First of all, the use of photometry and colorimetry to evaluate a lighting system will be introduced. Then, ray tracing and bidirectional scattering distribution functions (BSDFs) are used to develop a model for optical simulation. Moreover, comparing the conventional lighting systems with the proposed planar lighting system is investigated. The measurement of glare, haze, moiré and full width at half maximum (FWHM) are introduced to support in optical evaluation. In addition, color rendering (NTSC), color saturation (CRI), color index, color temperature (Tc) and color deviation (∆u′v′) are introduced to support in color analysis too.
Fig. 2-1 Wavelengths of electromagnetic radiation and light [2].
2.1 Radiometry and Photometry
Radiometry deals with radiant energy (i.e., electromagnetic radiation) of any wavelength. The wavelength field includes the Ultra-Violt (UV), Visible Light and Infra-Red (IR). Generally, radiometry explore the characteristics of electromagnetic wavelength in the range
from 10 nm to 106 nm [Fig. 2-1] Two out of many typical units encountered are radiant
scale of measured energy is not too large, the units are expressed by mJ and mW (m represent
the value of 1×10⁻³) customarily.
Photometry is the measurement of visible light based on the response of the average
human observer.The visible spectrum covers the wavelengths from approximately 390 to 800
nm. Photometry is like radiometry except that everything is weighted by the spectral response of the eye. Visual photometry uses the eye as a comparison detector, while physical photometry uses either optical radiation detectors constructed to mimic the spectral response of the eye, or spectroradiometry coupled with appropriate calculations to do the eye response
weighting. Figure 2-2 shows the definition of typical photometric units and Table 2-1
expresses the quantities in lumen (lm), lux (lx), and candela (cd).
The only real difference between radiometry and photometry is that radiometry includes the entire optical radiation spectrum, while photometry is limited to the visible spectrum as
defined by the response of the eye [2-5].
Table 2-1 SI photometry units.
Quantity Symbol SI unit Abbr.
Luminous flux Φv lumen lm
Luminous intensity Iv Candela (lm/sr) cd
Luminance Lv
candela per square meter
(lm/s
r
.m2 or cd/m2) nitsIlluminance Ev Lux (lm/m2) lx
Luminous exitance Mv lm/m2
Luminous efficacy lumen per watt (lm/W)
Fig. 2-3 Example of a typical spectral power distribution (SPD) [6].
2.1.1 Spectral Power Distribution
Incandescent, fluorescent, and high-intensity discharge (HID) lamps radiate across the visible spectrum, but with varying intensity in the different wavelengths. The spectral power distribution (SPD) for a given light source shows the relative radiant power emitted by the light source at each wavelength. Incandescent sources have a continuous SPD, but relative
power is low in the blue and green regions. The typically "warm" color appearance of incandescent lamps is due to the relatively high emissions in the orange and red regions of the
spectrum as Fig. 2-3 shown.
2.1.2 Eye Sensitivity Functions
The eye sensitivity functions or the luminosity functions or the luminous efficiency functions describe the different visual spectral efficiency of human eye to different wavelength of visible light. There are two kinds of eye sensitivity functions in common usage
[Fig. 2-4]. For bright day-light level, the photopic luminosity function approximates the
response of the human eye. For dark night-light level, the response of the human eye changes and the scotopic curve applies. Radiometric quantities can be converted into photometric
quantities and vice versa by the equation (photometric quantity, Fl(λ)) = K(λ) × (radiometric
quantity, Fr(λ)). The equations can be written explicitly as
λ λ λ λ) K F 683 SPD( )V( )d ( Fl = m⋅ r = ⋅
∫
⋅ (2.1.1) λ λ λ λ) K F 1700 SPD( )V( )d ( F r ' ' m ' l = ⋅ = ⋅∫
⋅ (2.1.2)where Fl(λ), Fl'(λ) represents the quantity of day-light and night-light luminous efficacies, Km,
Km' represents the maximum luminous efficacies and V(λ), V'(λ) represents the standard
luminosity function, SPD(λ) is the spectral power distribution of the radiation and λ is wavelength in metric unit.
The standard day-light luminosity function is normalized to a peak value of unity at 555 nm and the maximum luminous efficacy of radiation for photopic vision is 683 lm/W. Comparatively, the standard night-light luminosity function is normalized to a peak value of unity at 507 nm and the maximum luminous efficacy of radiation for photopic vision is 1700
(CIE) and may be used to convert radiant energy into luminous (i.e., visible) energy in 1983. For all of the optics measurement equipments, the characteristics of optical detector should make calibration follow the curve of luminous efficiency functions rules by CIE standard to meet the actual eye sensitivity of human eye.
Fig. 2-4 Eye sensitivity function of two types of vision can be described by photopic and scotopic response curves [3].
2.1.3 Solid Angle
A solid angle is used in photometry to measure the portion of a sphere bounded by some
irregular surface [Fig. 2-5]. The sphere is defined by the vertex (the center of a luminous body)
and the center of the surface (an aperture). An entire sphere has a solid angle of 4π steradians (sr).
2.1.4 Luminous Intensity
Luminous intensity is the perceived power per unit solid angle. Luminous intensity is a measure of the wavelength weighted power emitted by a light source in a particular direction per unit solid angle, based on the spectral luminous efficiency curve of the human eye sensitivity. The SI unit of luminous intensity is the candela (cd). The concept of luminous intensity requires the assumption of a point source, or at least a source small enough for its dimensions to be negligible compared to the distance between light source and detector and, in principle at least, there is also a requirement that the measurement should be made over a very small element of solid angle.
2.1.5 Luminous Flux
In photometry, luminous flux or luminous power is the measure of the perceived power of light. It differs from radiant flux, the measure of the total power of light emitted, in that luminous flux is adjusted to reflect the varying sensitivity of the human eye to different wavelengths of light.
The SI unit of luminous flux is the lumen (lm). One lumen is defined as the luminous flux of light produced by a light source that emits one candela of luminous intensity over a solid angle of one steradian (sr).
2.1.6 Luminance
Luminance is used for measuring the brightness of a light source on a surface. It's defined by the luminous flux emitted from a surface per unit solid angle per unit area of the source where the area is calculated by projecting it onto a plane normal to the direction of propagation. Luminance is invariant under transformation by a lens and also gives the same results when measured at any distance from the source.
2.1.7 Illuminance
Illuminance is the luminance flux incident on a surface from all directions. The luminous flux comes from one or several sources. What happens to the light at the surface (where if it is reflected or absorbed) does not matter. Illuminance is measured with a detector placed on the surface pointing toward the light source.
2.1.8 Lambert's Cosine Law and Lambertian Surface
A surface that diffuses light perfectly produces luminous intensity (IV) in all directions
that obeys Lambert's Cosine Law [Fig. 2-6 & Eq. 2.1.3], where the intensity (IV) varies as the
cosine of the angle between normal and the direction of the intensity measurement. The
direction of the light incident on the surface has no effect on the luminous intensity (IV)
pattern.
θ
θ
I
cos
I
=
normal (2.1.3)Fig. 2-6 Lambert's Cosine Law [7-8].
However, the luminance (LV) of the surface does not obey Lambert's Cosine Law and it
is constant when viewed from any angle. Lambertian surface is a perfectly diffuse surface
[Fig. 2-7 & Eq. 2.1.4]. This is because projected area viewed through the luminance aperture
varies as the cosine of the angle between the normal and the luminance measurement angle, thus offsetting the cosine effect of the luminous intensity.
normal normal normal normal normal normal normal normal A I cos A cos I cos A I L , A I L = θ = θ
θ
=θ
θ
= normalL
L
θ=
(2.1.4)2.2 Ray Tracing
Ray-tracing is a method based on Snell’s law, Fresnel's equation, and other optical principles. Through electromagnetic theory, light is a wave varies electric and magnetic fields to comply with time. The light takes a spherical form when radiated from a point, and then behaves like plane waves when propagating. The path of a hypothetical point on the wave front of light is called a ray. Such a ray is an extremely convenient fiction for the ray-tracing. It provides a way to discuss the behavior of light and analyze the optics of lighting systems.
Several optical software, such as LightToolsTM, OSLOTM, et al., can support the ray-tracing
function to build optical module for a simulated environment.
2.2.1 Law of Refraction (Snell's Law)
Snell's law, a law of refraction, defines the refraction of light in the plane of incidence.
Snell's law describes the ratio of the incidence angle (θi) by the refraction angle (θt) equals to
a constant which depends on the opposite ratio of the refractive indices of two optical media as: t i n n sin sin = θ θ (2.2.1)
where ni and nt denote the refractive indices of the incident and transmitted medium,
respectively [9].
2.2.2 Law of Reflection
In the incident plane, the behavior of rays prompted by reflection is defined as the law of reflection:
r i
θ
θ
= (2.2.2)where θi and θr denote the incident angle and reflected angle, respectively. For specular
reflection, the angle at which the wave is incident on the surface equals to the angle at which
it is reflected [10-11].
2.2.3 Fresnel's Equations
Fresnel's equations describe the energy of transmitted and reflected light at an interface
between two different optical media. For defining the polarization waves of P (parallel to the
plane of incidence) and S (perpendicular to the plane of incidence), the amplitude of reflection
and transmission coefficients, r and t, are respectively given by:
t t i i t t i i S cos n cos n cos n -cos n r θ θθ + θ = , t t i i i i S cos n cos n cos 2n t θ θ + θ = (2.2.3) i t t i t i i t P cos n cos n cos n -cos n r θ θθ + θ = , i t t i i i P cos n cos n cos 2n t θ θ + θ = (2.2.4)
where ni and nt denote the refractive indices of the incident and transmitted medium; θi and θt
denote the angle of incidence and propagation, respectively.
According to the irradiance, the reflectance and the transmittance for polarized light are defined as: 2 S S r R = , TS=1-RS (2.2.5) 2 r R = , T =1-R (2.2.6)
where Rs and Rp denote the reflectance, and Ts and Tp denote the transmittance of S-polarized
and P-polarized light, respectively. When a nature light strikes onto a medium, the reflectance
(R) and transmittance (T) are defined as the average of the polarized lights as following equations: 2 R R R= S+ P , 2 T T T= S+ P (2.2.7)
Base on laws of reflection and refraction, the ray-tracing method could analyze the
optical behavior of propagated, reflected, and refracted lights. Furthermore, using Fresnel’s
equations, the energy of reflected and transmitted light at an interface separating two media could be calculated. Accordingly, the energy of a particular light on the defined receiver could
be obtained. Commercial software, LightToolsTM, is adequate for development of simulated
model to optimize the optical performances of the backlight systems [12].
2.3 Bidirectional scattering distribution functions (BSDFs)
Basing on radiometry and photometry, the bidirectional transmittance and reflectance
distribution functions (BTDFs and BRDFs) are developed to describe light distributions [Fig.
2-8]. BSDFs is a superset and the generalization of the BRDFs and BTDFs. The BTDFs
describes the transmitted characteristic of a sample, while the BRDFs indicate the reflective
characteristic of a sample. The schematic setup of BSDFs measurement is shown in Fig. 2-9.
In this thesis, the corresponded BTDFs and BRDFs were adopted to describe the phosphor film's light distribution characteristics which combine diffusing with wavelength conversion mechanism.
Fig. 2-8 BSDFs is a superset and the generalization of the BTDFs and BRDFs [15].
Fig. 2-9 Schematic measurement setup of BSDFs [13].
The defining geometry of BTDFs and BRDFs is shown in Fig. 2-10, where the subscripts
i, t, and r denote the quantities of incident, reflective and transmitted rays;
θ
andφ
denote the zenith and azimuthal angles in spherical coordinate; and (Ω,ω) denote the solid angle,respectively. If an incident ray with luminous flux (Φv,i) and solid angle (ωi) illuminating on
the point P located on the sample plane, the transmitted and reflected rays scattered from the
t i v,i t t t v, i i i v,i t t t t v, t i t t i i cos ) ( )/d ( d ) , , ( E ) , , ( L ) , , , , , BTDF(
θ
ω
ω
ω
φ
θ
ω
φ
θ
ω
ω
φ
θ
φ
θ
⋅ Φ Ω Φ = = (2.3.1) r i i v, r r r v, i i i i v, r r r r v, r i r r i i cos ) ( )/d ( d ) , , ( E ) , , ( L ) , , , , , BRDF(θ
ω
ω
ω
φ
θ
ω
φ
θ
ω
ω
φ
θ
φ
θ
⋅ Φ Ω Φ = = (2.3.2)where Ev,i is the illuminance on the sample plane due to incident light, and Lv,r and Lv,t are the
luminance of transmitted and reflective ray at the specific angles, respectively.
point P point P
Fig. 2-10 Photometric and geometric quantities in the spherical coordinate system [16].
Besides, the terms of dΦv,t(ωt)/Φv,i(ωi) and dΦv.r(ωr)/Φv,i(ωi) in BTDFs and BRDFs,
which could be obtained by measuring illuminance of incident ray, and luminance of the transmitted and reflective ray. Moreover, the light distribution of conventional diffuser films and phosphor films could be generated, and then be utilized by optical designers, manufacturers, and users to communicate and check requirements.
In this thesis, the BTDFs and BRDFs of phosphor films are measured by a conoscopic system operating under trasnmissive and reflective mode. The measured BTDFs and BRDFs
were then imported into commercial optical software, LightToolsTM, to develop the simulation models that could describe the light distribution characteristics of phosphor films.
Thus, the optimization of lighting systems could be researched [14- 16].
2.4 Light and Vision
Light is radiation in the form of electromagnetic waves that make vision possible to the human eye. In this section, the full-width at half-maximum (FWHM) is defined to describe the light distribution. A high luminance associated with a broader angle of FWHM, yields benefits for large scale display applications. In addition, the vision of light reflecting (Glare), light scattering (Haze) and Mura, are introduced hereby for the evaluation of light distribution and definition of lighting performance.
f(x) fmax ½××××fmax FWHM x1 x2 x f(x) fmax ½××××fmax FWHM x1 x2 x
Fig. 2-11 Fuall width at half maximum (FWHM) [17].
2.4.1 Full-width at half-maximum (FWHM)
A full width at half maximum (FWHM) is an expression of the extent of a function, given by the difference between two extreme values of the independent variable at which the
dependent variable is equal to half of its maximum value [Fig. 2-11].
FWHM is applied to such phenomena as the duration of pulse waveforms and the spectral width of sources used for optical communications and the resolution of spectrometers
![Fig. 1-7 CCT vs. viewing angle for LEDs with conformal phosphor layer showing improvement in uniformity compared to traditional white LED [41]](https://thumb-ap.123doks.com/thumbv2/9libinfo/8110447.165522/24.892.99.798.102.856/viewing-conformal-phosphor-showing-improvement-uniformity-compared-traditional.webp)
![Fig. 1-9 Compared with typical wLEDs lighting, remote phosphor reveals higher light output and efficacy [53]](https://thumb-ap.123doks.com/thumbv2/9libinfo/8110447.165522/25.892.152.750.356.848/compared-typical-lighting-remote-phosphor-reveals-higher-efficacy.webp)
![Fig. 1-11 Ambient temperature dependence of relative radiant efficiency of YAG phosphor and InGaN blue LED [52]](https://thumb-ap.123doks.com/thumbv2/9libinfo/8110447.165522/27.892.153.748.335.1073/ambient-temperature-dependence-relative-radiant-efficiency-phosphor-ingan.webp)
![Fig. 2-4 Eye sensitivity function of two types of vision can be described by photopic and scotopic response curves [3]](https://thumb-ap.123doks.com/thumbv2/9libinfo/8110447.165522/37.892.110.710.287.765/sensitivity-function-vision-described-photopic-scotopic-response-curves.webp)
![Fig. 2-10 Photometric and geometric quantities in the spherical coordinate system [16]](https://thumb-ap.123doks.com/thumbv2/9libinfo/8110447.165522/44.892.210.684.355.833/fig-photometric-and-geometric-quantities-spherical-coordinate-system.webp)
![Fig. 2-22 The higher CRI provides richer and fuller looking surfaces, merchandise and food [38]](https://thumb-ap.123doks.com/thumbv2/9libinfo/8110447.165522/58.892.109.787.198.794/fig-higher-provides-richer-fuller-looking-surfaces-merchandise.webp)
![Fig. 2-23 CIE test color samples used to calculate the general color rendering index (Ra) (CIE 13.3 -1995) [22]](https://thumb-ap.123doks.com/thumbv2/9libinfo/8110447.165522/59.892.151.700.365.842/fig-color-samples-calculate-general-color-rendering-index.webp)
