Detection and Recovery for Intermittent Disconnections
in Tmote Sky Sensor Networks
Chieh-Wen Chen Kuo-Feng Ssu
Institute of Computer and Communication Engineering Department of Electrical Engineering
National Cheng Kung University Tainan, Taiwan
Abstract-Tmote Sky sensors provide programmable and adjustable output power for transmission. Users can control needed transmission power for each
sen-sor. However, the transmission range for a fixed
power changes inconsistently due to the interferences, such as obstacles and other wireless signals. There-fore, the communication between sensors is
discon-nected sometimes. To solve the problem, this
pa-per demonstrates the implementation of three recov-ery schemes. As Tmote Sky sensors detect communi-cation disconnection, sensors will increase their trans-mission power for a certain of time, ask backup nodes for help, or broadcast control messages for coopera-tion. Practical experimental results reveal the amount of lost packets can be reduced with a little additional energy.
Keywords: Wireless Sensor Networks, Tmote Sky, Network Disconnections, Energy Consumption.
1. Introduction
Wireless sensor networks are composed of sensor nodes that perform data gathering and/or event moni-toring with wireless communication. Recently, sensor networks provide applications such as earthquake re-port, mudflows and landslides detection, and marine mammals tracking [1, 2]. A wireless sensor module is typically tiny so the size of its battery is limited. More-over, it is not practical to replace batteries in some con-ditions, such as in the deep ocean or disaster scene.
Therefore, how to reduce energy consumption and in-crease network lifetime for a wireless sensor network becomes a critical issue [3, 4]. Some researches thus suggested that the sensors do not have to use the max-imum transmission power [5, 6]. Instead, the sensors may adjust the needed transmission ranges to their des-ignated one-hop neighbors.
This paper examines the communication perfor-mance and energy consumption on Tmote Sky sen-sors [7]. Tmote Sky is a wireless module designed by the University of California, Berkeley. Tmote Sky is compiled with the TinyOS operating system [8, 9]. Tmote Sky features the Chipcon CC2420 radio for wireless communications. The CC2420 has pro-grammable output power [10]. Users can change the transmission power at both compile time and run time. The output power values are ranged from -25dBm to 0dBm [7]. As shown in Table 1 [7], reducing the out-put power level saves energy consumption for Tmote Sky.
2. Observation: Intermittent Disconnections Tmote Sky modules were used for constructing a wireless sensor network. During the implementation, however, an interesting result was found. The mod-ules set the lower transmission power for saving en-ergy. When one sensor sent data to another, some packets could not be delivered correctly. By observ-ing the received packets usobserv-ing Moteiv Trawler (a dis-play program designed for Tmote Sky), we noticed that
Table 1. Current and Power Consumption in Tmote Sky (with Operating Voltage 2.1 V)
Output Power (dBm) Current Consumption (mA) Power Consumption (mW) 0 17.4 36.54 -1 16.5 34.65 -3 15.2 31.92 -5 13.9 29.19 -7 12.5 26.25 -10 11.2 23.52 -15 9.9 20.79 -25 8.5 17.85 a b c Base station
Figure 1. Tmote Sky deployment.
Table 2. Environment Setup Experimental parameters
Output power -25dBm
Packet transmitted Every5 seconds
One round tested time 3600 seconds (1 hour)
Total testedtime 5 rounds (5 hours)
Totaltested packet 3600 packets
the two sensors could not connect each other intermit-tently and the disconnection continued for a period of time. To study the communication disconnections in Tmote Sky, more experiments were conducted.
The Tmote Sky sensors were deployed as Figure 1. In order to observe the received packets, a base station was installed as a Tmote Sky sensor plugged with a notebook. Sensor c sent packets through path c-b-a to the base station periodically. Sensors b and a played the role of relays and helped to transmit packets hop-by-hop. The environmental parameters are listed in Table 2.
Figure 2 illustrates the number of lost packets for five rounds (five hours). The lost packets were recorded as continuous if the base station did not re-ceive any packet within ten seconds; the other lost packets were non-continuous. Due to the inconsistent radio signal interface, the results were varied for each round. The continuous lost packets occupied 58.4% of
Nu m be r o f los t pa ck ets 0 100 200 300 400 500 600 1 2 3 4 5 Total Round Continuous Non-continuous
Figure 2. Number of lost packets. Table 3. Distribution of Lost Packets
Numberof
continuous loss Number of times
Number of lost packets (non-continuous) 1 202 202 2 13 26 3 7 21 5 9 45 10 4 40 16 1 16 30 1 30 105 1 105
Figure 3. Base station constructed its back-bone for communication.
total lost packets. This was called Intermittent Discon-nection. Table 3 shows the distribution of continuous lost packets for all five rounds.
3. System Model
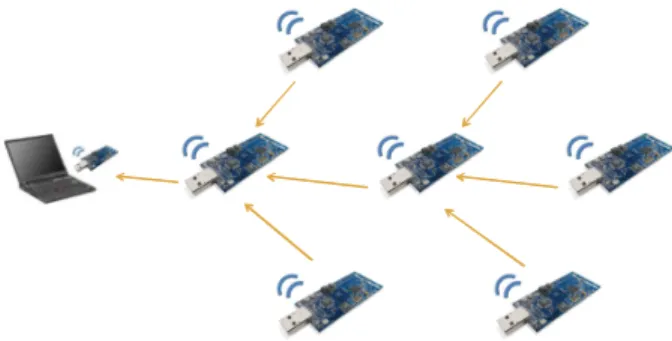
Since the intermittent disconnections contributed more than half of the lost packets, it is desirable to solve the problem. As Tmote Sky sensors are deployed in a field, the base station will construct its backbone for communication. Figure 3 shows the concept of
Figure 4. All sensors periodically transmitted sensing data to the base station.
backbone in a Tmote Sky sensor network. Some sensor nodes, called backbone nodes, participate in the back-bone constructions. Other nodes which do not belong to the backbone are regular nodes. When the back-bone is established, all sensors will periodically trans-mit sensing data through the backbone to the base sta-tion. Figure 4 illustrates the route of data transmission.
Constructing a Backbone
The terminal condition of constructing backbone is important. The base station searched one backbone node first. The backbone node continued to find its next sensor to be backbone, and the other of its neigh-bors became regular nodes. When a backbone node could not find any other sensor to be regular node, the backbone was completed.
Detecting Intermittent Disconnections
Aside from transmitting sensing data received from other sensors, the backbone sensors are also respon-sible for detecting intermittent disconnections. If a backbone sensor does not receive any packet from its served sensor (either a regular sensor or backbone sen-sor) continuously, the served sensor will be considered failed. When the failure is detected, one of the follow-ing recovery schemes will be started.
4. Solutions
Increasing Transmission Power
Based on our measurements for Tmote Sky (see Ta-ble 4), the transmission range for a fixed output power
Table 4. Transmission Range for Each Power Output Power (dBm) Average Transmission Range (Meter) Maximum Transmission Range (Meter) Minimum Transmission Range (Meter) 0 25.10 27.50 22.62 -1 21.82 23.46 19.94 -3 19.34 21.80 16.92 -5 16.04 17.85 14.23 -7 12.14 14.36 10.11 -10 9.37 11.48 7.20 -15 6.38 8.70 5.82 -25 2.20 3.30 1.75
Backbone Sensor Failed Sensor
1. Detect intermittent disconnection 2. Send a command to the failed sensor
3. Receive the command, increase transmission power 4. Transmit data with higher power for designated time
To Do To Do
Figure 5. Increasing transmission power.
Backbone Sensor Failed Backbone Sensor
(Primary Sensor)
Backup Sensor To Do
To Do
1. Detect intermittent disconnection 2. Send a command to the backup sensor 4. Receive data from the failed sensor
(no longer disconnection)
5. Send a command to the backup sensor
3. Receive the command, help to transmit data 6. Receive the command, stop helping
Figure 6. Constructing a primary-backup sys-tem.
may vary. For example, when the output power is set to -10dBm, the transmission range is from 7 to 11 me-ters. It is possible that the transmission range of a sen-sor is reduced suddenly so the backbone sensen-sor cannot receive any data from the sensor. As the intermittent disconnections are detected, the backbone sensor will try to ask the “failed” sensor to use more output power for transmission. Figure 5 shows the concept of the recovery scheme.
Backbone Sensor Failed Sensor (Sensor A)
Sensor B
Sensor C To Do
1. Detect intermittent disconnection 2. Broadcast a control message
(Sensor A is failed)
3. Receive the message, check neighbor list 4. Sensor A is in the list, help to transmit data
3. Receive the message, check neighbor list 4. Sensor A is not in the list, do nothing
To Do
To Do Either
Or
Figure 7. Cooperation.
Constructing a Primary-backup System
All sensing data are delivered through the backbone so it is critical to protect the backbone nodes from intermittent disconnections. Accordingly, to take ad-vantage of redundant regular sensor nodes was con-sidered. When the Tmote Sky sensor network starts, backbone sensors search for regular sensors with small output power to be their backup nodes. These sen-sors construct primary-backup pairs. As intermittent disconnections occur, the backup node of the “failed” primary sensor will be asked to take over. The backup sensor continues to help transmission during the time when the primary node fails. The procedures of the recovery are displayed in Figure 6.
Cooperation
All regular sensors record their one-hop neighbors during the network initialization. When a failed sen-sor is detected, the backbone sensen-sor will broadcast a message to ask if any sensor can connect to the faulty sensor. Each node receiving the message examines its current valid neighbors. If the node’s neighbors in-clude the faulty node, the node will transmit the data for the faulty node. There may be more than one reg-ular sensors that can connect to the faulty node. The backbone sensor assigns one of responded sensors as the cooperator. Figure 7 demonstrates the concept of the cooperation scheme.
5. Experiments
Eleven Tmote Sky sensors were used for the exper-iment. A laptop computer with a sensor acted as a
1 6 5 10 3 7 8 2 4 9 2 meters Primary-backup pair (a)Topology 1 1 6 5 9 2 7 8 3 4 10
2 meters Primary-backup pairs
(b)Topology 2 8 1 5 7 9 2 6 3 10 4
2 meters Primary-backup pairs
(c)Topology 3
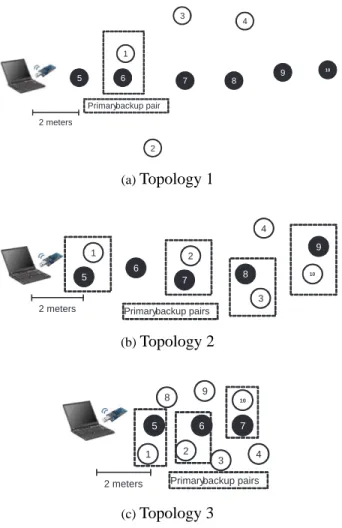
Figure 8. Deployment of three topologies.
base station and the other ten sensors were deployed in three topologies (see Figure 8). Topology 1 is a sparse deployment where few regular sensors can serve as backup nodes or cooperative nodes. In Topology 2, several primary-backup pairs can be established. In Topology 3, the node density is higher; each sensor has more neighbors. The sensors transmit packets to the base station periodically. Some sensors (in dark color) formed a backbone that helped to transmit pack-ets to the base station hop-by-hop. Four spack-ets of ex-periments were evaluated, including ORI (without any recovery scheme), ITS (with increasing transmission power), PBS (with primary-backup system), and CO (with cooperation). The parameter settings are listed in Table 5.
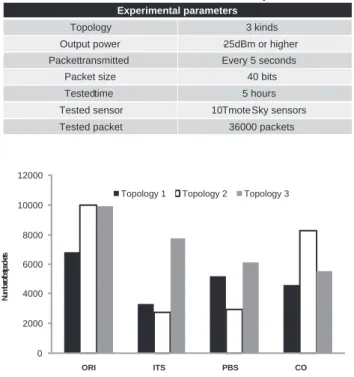
Table 5. Environment Setup Experimental parameters
Topology 3 kinds
Output power -25dBm or higher
Packettransmitted Every 5 seconds
Packet size 40 bits
Testedtime 5 hours
Tested sensor 10 TmoteSky sensors
Tested packet 36000 packets
0 2000 4000 6000 8000 10000 12000
Topology 1 Topology 2 Topology 3
Nu m be r o f lo st p ac ke ts ORI ITS PBS CO
Figure 9. Number of lost packets.
5.1. Transmission Performance
Figure 9 shows the total number of lost packets in four experiments for each topologies. ORI had the largest number of lost packets since it did not have any recovery scheme for the intermittent disconnections. For Topology 1, ITS reduced 51.6% of the lost pack-ets; PBS and CO had about 24.5% and 33.6% reduc-tion, respectively. The result reveals that ITS is a better choice for the less condensed deployment. For Topol-ogy 2, PBS achieved about 70.8% reduction of the lost packets. This indicates that constructing primary-backup sensors in the backbone can reduce the effect of intermittent disconnections. For Topology 3, CO had the smaller number of lost packets than ITS and PBS. When each node has more neighbors, CO has the better performance.
5.2. Energy Consumption
Figures 10 and 11 illustrate the average number of transmitted and received packets for each node, re-spectively. The long I-shaped legends show the maxi-mum and minimaxi-mum values for all sensors. Energy con-sumption can be calculated based on the number of
N um be r of pa ck ets ORI ITS PBS CO 0 5000 10000 15000 20000 25000 30000 35000
Topology 1 Topology 2 Topology 3
Figure 10. Average number of transmitted packets. N um be r o f pa ck ets ORI ITS PBS CO 0 5000 10000 15000 20000 25000 30000 35000
Topology 1 Topology 2 Topology 3
Figure 11. Average number of received pack-ets.
packets sent and received, corresponding power, and required time [11]. Data rate in Tmote Sky sensor is 250Kbps. The packet size was set to 40bits so the time for transmission is 0.00016 second. The energy con-sumption for each node can be computed.
Figure 12 shows the average energy consumption in ten Tmote Sky sensors. Compared to ORI, the in-creased needed power for the three recovery schemes was limited. The recovery schemes spent additional 8.5% energy on average in Topology 1. In Topolo-gies 2 and 3, about extra 22.7% and 12.4% energy were required, respectively. With the little more power consumed, the data transmission was better in the sen-sor network.
En erg y c on su m pti on (m J) ORI ITS PBS CO 0 50 100 150 200 250 300 350
Topology 1 Topology 2 Topology 3
Figure 12. Comparison of average energy consumption.
6. Conclusion
In this paper, the transmission characteristics of Tmote Sky sensors were examined. The intermittent disconnection introduced by the inconsistent trans-mission ranges was also discussed. Three recovery schemes for the disconnection were implemented and evaluated in the Tmote Sky wireless network. Experi-mental results show that the transmission performance can be improved effectively with the limited energy overhead.
Acknowledgments
The authors would like to thank the anonymous re-viewers for their suggestions that improved this paper. This research was supported by the Taiwan National Science Council (NSC) under contracts NSC 95-2221-E-006-092-MY2, 97-2918-I-006-009, and 97-2628-E-006-093-MY3.
References
[1] I. F. Akyildiz, W. Su, Y. Sankarasubramaniam, and E. Cayirci, “A Survey on Sensor Networks,” IEEE Communications Magazine, vol. 40, no. 8, pp. 102–114, Aug. 2002.
[2] Z. J. Hass and T. Small, “A New Networking Model for Biological Applications of Ad Hoc
Sensor Networks,” IEEE/ACM Transactions on Networking, vol. 14, no. 1, pp. 27–40, Feb. 2006. [3] W. R. Heinzelman, A. Chandrakasan, and H. Balakrishnan, “Energy-Efficient Communi-cation Protocol for Wireless Microsensor Net-works,” in Proceedings of the Hawaii Interna-tional Conference on System Sciences, Jan. 2000, pp. 908–918.
[4] M. Busse, T. Haenselmann, and W. Effelsberg, “Energy-Efficient Forwarding Schemes for Wire-less Sensor Networks,” in Proceedings of the International Symposium on World of Wireless, Mobile and Multimedia Networks, June 2006, pp. 125–133.
[5] K. Manousakis and A. J. McAuley, “Minimum Necessary Transmission Range Assignments for Network Connectivity,” in Proceedings of the IEEE International Symposium on Personal, In-door and Mobile Radio Communications, Sept. 2007, pp. 1–5.
[6] R. Ramanathan and R. Rosales-Hain, “Topology Control of Multihop Wireless Networks Using Transmit Power Adjustment,” in Proceedings of the IEEE Conference on Computer Communica-tions, vol. 2, Mar. 2000, pp. 404–413.
[7] “Tmote Sky,” http://www.sentilla.com/moteiv-transition.html.
[8] “TinyOS,” http://www.tinyos.net/.
[9] D. Gay, P. Levis, and D. Culler, “Software De-sign Patterns for TinyOS,” in Proceedings of the ACM SIGPLAN/SIGBED Conference on Lan-guages, Compilers, and Tools for Embedded Sys-tems, vol. 40, no. 7, July 2005, pp. 40–49.
[10] “Chipcon CC2420,”
http://embedded- system.net/chipcon-cc2420-zigbeeieee-802154-rf-transceiver.html.
[11] A. Barberis, L. Barboni, and M. Valle, “Eval-uating Energy Consumption in Wireless Sensor Networks Applications,” in Proceedings of the Euromicro Conference on Digital System Design Architectures, Methods and Tools, Aug. 2007, pp. 455–462.