0925-9635/04/$ - see front matter䊚 2003 Elsevier B.V. All rights reserved. doi:10.1016/j.diamond.2003.10.056
Field emission properties of aligned carbon nanotubes grown on stainless
steel using CH
4yCO reactant gas
2Chien-Liang Lin*, Chia-Fu Chen, Shih-Chen Shi
Department of Materials Science and Engineering, National Chiao Tung University, 1001 Ta Hsueh Road, Hsinchu 30050, Taiwan, ROC
Abstract
Aligned carbon nanotubes (CNTs) were grown on stainless steel 304 by bias-enhanced microwave plasma chemical vapor
deposition, using CH4yCO as the reactant gas. A bias was applied to the microwave plasma to grow the nanotubes over various2
periods. Experimental results show that well-aligned CNTs grow on stainless steel at a negative bias of y300 V. Energy dispersive spectrometer on TEM indicated that the metal catalyst on the top of the CNTs includes Fe and Ni, but not Cr. The field emission properties of the resultant CNTs were obtained at a negative bias of y300 V: the emission current was 194 mA at 2.2 Vymm;
and the turn-on voltage, which is the voltage needed to extract current density of 10 mAycm , was 1.4 Vymm.2
䊚 2003 Elsevier B.V. All rights reserved.
Keywords: Nanotubes; Plasma CVD; High-resolution electron microscopy; Field emission
1. Introduction
Carbon nanotubes (CNTs), since their discovery in 1991 w1x, have been considered for use in many different applications. The small dimensions, strength and remark-able physical properties of these materials make them the very promising emitters for field emission devices. Field emission devices based on CNTs have exhibited remarkable emission characteristics and good current stability w2,3x, because of the high-aspect-ratio and electrical conductivity, as well as a mechanical stiffness of the nanotubes w4,5x.
This study uses the CH4yCO gas system rather than2
CH4yH . CH yCO can promote the growth rate over2 4 2
that obtained with CH4yH , because of the high concen-2
tration of carbon w6x. The growth quality of CNTs has been reported to exceed that of obtained using a con-ventional reaction in a gas mixture of hydrogen and hydrocarbons w7x, and the growth temperature can prob-ably be reduced to under 300 8C w8x.
In the authors’ previous study, CNTs were grown in situ by modified hot filament chemical vapor deposition using an Fe–Cr filament wire(Fe: 72 at.%, Cr: 23 at.%)
that acts as a catalyst and a heat source w9x. Furthermore, Okai et al. w10x reported the growth of CNTs on Fe–
*Corresponding author. Tel.: q886-955979496; fax: q886-3-5504502.
E-mail address: [email protected](C.-L. Lin).
Ni–Cr alloy substrate (Fe: 52 wt.%, Cr: 6 wt.%, Ni: 42 wt.%). Comparing, the alloy they used has much less Cr than that of our study. Therefore, in this work, typical stainless steel 304 (Fe: 70 wt.%, Cr: 19 wt.%, Ni: 9 wt.%), an Fe–Ni–Cr alloy with a high Cr content, was used as the substrate to grow CNTs and identify the catalytic effects of the metal. The field emission prop-erties of CNTs grown on the stainless steel were also examined.
2. Experimental details
CNTs were deposited by microwave plasma chemical vapor deposition. The stainless steel 304 had a thickness of 1 mm and an area of 15=15 mm . Before deposition,2
samples were sonicated in acetone for 10 min, washed in DI water and dried using nitrogen gas. Bias-enhanced microwave plasma chemical vapor deposition was used to grow CNTs; various bias conditions and periods were used to grow the CNTs. The reactive gas mixture was CH4yCO at a flow rate of 30y22.5 sccm. The applied2
microwave power and pressure were 300 W and 1333 Pa, respectively. No bias, a negative bias voltage y300 Vand a positive bias voltage 300 Vwere separately applied to the substrates to study the effect of the bias on the growth of CNTs on stainless steel 304. CNTs were grown at a bias of y300 Vfor various periods. An optical pyrometer was used to monitor the
temper-Fig. 1. SEM photographs of deposition product grown on stainless steel 304 at various biases for 10 min;(a) y300 V, (b) 0 Vand (c) q300 V.
ature of the substrate, which was maintained at approx-imately 600 8C.
A scanning electron microscope (SEM) (S-4000, Hitachi) was used to observe the morphology of the growing samples. A Renishaw micro-Raman spectro-scope with an argon ion laser(514.5 nm line) was used
to characterize the quality of the CNTs. The I–V measurements were made to analyze the field emission properties of the CNTs. Finally, the nanotubes were imaged using a high-resolution transmission electron microscope (HRTEM) (Tecnai 20, Philips), metal
cata-lyst was analyzed using an energy dispersive spectrom-eter(EDS) attached to the HRTEM.
3. Results and discussion
3.1. Effect of bias on the growth of CNTs
Fig. 1 presents SEM photographs of deposition prod-ucts grown for 10 min at various biases. The SEM photograph shown in Fig. 1a shows that CNTs grew on stainless steel 304 at a negative bias of y300 V. The surface morphology was almost the same across the entire area. Fig. 1b shows that no CNTs grow on the stainless steel at no bias, and Fig. 1c shows that carbon rods grow on the stainless steel at a positive bias of q 300 V. However, the morphologies of both samples differed between their corners and the center. Partial surface fragmentation has been reported w11x to produce a wide variety of surface structures, which then translates into a corresponding variety of catalyzed products, ranging from tufts, stumps, to CNTs.
Raman spectroscopy has been used to study multi-wall nanotubes w12x. The first-order Raman spectrum of the CNTs includes strong, sharp peaks at 1581 and 1350ycm, typical of graphitic carbon nanostructures.
Fig. 2 presents the Raman spectra of the deposition product grown on stainless steel 304 under various bias conditions for 10 min. As shown in Fig. 2, samples at biases of y300 and q300 Vyielded two peaks at approximately 1350 and 1581ycm. Furthermore, the
Raman spectrum indicates that the sample grown under no bias yielded no carbon structure, as shown in Fig. 1b. From the SEM photographs and Raman spectra, a negative bias of y300 Vwas selected to examine the various periods of growth of CNTs.
3.2. Various periods of growth of CNTs
Fig. 3 presents SEM photographs of CNTs grown on stainless steel 304 for various periods. Fig. 3a shows the surface breakup of stainless steel 304. The rupture of the surface has been reported w11x to have increased the yield of CNTs and the uniformity of their sizes. According to Fig. 3a–d, the yield and diameter of CNTs increased with the growth time. Besides, vertical CNTs
become more prevalent as growth time increases. As shown in Fig. 3d, CNTs grown for 30 min possess a high-aspect-ratio, implying potential use as field emis-sion devices.
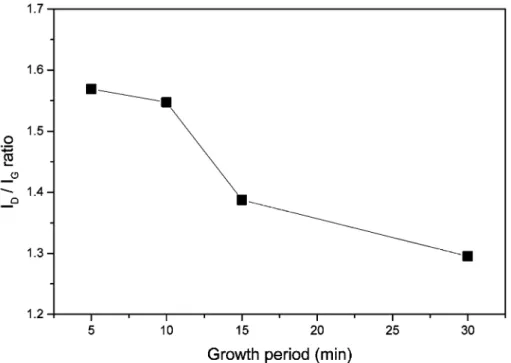
Fig. 4 plots the I yI ratio derived from the RamanD G
spectra obtained after various periods of growth of CNTs on stainless steel 304. The relative intensities of the two peaks depend on the type of graphitic material. As the
Fig. 2. Raman spectra of deposition product grown on stainless steel 304 at various biases.
Fig. 4.I yI ratio derived from Raman spectra of CNTs grown over various periods on stainless steel 304.D G
Table 1
EDS quantitative analyses of metal catalysts in CNTs
Sample no. Fe Ni Fe Ni (at.%) (at.%) (wt.%) (wt.%) 1 82.43 17.57 81.70 18.30 2 97.03 2.97 96.89 3.11 3 97.63 2.37 97.51 2.49 4 95.59 4.41 95.37 4.63 5 89.70 10.30 89.23 10.77 6 95.07 4.93 94.83 5.17 7 97.81 2.19 97.71 2.29 8 81.93 18.07 81.18 18.82 9 79.04 20.96 78.20 21.80 10 87.18 12.82 86.61 13.39
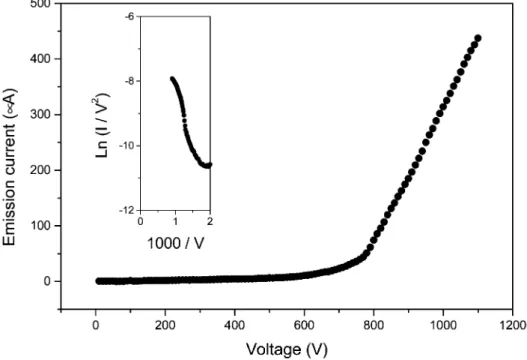
Fig. 6. Emission current against applied voltage, and F–N plot of CNTs grown at y300 Vbias for 30 min.
ratio of the intensity of the disorder peak at 1335ycm
to that of the graphite carbon peak at 1590ycm (I yID G
ratio) decreases, the degree of graphitization increases.
Fig. 4 shows that theI yI ratio decreases as the growthD G
period increases. Restated, this figure shows that the crystallinity of the CNTs becomes better as the growth period increases. The SEM photographs show that the product on the samples becomes more uniform and coherent as time passes. The better crystallinity of the CNTs is believed to be attributable to the reduction in the amount of disorganized carbon in the samples.
Fig. 5 shows TEM images of the end section of three individual CNTs. The CNTs were analyzed by TEM to confirm that they were truly CNTs, and not solid carbon fibers. A comparison of these images to those presented elsewhere w8x indicates that the tubes are multi-walled
CNTs. Fig. 5 also reveals that the CNTs have inner diameters of 10–20 nm and outer diameters of 30–40 nm. A comparison of these images with the SEM photograph in Fig. 3d suggests that the catalyst is on the top of the CNTs.
3.3. Catalytic effect of metal
Table 1 presents EDS quantitative analyses of metal catalysts in CNTs. Fig. 5a–c refers to samples 1, 2 and 3, respectively. In these ten samples, EDS signal of Cr is not observed. The top metal particles therefore include only Fe and Ni, but not Cr when the CNTs are grown on the 304 alloy substrate. According to the binary phase diagrams of carbon and metal, the eutectic point of C–Cr alloy is higher than that of C–Fe and C–Ni alloys, which fact is one reason for the elimination of Cr from Fe–Ni–Cr alloy w10x. SEM at low magnifica-tion revealed that particles were present along the grain boundary of stainless steel 304. We therefore suggest that chromium carbide is precipitated in the grain bound-ary of stainless steel at an elevated temperature, in a process similar to that which occurs when stainless steel is heat-treated.
3.4. Field emission properties
The field emission properties of CNTs grown at a y 300 Vbias for 30 min are obtained using a diode structure. An anode, made of ITO glass, was separated by 500 mm from the tip of a cathode made of CNTs.
TheI–V properties were measured using an electrometer
(Keithley 237) and analyzed using the
Fowler–Nor-dheim (F–N) model. Fig. 6 plots emission current against applied voltage, and also presents an F–N plot of this sample. The F–N plot is used to confirm the field emission characteristics. A linear relationship between ln(IyV ) and 1000yV is obtained. The emission2
current at an applied voltage of 1100 V (2.2 Vymm)
was 437 mA (194 mAycm ). The macroscopic turn-on2
voltage, which is the voltage needed to extract a current density of 10 mAycm , was 700 V2 (1.4 Vymm).
4. Conclusions
CNTs were grown on stainless steel 304 by microwave plasma chemical vapor deposition using CH4yCO2
source gases at a negative bias of y300 V. EDS quantitative analyses indicate that the alloy particles at the top ends of the CNTs have various contents of Fe and Ni. However, Cr was not found at the top of the CNTs, perhaps because the higher eutectic point of C– Cr causes Cr to remain on the substrate and chromium carbide to precipitate on the grain boundary. The field emission properties of the resultant CNTs obtained at a negative bias y300 Vwere as follows; the emission current was 194 mA at 2.2 Vymm, and the turn-on
voltage, which is the voltage needed to extract a current density of 10 mAycm , was 1.4 Vymm.2
Acknowledgments
The authors would like to thank the National Science Council of the Republic of China, Taiwan for financially supporting this work under Contract No. NSC 91-2219-E-009-029.
References
w1x S. Iijima, Nature(London) 354 (1991) 56.
w2x W.A. de Heer, A. Chatelain, D. Ugarte, Science 270ˆ (1995)
1190.
w3x W. Zhu, C. Bower, O. Zhou, G. Kochanski, S. Jin, Appl. Phys.
Lett. 75(1999) 873.
w4x Z. Yao, C.L. Kane, C. Dekker, Phys. Rev. Lett. 84 (2000)
2941.
w5x E.W. Wong, P.E. Sheehan, C.M. Lieber, Science 277 (1997)
1972.
w6x C.L. Tsai, C.F. Chen, C.L. Lin, Appl. Phys. Lett. 80(2002)
1821.
w7x M. Chen, C.M. Chen, C.F. Chen, Thin Solid Films 420–421 (2002) 203.
w8x M. Chen, C.M. Chen, S.C. Shi, C.F. Chen, Jpn J. Appl. Phys.
42(2003) 614.
w9x C.F. Chen, C.L. Lin, C.M. Wang, Appl. Phys. Lett. 82(2003)
2515.
w10x M. Okai, T. Muneyyochi, T. Yanguchi, S. Sasaki, Appl. Phys.
Lett. 77(2000) 3468.
w11x R.L.V. Wal, L.J. Hall, Carbon 41(2003) 659.
w12x J. Kastner, T. Pichler, H. Kuzmany, et al., Chem. Phys. Lett.