國 立 交 通 大 學
機 械 工 程 學 系
碩 士 論 文
Modification of Polymer Surfaces Using the Post-Discharge Region of
an Atmospheric-Pressure Dielectric Barrier Discharge
常壓電漿介電質放電在放電區域出口處
進行高分子材料表面改質特性的研究
研究生:林逸民
指導教授:吳宗信 博士
常壓電漿介電質放電在放電區域出口處
進行高分子材料表面改質特性的研究
Modification of Polymer Surfaces Using the Post-Discharge Region of an
Atmospheric-Pressure Dielectric Barrier Discharge
研 究 生:林逸民
Student:I-Min Lin
指導教授:吳宗信博士
Advisor:Dr. Jong-Shinn Wu
國 立 交 通 大 學
機 械 工 程 學 系
碩 士 論 文
A Thesis
Submitted to Department of Mechanical Engineering
College of Engineering
National Chiao Tung University
in Partial Fulfillment of the Requirements
for the degree of
Master in
Mechanical Engineering
July 2009
Hsinchu, Taiwan, Republic of China
常壓電漿介電質放電在放電區域出口處進行
高分子材料表面改質特性的研究
學生: 林逸民 指導教授: 吳宗信 博士
國立交通大學機械工程學系
摘要
利用電漿進行表面改質已經越來越受歡迎了,因為和傳統的化學過程比較起來有 更多的優點。例如對環境傷害較低,處理時間快速以及可以應用在更多的技術 上。本實驗是使用氮氣以及氧氣在大氣電漿下進行聚丙烯表面改質的處理。此裝 置放電區域是由兩塊外面包覆石英版的金屬平板所產生,其中將高分子材料放在 電漿出口的位置加以處理。處理前後使用接觸角量測系統量測接觸角以界定親疏 水性特性。本實驗利用氮氣加氧氣電漿對聚丙烯進行表面改質的效果顯著,在改 變不同電漿處理的垂直距離能將原先接觸角 103 度降低至 26 度,其中最佳化的 處理位置大概在 6mm 的地方。但經過長時間放置於大氣後,接觸角會有少部分的 回升,但回升後的角度仍然低於原本的角度。之後還透過 AFM 分析來觀察聚丙烯表面粗操度的改變。除此之外,本實驗還利用 XPS 來分析聚丙烯表面經過電漿處 理前後表面所含元素以及相對百分比。經過分析得到表面會產生許多急性的官能 基,例如 CO, C=O, 以及 COO。由本實驗對親水性改質以及表面結構進行的探 討可知電漿處理是有效率的。
Modification of Polymer Surfaces Using the Post-Discharge
Region of an Atmospheric-Pressure Dielectric Barrier Discharge
Student:I-Min Lin
Advisor:Dr. Jong-Shinn Wu
Department of Mechanical Engineering
National Chiao Tung University
Abstract
Plasma treatment of polymers is gaining more and more popularity as a surface modification technique, since it offers numerous advantages over the conventional chemical processes. Plasma surface treatment is an environmentally benign, fast and versatile technology. Modification of the surface properties of polypropylene (PP) films is studied using oxygen and nitrogen dielectric barrier discharge at atmospheric pressure. The discharge was generated between two planar metal electrodes, with the both electrodes covered by quartz and the polymer sample was placed post-discharge region. The surface properties of both treated and untreated polymers were characterized by contact angle measurement. With the change treating distance for N2+O2 plasma, the water contact angle changes from 103o before treatment to a
lowered surface contact angle of processed PP film is found to in part recover but still lower than the untreated material. Through AFM analysis, we also observed the change of surface morphology and roughness before and after plasma treatment. In addition, the effects of plasma treatment on the surface chemical characteristics of the PP films were observed by using X-ray photoelectron spectroscopy (XPS). As the result of analysis, we observed that polar functional groups, such as –CO, –C=O, and –COO were introduced on the PP film surface after atmospheric pressure plasma treatment. The results show that such a plasma treatment is effective.
致 謝
在交大兩年的求學期間,非常感謝恩師吳宗信教授細心的指導與提攜,並且 提供如此優秀的研究團隊,讓我在這個環境中能夠學習的更快且更有效率,在研 究方面,吳教授總是將他所學的經驗毫無保留的教導給我們,讓我在這其中學到 了許多做事情的態度與解決問題的方法,使我能順利的完成研究並且不斷地成 長。在此,僅以此文向恩師致以最衷心之感謝。同時也感謝口試委員徐振哲老師、 江仲驊老師、黃俊誠老師細心審閱並給予意見,使論文更為完善,學生逸民在此 深表謝意。另外特別感謝博士班江明鴻學長,在我求學的兩年內不管在課業或是 研究方面總是提供我許多的幫助,並且在我遇到實驗問題時總是不厭其煩的教導 我,讓我能夠順利的完成此篇研究,在此也一併的感謝。 實驗室的每位學長學姊在我兩年的時間也提供給我許多寶貴的經驗,讓我在 做研究上面能夠更有效率,非常感謝劉育宗、呂政霖、鄭承志等已畢業的學長與 我分享實驗的經驗,以及實驗室中的學長姐,李允民、周欣芸、李富利、洪捷燦、 徐哲維、鄭凱文、胡孟樺、邱沅明、江明鴻、林雅茹、林昆模、蘇正勤等,平時 在各方面給予我的幫助,讓我在兩年內充滿了許多回憶,還有同儕王穎志、古必 任、林俊傑在課業上面的交流以及共同努力奮鬥為了研討會的過程,這些都是我 人生中難以忘懷的一段歷程,也同時要感謝碩一的學弟呂其璋和黃皓遠在我實驗 中所給予我各方面的協助,以及周子豪和吳尚穎在實驗之外的幫助,除此之外來自紐西蘭的 Post-doctor 學者 Hadley M. Cave (瓦片) 和法國的 Post-doctor 學者 ALIAT Abdelaziz,讓我在碩士的兩年期間有更豐富的回憶,並能順利的完成學 業。 最後我要感謝的是無論何時都給我強大後盾的父親和母親,僅將此論文獻給 我最深愛的家人,有他們的加油與支持讓我更有勇氣面對未知的難題,也要謝謝 家人能夠讓我在完全無後顧之憂的情況下完成碩士學業,非常感謝他們一路上的 栽培與關心,同時也要感謝我的女朋友于恩在我遇到實驗瓶頸時不斷地幫我打氣 加油,讓我更加有信心。在這即將離別的季節,雖然有些不捨,希望大家都能夠 為自己的理想努力,並往各自的目標邁進。 林逸民 謹誌 九八年七月于風城
Table of Contents
摘要... I Abstract ... III 致謝... V Table of Contents ... VII List of Table ... IX List of Figures ... X Nomenclature ... XIII Chapter 1 Introduction ... 1 1.1 Motivation ... 1 1.2 Background ... 2 1.2.1 Introduction to DBD ... 2
1.2.2 Introduction to surface modification ... 4
1.3 Literature Review... 5
1.3.1 Applications of the APPJ ... 5
1.3.2 Types of APPJ ... 6
1.3.3 Surface modification of polymer ... 7
1.3.4 Surface modification of ITO (indium tin oxide) glass ... 8
1.4 Objectives and Organization of the Thesis ... 9
Chapter 2 Experimental Methods ... 10
2.1 Experimental Facility: Planar DBD Atmospheric-Pressure Plasma Jet System ... 10
2.1.1 Electrode assembly ... 10
2.1.2 DC quasi pulsed power supply ... 11
2.1.3 Gas feeding system ... 11
2.1.4 Cooling system... 11
2.1.5 Test chamber ... 12
2.2 Experimental Instrumentation ... 12
2.2.1 Electrical measurements ... 12
2.2.2 TC for temperature measurements ... 13
2.2.3 OES for radical concentration measurements ... 13
2.2.4 Contact angle measurement system ... 14
2.2.5 Atomic force microscope (AFM) ... 15
2.2.6 X-ray photoelectron spectroscopy (XPS) ... 16
2.2.7 Ozone analyzer... 17
2.3 Experiment Methods and Test Conditions ... 18
Chapter 3 Results and Discussion ... 19
3.1 Electrical Characterization of the DBD ... 19
3.2 Temperature Analysis of APPJ ... 20
3.2.1 Air temperature distribution without stage ... 21
3.2.2 Air temperature distribution with stage... 21
3.3 Images and Spectral Analysis of APPJ ... 22
3.4 Contact Angle Measurements ... 23
3.4.1 Contact angle measurements of stationary PP film ... 23
3.4.2 Contact angle measurements of moving PP film ... 24
3.4.3 Aging effect ... 25
3.5 AFM analysis ... 25
3.6 XPS analysis ... 26
3.7 O3 and NO2 measurement ... 27
3.8 Surface reaction mechanism for PP ... 28
Chapter 4 Conclusion and Future Work ... 30
4.1 Summary ... 30
4.2 Recommendation of future work ... 31
List of Table
Table 1 The temperature measurement of air without stage. Other discharge parameters are: gas flow rate=50 slm, input power=500 W, gap=1 mm, and power density= large. ... 38 Table 2 The temperature measurement of air with stage. Other discharge parameters are: gas flow rate=50 slm, input power=500 W, gap=1 mm, and power density= large. ... 39 Table 3 Contact angles (0) of PP treated for various working gases and Z axis. The columns show the contact angles obtained with various Z axis. The rows show the contact angles for various working gases (con.). Other discharge parameters are: gas flow rate=50 slm, input power=500 W, gap=1 mm, and power density= large. ... 40 Table 4 Contact angles (0) of PP treated for various working gases and Z axis. The columns show the contact angles obtained with various Z axis. The rows show the contact angles for various working gases. Other discharge parameters are: gas flow rate=50 slm, input power=500 W, gap=1 mm, and power density= large. .. 41 Table 5 Contact angles (0) of PP treated for various working gases and V= 0.5 cm/s. Other discharge parameters are: gas flow rate=50 slm, input power=500 W, gap=1 mm, Z= 2mm and power density= large. ... 42 Table 6 Contact angles (0) of PP treated for various working gases and stage velocity. The columns show the contact angles obtained with various stage velocity. The rows show the contact angles for various working gases. Other discharge parameters are: gas flow rate=50 slm, input power=500 W, gap=1 mm, Z= 2mm and power density= large. ... 43 Table 7 RMS roughness of PP film with respect to treatment distance of atmospheric pressure plasma. Other discharge parameters are: gas= nitrogen, gas flow rate=50 slm, input power=500 W, gap=1 mm, Z= 2mm and power density= large. ... 44 Table 8 Atomic percent concentration and ratio of untreated PP and atmospheric pressure plasma treated PP. Other discharge parameters are: gas flow rate=50 slm, input power=500 W, gap=1 mm, Z= 2mm and power density= large. ... 45
List of Figures
Figure 1.1 Historic ozone discharge tube of W. Siemens, 1857 ... 46
Figure 1.2 Electroluminescence diagram ... 46
Figure 1.3 Subdivision of plasmas at atmospheric pressure [7] ... 47
Figure 2.1 Essentials of the experimental arrangements ... 48
Figure 2.2 Overview of the atmospheric pressure plasma jet system ... 49
Figure 2.3 Front panel of pulse power ... 50
Figure 2.4 Rear panel of pulse power ... 50
Figure 2.5 Definition of plasma density ... 51
Figure 2.6 Gas feeding system ... 52
Figure 2.7 Cooling system tubes from water chiller to the chamber ... 53
Figure 2.8 Water chiller ... 54
Figure 2.9 Testing chamber ... 55
Figure 2.10 The appearance of the electrode ... 55
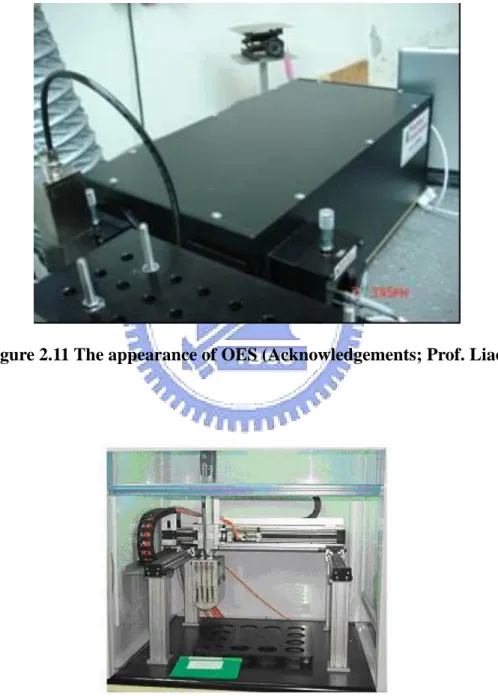
Figure 2.11 The appearance of OES (Acknowledgements; Prof. Liao) ... 56
Figure 2.12 Contact angle measurement system ... 56
Figure 2.13 Atomic Force Microscope measurement system ... 57
Figure 2.14 Atomic force microscope working diagram ... 58
Figure 2.15 The operating principle of XPS ... 58
Figure 2.16 Ozone analyzer (Acknowledgements; Dr. Chen, INER) ... 59
Figure 2.17 Multi gas monitor (Acknowledgements; Prof. Hsu, NTU) ... 60
Figure 3.1 Typical current and voltage waveforms for N2 discharge. Other discharge parameters are: gas flow rate=50 slm, input power=500 W, gap=1 mm, and power density= large. ... 61
Figure 3.2 Typical current and voltage waveforms for N2+0.1%O2 discharge. Other discharge parameters are: gas flow rate=50 slm, input power=500 W, gap=1 mm, and power density= large. ... 62
Figure 3.3 Typical electrical properties for N2 discharge and the large symbol is represented by breakdown point. Other discharge parameters are: gas flow rate=50 slm, input power=500 W, gap=1 mm, and power density= large. ... 63
Figure 3.4 Typical electrical properties for N2+0.1%O2 discharge and the large symbol is represented by breakdown point. Other discharge parameters are: gas flow rate=50 slm, input power=500 W, gap=1 mm, and power density= large. ... 64
Figure 3.5 Lissajous figure for a parallel-plate DBD APPJ in N2 discharge driven by a quasi-pulsed power supply (60 kHz). Other discharge parameters are: gas flow rate=50 slm, input power=500 W, gap=1 mm, and power density= large. ... 65
Figure 3.6 Lissajous figure for a parallel-plate DBD APPJ in N2+0.1%O2 discharge
driven by a quasi-pulsed power supply (60 kHz). Other discharge parameters are: gas flow rate=50 slm, input power=500 W, gap=1 mm, and power density= large.
... 66
Figure 3.7 Definition of X and Z directions ... 67
Figure 3.8 The temperature measurement without stage (Air 50slm, 500W)... 68
Figure 3.9 Images of plasma post-discharge region for ... 69
Figure 3.10 OES distribution in the range of 180-900nm for the N2 post-discharge plasma. Other discharge parameters are: gas flow rate=50 slm, input power=500 W, gap=1 mm, and power density= large. ... 70
Figure 3.11 OES distribution in the range of 180-900nm for the N2+0.1% post-discharge plasma. Other discharge parameters are: gas flow rate=50 slm, input power=500 W, gap=1 mm, and power density= large. ... 71
Figure 3.12 OES distribution in the range of 180-900nm for the N2+1.6% post-discharge plasma. Other discharge parameters are: gas flow rate=50 slm, input power=500 W, gap=1 mm, and power density= large. ... 72
Figure 3.13 UV emission along the channel exit (X-direction). Other discharge parameters are: gas= nitrogen, gas flow rate=50 slm, input power=500 W, gap=1 mm, and power density= large. ... 73
Figure 3.14 OES distribution compare among N2-based APPJ at 180-280 nm. Other discharge parameters are: gas flow rate=50 slm, input power=500 W, gap=1 mm, and power density= large. ... 74
Figure 3.15 OES distribution compare among N2-based APPJ at 280-400 nm. Other discharge parameters are: gas flow rate=50 slm, input power=500 W, gap=1 mm, and power density= large. ... 75
Figure 3.16 OES distribution compare among N2-based APPJ at 400-700 nm. Other discharge parameters are: gas flow rate=50 slm, input power=500 W, gap=1 mm, and power density= large. ... 76
Figure 3.17 OES distribution compare among N2-based APPJ at 700-900 nm. Other discharge parameters are: gas flow rate=50 slm, input power=500 W, gap=1 mm, and power density= large. ... 77
Figure 3.18 Axial and various gas distributions of UV emission (a) pure N2 (b) N2+0.1%O2 (c) Z= 4 mm ... 79
Figure 3.19 Axial distribution of UV emission (a) pure N2 (b) N2+0.1%O2 ... 80
Figure 3.20 Degree of contact angle measurement ... 81
Figure 3.21 Contact angle of water on PP film versus selected working gas at different distance of Z axis. Other discharge parameters are: gas flow rate=50 slm, input power=500 W, gap=1 mm, and power density= large. ... 81
Figure 3.22 Contact angle of water on PP film versus selected working gas at different distance of Z axis (con.). Other discharge parameters are: gas flow rate=50 slm, input power=500 W, gap=1 mm, and power density= large. ... 82 Figure 3.23 Contact angle of water on PP film versus different stage velocity at selected working gases. Other discharge parameters are: gas flow rate=50 slm, input power=500 W, gap=1 mm, Z= 2mm and power density= large. ... 83 Figure 3.24 Contact angle of water on PP film versus various gas, Z-direction and aging time were treated in the N2+O2 DBD environment. Other discharge
parameters are: gas flow rate=50 slm, input power=500 W, gap=1 mm, and power density= large. ... 84 Figure 3.25 XPS survey scan spectra of untreated PP (spectrum (a)) and N2+0.1%O2
treated PP at Z= 6mm (spectrum (b)). ... 85 Figure 3.26 Concentration of O3 as a function of the O2 /N2 flow rate ratio (a) Z=
2mm-10mm (b) 12mm-20mm ... 86 Figure 3.27 Concentration of NO2 as a function of the O2 /N2 flow rate ratio (a) Z=
2mm-10mm (b) 12mm-20mm ... 87 Figure 3.28 A monomer unit in PP [39] ... 88 Figure 3.29 Functionalization and cross-linking mechanism on the PP film surface with respect to plasma treatment [25]. ... 88 Figure 3.30 Axial and various gas distributions of UV (236nm) emission. (a) 2D contour (b) 3D contour... 89 Figure 3.31 Axial and various gas distributions of contact angle measurement. (a) 2D contour (b) 3D contour... 90 Figure 3.32 Axial and various gas distributions of NO2 concentration. (a) 2D contour
(b) 3D contour ... 91 Figure 3.33 Axial and various gas distributions of O3 concentration. (a) 2D contour (b)
Nomenclature
E electrical energy consumed per voltage cycle
P plasma absorbed power
f frequency of AC-pulsed voltage
V input voltage to the electrodes
Chapter 1 Introduction
1.1 Motivation
Formerly, industrial plasma processes (for example, thin film depositon, surface modifications, etc. [Berry R.W. and Hall P.M., 1968; Strobel M., et al. 1994]) vacuum systems had generally been used to keep the plasma stable. This plasma is called non-equilibrium plasma, or cold plasma, because of the differences between the electron and gas temperatures in the plasma. All of the above-mentioned technologies are low-pressure processes and therefore the vacuum system is particularly important. Several applications require the atmospheric or continuous in-line processing, which further restrains the use of low pressure discharges in these areas. Atmospheric-pressure plasmas overcome these inherited disadvantages of low-pressure plasmas. Therefore, a plasma process that does not require vacuum systems can reduce costs and more efficient.
PP film is a very versatile polymer material to be used in many industrial fields, such as the protective film of other films, food packaging, etc. PP film is widely used in forms of complex and blend with other polymers because of its light and good mechanical properties and low processing costs [Cho D.L., et al. 2001; Poncin-Epailard F., et al. 1994]. In spite of having many good merits, however, PP
film has hydrophobic characteristics because a basic repeating unit is only hydrocarbon. In general, a hydrophobic film has poor wettability, adhesion, and printability [Zeniewicz M. and Adhes J., 2001]. Especially when it binds with a polar polymer, the problems like poor adhesion and easy detachment occur because the difference of surface free energy in the interface between two polymers is quite large. Many studies have been done to overcome these problems through plasma treatment [Tanaka K., et al. 2001]. One of those studies is a process using atmospheric pressure plasma [Kwon OJ., et al, 2005].
1.2 Background
1.2.1 Introduction to DBD
Dielectric-barrier discharges, or simply barrier discharges, have been known for more than a century. First experimental investigations were reported [Siemens W., 1857], see figure1.1.
Dielectric barrier discharges, also referred to as barrier discharges (BD) or silent discharges are plasmas far from equilibrium [Eliasson B. and Kogelschatz U., 1997; Samoilovich V., et al, 1997]. Besides the ozone synthesis, the scope of their applications covers incoherent ultraviolet (UV) or vacuum ultraviolet (VUV) excimer
radiation in excimer lamps [Boyd I. W., and Zhang J. Y., 1997], surface treatment (modification, cleaning, etching) [Wagner HE., et al. 2003] and layer deposition [Goossens O., et al.2001]. The treatment of surfaces has already a long tradition. This technique, misleading called as ‗‗corona treatment,‘‘ is used, e.g. to promote the wettability, printability and adhesion on polymer surfaces. The surface treatment of dielectric as well as of conducting materials is possible.
Atmospheric pressure plasmas are subdivided into non-thermal and thermal ones. The corresponding conditions are illustrated in the Figure 1.3. Examples for plasma sources important for numerous applications are listed, too. The conditions of non-thermal plasmas are mainly characterized by a relatively low temperature of the neutral gas in contrast to a significantly higher kinetic temperature of the electrons. The non-equilibrium between these main components is permanently maintained by applying DC or AC electric fields to the discharge electrodes. The gas temperature is often near room temperature. Therefore, these plasmas are named low-temperature non-equilibrium plasmas, too. In thermal plasmas, all species have an identical temperature characterized by one Maxwellian velocity distribution function of particles. Consequently, they are in the complete (or at least local) thermal equilibrium which can be reached only sufficiently far from solids in contact with plasmas. This group includes, e.g. arcs and inductively coupled plasma torches.
Microwave plasma sources can provide both regimes, depending on the operation conditions [Wagner HE., et al. 2003].
Typical planar DBD configurations are sketched in Figure 1.2. As a consequence of the presence of at least one dielectric barrier these discharges require alternating voltages for their operation. The dielectric, being an insulator, cannot pass a dc current. Its dielectric constant and thickness, in combination with the time derivative of the applied voltage, dU dt , determine the amount of displacement current that / can be passed through the dielectric(s). To transport current (other than capacitive) in the discharge gap the electric field has to be high enough to cause breakdown in the gas [Kogelschatz U., 2003].
1.2.2 Introduction to surface modification
Plasma surface modification does not require the use of water and chemicals, so it can be considered as an environmentally benign technology [Mukhopadhyay SM.,
et al. 2002]. In addition, it is a versatile technique, where a large variety of chemically
active functional groups can be incorporated onto the polymer surface [Borcia G. and Anderson CA, 2004]. Moreover, plasma treatment only changes the uppermost atomic layers of a material surface without modifying the bulk properties [Poll HU, et al 2001]. In this paper, PP films are modified in order to improve the wettability of the
sample surfaces using N2/O2-DBD at atmosphere pressure.The surface modification
of PP using atmospheric-pressure dielectric barrier discharge has the following advantages: (i). treatment in air at atmospheric pressure is possible;( ii). a large size and large amount of film can be treated; (iii). the cost performance is excellent; (iv). the life of the instrument is long; and (v). short time modification is possible.
1.3 Literature Review
1.3.1 Applications of the APPJ
Since we are interested in studying the APPJ to generate oxygen and nitrogen related radicals, we only review the applications in these two directions in the following. Oxygen plasmas have numerous applications including etching, cleaning, sterilization, surface modification and thin film deposition, to name a few [Schutze A.,
et al. 1998]. Nitrogen plasmas can be used to improve the hardness, errosion
resistance and fatigue life, to treat organic polymers to increase wettability and promote adhesion [Moravej M., et al, 2006]. These applications all require large amount of oxygen or nitrogen atoms at the location of processing.
In Taiwan, relatively few researchers are working on APPJ related problems. Some very few examples include Prof. Kou at Department of Physics of NTHU
[Wang S.P., 2005], Prof. Hung at Department of Chemical Engineering of NCKU [HO C.C., 2003], and Mechanical System Laboratory of ITRI [Liu C.H., et al, 2006]. But basically all the three groups are mainly working on application-oriented typies, none has studied the fundamentals of the APPJ in depth.
1.3.2 Types of APPJ
At present in the APPJ research, mainly studies the direction for to discuss the electrode structure, the discharge gas and the power supply. These three parameters are the key to produce the plasma in atmospheric pressure with big area and uniform. In 1933, it found to glow discharge in low pressure to atmospheric pressure by hydrogen [Von Engle A., et al. 1933]. In 1988, Kanazawa was set up APGD (Atmospheric Pressure Glow Discharge) for the first time, but it had to satisfy three conditions: (i) the frequency is more than 1KHz ; (ii) metal electrodes must be between the insulation medium ; (iii) Helium was the working gas [Kanazawa S., 1988]. In 1993 and 1997, Okazakia [Okazaki S., et al. 1993] and Roth [Roth J. R., et
al. 1993] [TSAI P. P., et al. 1997] used specific forms of electrodes to establish the
APGD by air and the other gases which will modify the surface properties.
In 1998, transient gas discharges at atmospheric pressure in particular barrier discharges are a powerful tool to modify the surface properties of polymer materials.
The handling of reactive gas mixtures at atmospheric pressure in systems suitable for the corona treatment of moving foils with velocities up to 60 m/min has been demonstrated successfully [Meiners S., et al. 1998]. In 2005, the argon gas is fed into the inner-grounded electrode, the outer electrode is connected to the high-voltage power supply and covered with a layer of dielectric, and then a stable cold plasma jet is formed and blown out into air [Cheng C., et al. 2006].
1.3.3 Surface modification of polymer
The nitrogen discharge can significantly increase the wettability of the PP film: the water contact angle can be decreased from 90.8◦ to 56.5◦. Moreover, the results obtained underline the high efficiency of the present DBD set-up for the modification, since the surface is already saturated after a treatment time as short as 3 s [Morent R.,
et al. 2008]. In addition, through XPS analysis, it qualitatively and quantitatively
confirmed that the polar functional groups, such as –CO, –C=O, and –COO were introduced on the PP film surface after an atmospheric pressure plasma treatment and the percent of oxygen containing groups increased from 2.998% to 9.039%. It is considered because the polar groups are mainly formed from the abstraction of hydrogen in secondary carbon atom, and the formation and disappearance rate of polar groups become equilibrated [Kwon OJ., et al. 2005]. In 2008, modification of
the surface properties of polymer films is using air and nitrogen dielectric barrier discharge plasma at atmospheric pressure. It is shown that air plasma can dramatically improve the wettability of PE surfaces, but it put into the discharge system [Wang K.,
et al. 2008] [BORCIA G., 2005]. The decomposition of the C 1s peak shows that for
PET C=O/N–C=O bonds appear and the C–O/C–N bonds proportion increases by N2
treatment. For exposure time t = 3s the C=O/N–C=O bonds proportion is greater than for t = 1 s; for PP the oxygenated bonds proportion increases, this increase being stronger for t = 3s [Akishev Yu., et al. 2008].
1.3.4 Surface modification of ITO (indium tin oxide) glass
It was found that ultrasmall additions of O2 (ca. 0.03%) to N2 in a
nonequilibrium atmospheric-pressure pulsed plasma achieved a dramatically high surface hydrophilic efficiency for a glass substrate, due to the removal of organic contaminants. The key reactions for surface hydrophilicity are carbon bond scission due to ultraviolet emissions from NO, and the subsequent oxidation by O(3P) after bond breakage in broad areas [Iwasaki M., et al. 2008]. Ozone has a strong absorption band in the UV region, which leads to the generation of oxygen radicals, O(3P) and O(1D), through the photo dissociation of O3 [Iwasaki M., et al. 2007].
1.4 Objectives and Organization of the Thesis
Atmospheric Pressure Plasma Jet has found numerous applications in industry as reviewed earlier. For previous studies, the testing sample will be placed in the glow region. The specific objectives of the thesis can be summarized as follows:
1. To modify the surface of polymer using plasma with various kinds of gases and different from the vertical direction dielectric barrier discharge at atmospheric pressure in post-discharge region.
2. To measure the surface properties after treatment using XPS, AFM and the contact angle measurement.
3. To summarize the results and propose optimized operation conditions for surface treatment.
Chapter 2 Experimental Methods
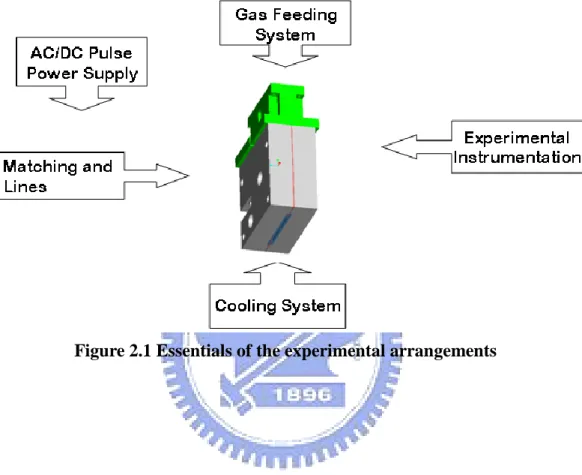
The experiment system (Figure 2.1) includes five parts, AC/DC pulse power supply, matching and lines, gas feeding system, cooling system and experimental instrumentation.
2.1 Experimental Facility: Planar DBD Atmospheric-Pressure
Plasma Jet System
The experimental facility, including electrode assembly, AC/DC pulse power supply, gas feeding system, cooling system, test chamber [Chiang M.H. et al., 2008-2009].
2.1.1 Electrode assembly
A schematic diagram of the plasma configuration can be seen in Figure 2.2. This APPJ consists of two parallel copper electrodes (50 × 50 × 8 mm each) with embedded cooling water. Each of the electrodes is covered with a quartz plate in the size of 70 × 70 × 1 mm. Distance between the two dielectric plates (quartz) are keeping as 1 mm throughout the study, unless otherwise specified.
2.1.2 DC quasi pulsed power supply
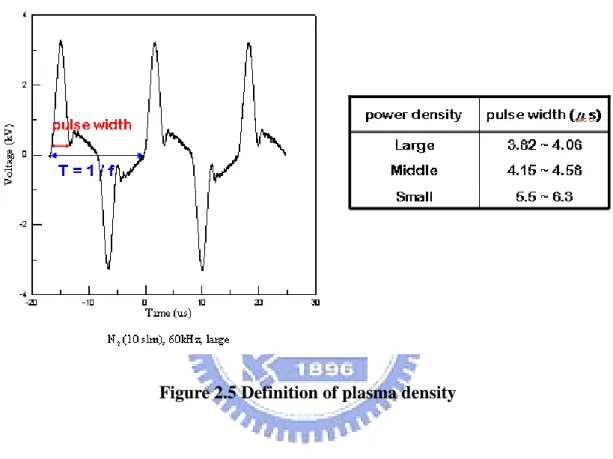
The DC quasi pulsed power is provided by EN Technologies Inc. (model Genius 2, Figure 2.3, 2-4). The frequency is 20 to 60 KHz, output peak voltage is 15 kV and output average power is 2 kW. Plasma density is divided into three types which are small, meddle and large. Different types of definition are described in Figure 2.5.
2.1.3 Gas feeding system
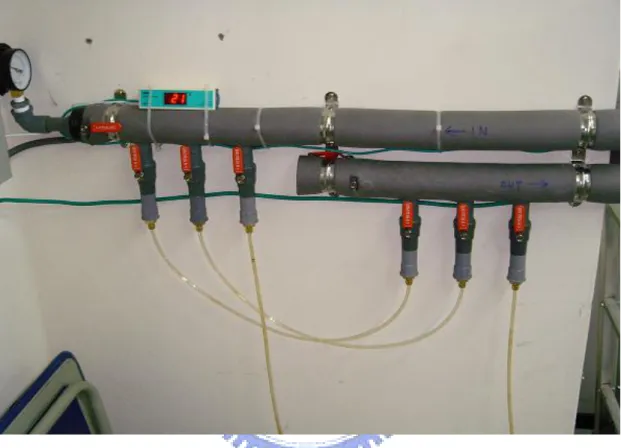
The nitrogen and oxygen gas (1/4 in the Teflon tube) connects the flow meter from the high-purity high-pressured steel cylinder after the pipeline. Different gases are controlled by the flow meter. The flow meter has three types, all is the float-type flow meter. The scope is situated between 0-50 slm (standard liters per minute), control main gas like N2, O2 (Figure 2.6).
2.1.4 Cooling system
Transports by the ice water machine of refrigeration cycle system transportation after the laboratory circulation pipeline cooling water to the APPJ chamber, cooled the plasma hitting the chamber high fever and the power loss produces. The temperature
of cooling water maintained at 20℃ (Figure 2.7, 2.8 cooling tubes to the chamber and water chiller).
2.1.5 Test chamber
The testing section of Atmospheric Pressure Plasma Jet is in plasma post-glow region. Uniform plasma is generated from the gap of the electrode and ground electrode.
2.2 Experimental Instrumentation
The experimental instrumentation, including electrical measurements, thermocouple for temperature measurements, OES for radical concentration measurements, contact angle measurement system, AFM (Atomic Force Microscope), XPS (X-ray photoelectron spectroscopy).
2.2.1 Electrical measurements
At atmospheric pressure the most common electrical diagnostic consists of the measurement of the voltage applied to the electrodes and the resultant discharge
current. It is also common to use a capacitor connected in series to ground; the voltage across the series capacitor is then proportional to the charge stored on the electrodes. This paper measurement method is widely used for obtaining the voltage-versus-charge plots, which form Lissajous figures on a suitable oscilloscope
All the above-mentioned parameters were recorded for the present DBD reactor with a Rogowski coil (IPC CM-100-MG, Ion Physics Corporation Inc.) and a high-voltage probe (Tektronix P6015A), respectively, through a digital oscilloscope (Tektronix TDS1012B). For the measurement of Lissajous figure (Q-V characteristics) of the discharge, a capacitor with capacitance Cm= 6.8nF and a voltage probe
(Tektronix P2220) are used.
2.2.2 TC for temperature measurements
The temperature recorder use K type thermocouple to measure temperature change with gas discharge, the measure range from -20 °C to +400 °C.
2.2.3 OES for radical concentration measurements
The optical emission spectral intensity of the APPJ is measured using a monochromator (PI Acton SP 2500) with a Photomultiplier tube (Hamamatsu R928).
in figure 2.11. In the plasma system, the collision between the particles will have many electrics, some exciting electrics domain will be inspired to a higher energy state, and the excited state of the particles because of instability, will be by the so-called de-excitation or relaxation process back to the original or other than a lower-orbit excited state domain, and the way to release energy luminous, so we can see from the plasma of different wavelengths of light, because the composition of each particle is different, so the release of the light spectrum are not the same wavelength, so we can be in the cape by plasma spectrometry by the wavelength spectrum to determine what plasma may contain active particles, but also by the relative strength line changes in spectrometry, the plasma particles in the know about changes in the number of cases.
2.2.4 Contact angle measurement system
The contact angles before and after plasma treatments are obtained using a commercial KRŰSS Easy Drop optical system (KRŰSS GmbH–Germany) in figure 2.12. This system is equipped with a software operated high-precision liquid dispenser to precisely control the drop size of the used liquid. The drop image is then stored, via a monochrome interline CCD video camera, using PC-based acquisition and data processing. Using the computer software provided with the instrument,
measurement of the static contact angles is fully automated. In this work, distilled water drops of 2 μl are used as test liquid. The values of the static contact angle, are obtained using Laplace- Young curve fitting based on the imaged sessile water drop profile and are the average of 10 values measured over an extended area of the treated samples.
2.2.5 Atomic force microscope (AFM)
The AFM image are obtained in Veeco Dimension 5000 Scanning Probe Microscope (D5000) in figure 2.13 which consists of a microscale cantilever with a sharp tip (probe) at its end that is used to scan the specimen surface. The cantilever is typically silicon or silicon nitride with a tip radius of curvature on the order of nanometers. When the tip is brought into proximity of a sample surface, forces between the tip and the sample lead to a deflection of the cantilever according to Hook's law. Depending on the situation, forces that are measured in AFM include mechanical contact force, Van der Waals forces, capillary forces, chemical bonding, electrostatic forces etc.
If the tip were scanned at a constant height, there would be a risk that the tip would collide with the surface, causing damage. Hence, in most cases a feedback
mechanism is employed to adjust the tip-to-sample distance to maintain a constant force between the tip and the sample (Figure 2.14).
2.2.6 X-ray photoelectron spectroscopy (XPS)
X-ray Photoelectron spectroscopy (XPS) is a dedicated surface characterization spectroscopy. It reveals which chemical elements are present at the surface, for example carbon and oxygen; it informs us about the chemical bound nature which exists between these elements. An appropriate data processing leads to the specimen elemental composition.
The specimen is then introduced in the first chamber (sample preparation chamber). This chamber is then pumped by high vacuum pumps (also called secondary vacuum pumps) down to a vacuum below 10-7 mbar. When the proper vacuum has been achieved, the specimen is transferred into the analysis chamber and the XPS experiment may begin. The analysis chamber vacuum ranges from 10-8 mbar to 10-11 mbar. The next illustration shows a schematic drawing of the XPS spectrum acquisition principle. For clarity, the drawing scale has been changed (Figure 2.15).
2.2.7 Ozone analyzer
The detection of ozone molecules is based on absorption of 254nm UV light due to an internal electronic resonance of the O3 molecule. The Model 450 (figure
2.16) uses a mercury lamp constructed so that a large majority of the light emitted is at the 254nm wavelength. Light from the lamp shines down a hollow quartz tube that is alternately filled with sample gas, then filled with gas scrubbed gas to that of the sample form a ratio I/Io. This ratio forms the basis for the calculation of the ozone
concentration.
2.2.8 Multi gas monitor
The VRAE is a programmable multi gas monitor designed to provide continuous exposure monitoring of toxic gases, oxygen and combustible gases for workers in hazardous environments. Two models of VRAE are available: PGM-7800 and PGM-7840. The PGM-7840 has one more inorganic toxic sensor in lieu of oxygen sensor in the PGM-7800.
The VRAE monitor detects inorganic toxic gases and oxygen concentration with the electrochemical sensors. It also monitors combustible gases with a catalytic bead sensor and a broad range of gases with a thermal conductivity detector.
2.3 Experiment Methods and Test Conditions
The in-house designed and built DBD system in figure 2.2. The discharge is generated between the electrodes using a pulsed high-voltage supply (peak-to-peak values in the 10–20 kV range) with a frequency of 60 kHz. During the treatments, the gap was adjusted to 1 mm. The samples to be treated are placed on the post-discharge. The working gas, here pure nitrogen and oxygen (purity 99.99%, C.F. Ltd, Taiwan), is flowed into the gap through a teflon tube, 1/4 inch in diameter. During experiments the nitrogen and oxygen flow rate was fixed at 50 slm throughout. The polymer sample (polypropylene film) was a 0.31mm thick film purchased from NanYa.
Chapter 3 Results and Discussion
3.1 Electrical Characterization of the DBD
Figure 3.1 and figure 3.2 show the typical measured quasi-pulsed (60 kHz) input voltage to the electrodes and current waveforms produced in the DBD using N2 and
N2+0.1%O2 of 50 slm and having 500 W of power output from the power supply. In
practice, the electrical property for the nitrogen discharge is not very different from that for N2+0.1%O2. Filament current increases rapidly as the voltage rises rapidly
and decreases rapidly as voltage increases to some level. The rapid decrease of the current is mainly due to the charge accumulation on the dielectric surface. The filament current oscillates between positive and negative values at lower voltage mainly because of the displacement current (large rate of change of voltage). Measured peak current for N2 is approximately 0.4 A for 25 cm2 of discharge area,
which is equivalent to ~0.016 A/cm2 in current density and the N2+0.1%O2 is
approximately 0.5 A for 25 cm2 of discharge area, which is equivalent to ~0.02 A/cm2 in current density.
Figure 3.3 and figure 3.4 show the typical electrical properties for N2 and N2+0.1% O2
discharge. The large symbol is represented by breakdown point. Figure 3.5 and Figure 3.6 shows the typical Lissajous figure obtained for the same test conditions as in
Figure 3.1 and Figure 3.2. The shape of the Q-V curve is a distorted version of the standard parallelogram [Wagner, H.E., et al. 2003] observed in a DBD driven by a sinusoidal AC power supply. When the voltage reaches the peak value (~ 8 kV), the maximal effective capacitance (~400 nC) for the N2 and N2+0.1%O2 DBD across the
electrodes is obtained, which extinguishes the discharge (zero current), as observed in Figure 3.1 and Figure 3.2. Corresponding plasma absorbed power is 175 W and efficiency is about 35% in this case. As the voltage continues to decrease, the effective capacitance begins to decrease as expected. The electrical energy consumed per voltage cycle E and the plasma absorbed power P can be estimated by the following relations [Wagner, H.E., et al. 2003]:
( ) area of (Q-V) diagram E
Ñ
V t dQ (1) 1 P E fE T (2) where f is the frequency of AC-pulsed voltage.3.2 Temperature Analysis of APPJ
This section is to explore for gas (Air) in plasma activation analysis of temperature with or without stage. By changes the distance from the jet, through the temperature of changes in the relative strength of the APPJ on qualitative analysis, this experiment used by the measurement tools for thermocouple.
3.2.1 Air temperature distribution without stage
The temperature distribution without stage means free jet in flow field. The figure 3.7 is represented by X and Z direction. Figure 3.8 and table 1 are two dimensional temperature distributions of the APPJ. It is under conditions of air with 50slm (Power= 500W). The maximum value of temperature is 78℃ which is observed at X= 35mm but the temperature distribution of X axis is relatively uniform with slightly clear edge effect. Also it can be seen the temperature has decreased with the increase in Z-axis distance.
3.2.2 Air temperature distribution with stage
Table 2 shows air temperature distribution with stage which is the same conditions above-mentioned. It can be seen more higher than temperature distribution without stage. The increase of the temperature is mainly due to the heat accumulation on the stage. Although the temperature is much higher, it is not over the limit of material.
3.3 Images and Spectral Analysis of APPJ
Figure 3.9 shows the typical image of post-discharge region for N2, N2+0.03%O2
and N2+0.1%O2 discharges at the condition of 50 slm and 500 W. For pure nitrogen
dischrage, the plume looks longer (~ 2.5 cm) with yellow to orange color, while it becomes shorter (~ 1.5 cm) with green color with 0.03% of traced oxygen addition. And it becomes shortest (~ 1 cm) with blue color with 0.1% of traced oxygen addition finally. These color changes can be clearly explained from the OES measurement, as typically shown in figure 3.10-3.12, which shows the optical emission spectrum in the range of 180-900nm for the post-discharge plasma.
UV emission along the channel exit (X-direction) is relatively uniform ether N2
or N2+0.1%O2 considering the experimental uncertainties of OES in figure 3.13.
Besides, UV emission (180-280nm) is greatly enhanced by adding only trace of O2
(0.1%) into the N2 discharge (figure 3.14). However, further addition of O2 (1.6%)
greatly reduces the UV emission, which is probably caused by the electro-negativity of O2 plasma. Underlying plasma chemistry should be studied using more detailed
measurement or simulation in the near future (figure 3.15, 3.17). In addition, visible emission, especially in the range of 450-550nm, is greatly enhanced by adding trace of O2, which causes the yellow-orange plume to become blue as observed in figure
UV emission (200-300nm) decreases in the downstream direction as expected (figure 3.18). And near-UV emission (300-400nm) also decreases further downstream (figure 3.19).
3.4 Contact Angle Measurements
The change of wettability is usually characterized experimentally by the contact angle θ, which is formed on the solid surface along the linear solid-liquid borderline of air in figure 3.20. An increase of wettability or making a polymer more hydrophilic leads to a decrease of the contact angle.
In this work, distilled water was used as the working liquid. The values of the static contact angle shown here were the average of five measured values obtained using Laplacian curve fitting based on the imaged sessile water drop profile, with the drop sizes of 2 l .
3.4.1 Contact angle measurements of stationary PP film
The changes of the contact angle are presented in figure 3.21-3.22 and table 3 & 4, respectively. It show the evolution of the contact angle data measured on the polypropylene (PP) film treated in the DBD nitrogen based environment, for various
working gases, as a function of the Z axis after treatment. In the same manner, after fixing up other plasma treatment conditions except Z direction, the change of the contact angle to plasma treatment distance was measured with increasing the distance from 2 to 20 mm. The contact angle observed is found to 103o for the untreated sample to the lowest value 23o found associated with 6 mm treated sample except N2+1.6%O2. The contact angles measured over an extended area of the treated sample
show a dispersion of about ±5°, which is within experimental error. It can be seen that there is an optimal distance rather than closer from the jet. Consequently, the surface modification of PP film by atmospheric pressure plasma is the most ideal at Z= 6~8mm.
3.4.2 Contact angle measurements of moving PP film
The changes of the contact angle are presented in figure 3.23 and table 5 & 6, respectively. After fixing up other plasma treatment conditions except various working gases, the change of the contact angle to plasma treatment gas was measured with increasing the percent from 0.05% to 1.6% when stage velocity was 0.5cm/s in table 5. The contact angle corresponding to treatment in N2+0.1%O2 is evidently
small, indicating excellent adhesion properties. In the same manner, it measured contact angle which 0.1% to 0.8% when stage velocity was 1cm/s to 8cm/s. Figure
3.23 and table 6 shows the evolution of the contact angle data measured on the polypropylene (PP) film treated in the DBD nitrogen based environment, for various working gases, as a function of stage velocity after treatment. We observe that results indicate contact angle corresponding to treatment in N2+0.1%O2 is also evidently
small, due to hydrophilization, by incorporation of polar functional groups. After increasing stage velocity that was 2cm/s, the contact angle obviously large than velocity was 1cm/s.
3.4.3 Aging effect
The lower contact angle of the plasma-processed PP film is then found to partially recover following aging of the samples in the air. At longer aging times, the contact angle increases more slowly and finally reaches a plateau value. As can be seen in figure 3.24, the increase in contact angle is the higher for the treated sample with moving PP film case and the lower for the N2+0.1%O2 plasma treated sample
after the one day of aging.
3.5 AFM analysis
can be detected using AFM. The conditions of nitrogen plasma treatment were fixed at 500W and 50slm. Only distance from jet was changed from 2 to 20mm.
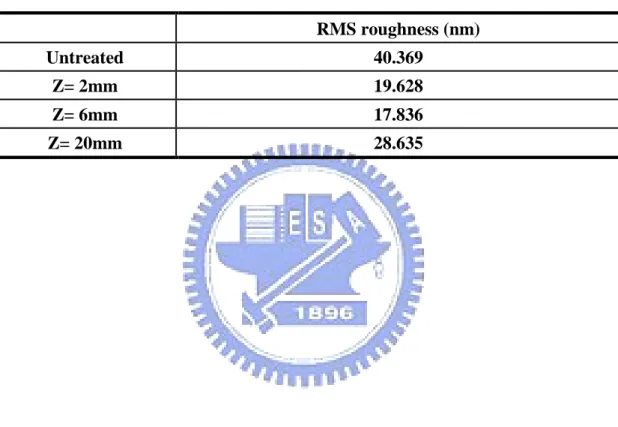
As shown in table 7, at first, the surface of untreated is more roughly. Gradually, it is seen that the RMS roughness decreases with plasma processing distance from 40.369nm for the untreated surface to 19.628nm for Z is 2mm treated surface.
3.6 XPS analysis
To analyze the change of chemical compositions on the PP film surface and the chemical binding state, XPS (ESCA PHI 1600, A1/Mg dual anode, 1486.6eV & 1253.6eV) was used. We compared untreated PP (a) with N2+0.1%O2-treated PP at
Z= 6mm (b), as shown in Figure 3.25. The plasma treatment conditions of 5s, 500 W, and 50slm which showed the lowest value of the contact angle, were used for preparing a sample (b).
In table 8 shows quantitative atomic percent concentration and ratio of untreated and plasma treated sample. The obvious change between untreated and N2+0.1%O2 at
Z= 6mm is that oxygen contents of 10.06% in the untreated PP film increased to oxygen contents of 36.46% for plasma-treated PP film. Namely, after plasma treatment, the percent ratio of O/C increased from 0.125% to 0.898%. From Table 7, we can confirm that the polar functional groups containing oxygen are introduced on
the PP film surface. In figure 3.25 presents the survey spectra of the untreated PP (a) with N2+0.1%O2-treated PP at Z= 6mm (b). From figure 3.25, we can know that C1s
peak decreases a little while O1s peak relatively increases.
3.7 O
3and NO
2measurement
Figure 3.26 shows the O3 concentration measured using ozone analyzer (Model
450) as a function of the flow rate ratio of O2 to N2 at different distance from jet. It
can be seen the highest concentrations of ozone when Z is 8mm. We also observed that the O3 concentration closely between 12mm to 20mm. Besides, the O3
concentration increased linearly with the increase in the O2 and N2 ratio except
N2+0.04%O2 to N2+0.09%O2. In this plasma, dense O3 and contact angle degree are
present in the same region. O3 has a weak absorption band in the contact angle degree
(N2+0.04%O2 to N2+0.09%O2). The region of contact angle degree is overlapped with
the absorption band of O3.
Figure 3.27 shows the NO2 concentration measured using multi gas monitor as a
function of the flow rate ratio of O2 to N2 at different distance from jet. We observed
that highest concentrations of NO2 when Z is 8mm. It also can be seen NO2
concentration closely between 12mm to 20mm. But it was different from O3
concentration were dependent. The NO2 concentration of various nitrogen based gases
was independent of contact angle degree.
3.8 Surface reaction mechanism for PP
PP is a saturated hydrocarbon polymer with a carbon backbone containing hydrogen and methyl (–CH3) groups arranged in an alternating fashion in figure 3.28. The reactivities of the hydrogen groups in PP depend on the nature of the C atom to which they are attached. There are three types of C atoms in any given monomer unit of PP, primary C, to which only one C atom is bonded; secondary C, to which two C atoms are bonded; and tertiary C, to which three C atoms are bonded (see figure ). In general, the reactivities of hydrogen bound to these C atoms scale as: Htert > Hsec >
Hpri [Dorai R. and Kushner M. J., 2003].
In Figure 3.29, the change which can occur on the PP film surface during plasma treatment is simply presented by three steps. It is likely that PP film surface forms cross-linked network structure or is oxidized by the mechanism, as shown in Figure [Kwon OJ., et al. 2004].
At first step, because the stability by the electrondonating effect of the near alkyl group is the highest in the tertiary carbon atom, the tertiary carbon radical is quickly formed by the abstraction of the tertiary hydrogen. The quickly formed tertiary carbon
radicals react with radicals in the near polymer chain. And then cross-linked network structure is formed on the polymer surface [Kwon OJ., et al. 2004].
At the second step, after the hydrogen on the secondary carbon is abstracted by plasma, oxygen containing functional groups, such as –C–OH, –CO–OH, and –C=O are introduced on the polymer surface. It is considered that surface oxidization by plasma is mainly occurred at secondary carbon site in this step [Kwon OJ., et al. 2004].
At the third step, there are two possible reactions. One is that the radical generated by the abstraction of tertiary methyl group forms three dimensionally cross-linked structures by reacting with the near polymer chain. The other is that the process of surface oxidization proceeds a little more by the abstraction of hydrogen in the methyl group [Kwon OJ., et al. 2004].
Chapter 4 Conclusion and Future Work
4.1 Summary
In the study, a planar DBD APPJ driven by a quasi-pulsed power supply was developed and characterized.The effects of a nitrogen and oxygen DBD treatment on the surface of a PP film were examined, reported and discussed focusing on the physical modifications induced on the surface. Results show that the best hydrophilicity of stationary PP film after plasma treatment can be obtained when Z is 6mm: the water contact angle can be decreased from 103◦ to 26◦. Besides, the best hydrophilicity of moving PP film after plasma treatment can be obtained with addition of traced oxygen (0.1%) into the nitrogen discharge when Z is 2mm. Moreover, at longer aging times, the contact angle increases more slowly and finally reaches a plateau value.
Through XPS analysis, we qualitatively confirmed that the polar functional groups, such as –CO, –C=O, and –COO were introduced on the PP film surface after plasma treatment. As shown in the survey scan spectra of XPS, the percent of oxygen containing group ratio increased from 0.125% to 0.898%. It is considered because the polar groups are mainly formed from the abstraction of hydrogen in secondary carbon atom, and the formation and disappearance rate of polar groups become equilibrated.
Possible mechanism of surface modification is attributed to the enhanced UV emission and ozone generation. Both contact angle and ozone concentration were reported optimal value which at Z is 6-8mm (figure 3.31 and 3.33). From the aforementioned, contact angle, UV emission (figure 3.30) and ozone concentration were dependent. There were less intensity of UV emission and enough ozone concentration that can lead hydrophilicity in stationary case. But the moving case is different from stationary case, the intensity of UV emission played an important role in the case, N2+0.1%O2 especially.
4.2 Recommendation of future work
First, it will measure more nitrogen-based gas by using atomic force microscope (AFM).
Second, it will confirm that whether NO concentration existence or not.
Reference
[1] Akishev Yu., Grushin M., Dyatko N., Kochetov I., Napartovich A., Trushkin N., Tran Minh Duc and S Descours, ―Studies on cold plasma–polymer surface interaction by example of PP- and PET-films,‖ J. Phys. D: Appl. Phys. 41 235203 pp 13, (2008).
[2] Berry R.W., Hall P.M., Harris M.T., ―Thin Film Technology‖, Van Nostrand, p. 191, (1968).
[3] Boyd, I. W., Zhang, J. Y., ―New large area ultraviolet lamp sources and their applications‖, Nuclear Instruments and Methods in Physics Research B, 121, pp.349-356, (1997).
[4] Borcia G., Anderson Ca., Brown NMD., Appl Surface Science 225(1–4):186–197, (2004).
[5] Borcia G., PLASMA SOURCES SCIENCE & TECHNOLOGY 14: 259 DOI 10.1088/0963-0252/14/2/006 (2005).
[6] Chiang, M.H. 2008. Characterization of a Planar Atmospheric Dielectric Barrier Discharge Driven by a Pulsed-Power Source and Its Applications Using Post-Discharge Jet Region, PHD proposal, December, Mechanical Engineering Department, National Chiao Tung University, Taiwan.
[7] Chiang M.H., Wu J.S., Li Y.-H. and Wu J.Y., ―Inactivation of Bacillus subtilis spores using dc-pulsed driven DBD atmospheric pressure plasma,‖ Taiwan-Japan Symposium on the Applications of Plasma to Bio-Medical Engineering, December 15-17, 2008, Lung-hua University, Taiwan.
[8] Chiang, M.H., Lin, I.M., Lu, C.C., Huang, H.Y., Wu, J.S. and Liao, K.C. 2009. Characterization of a nitrogen-based planar DBD APPJ and its application in ITO glass cleaning,‖ CAPPSA 2009 - 4th International Congress on Cold Atmospheric Pressure Plasmas: Sources and Applications, June 22-24, Ghent University's Research Unit Plasma Technology, Belgium.
[9] Cheng Cheng, Zhang Liye, Ru-Juan Zhan, Surface & Coatings Technology 200, 6659–6665, (2006).
[10] Cho D.L., Shin K.H., Lee W.J., Kim D.H., J. Adhes. Sci. Technol. 15 653, (2001).
[11] Capitelli M., Ferreira C.M., Gordiets B.F., Osipov A.I., Plasma Kinetics in Atmospheric Gases, (2000).
[12] Dorai R. and Kushner M. J. J. Phys. D: Appl. Phys. 36 666, (2003).
[13] Eliasson B., and Kogelschatz U. IEEE Trans Plasma Science, 19(2):309, 1991; Kogelschatz U., Eliasson B., Egli W., J Phys IV (France); C4:47, (1997).
Coat Technol 142–144:474–481, (2001).
[15] Ho C.C., ―Research of atmospheric pressure plasma technology‖, MS thesis, Department of Chemical Engineering, NCKU, Tianan, Taiwan, June (2003). [16] Iwasaki M., Matsudaira Y., Takeda K., Ito M., Miyamoto E., Yara T., Uehara T.,
Hori M., ―Roles of oxidizing species in a nonequilibrium atmospheric-pressure pulsed remote O2/N2 plasma glass cleaning process,‖ JOURNAL OF APPLIED PHYSICS 103, 023303, (2008).
[17] Iwasaki M., Matsudaira Y., Takeda K., Ito M., Miyamoto E., Yara T., YARA2, Tsuyoshi UEHARA2, and Masaru HORI ―Effect of Low Level O2 Addition to
N2 on Surface Cleaning by Non-equilibrium Atmospheric-Pressure Pulsed
Remote Plasma,‖ Japanese Journal of Applied Physics Vol. 46, No. 23, pp. L540–L542, (2007).
[18] Kanazawa S., Kogoma M., Moriwaki T., Okazaki S., J. Phys. D, Appl. Phys, 21:838, (1988).
[19] Kogelschatz U., ―Dielectric-barrier discharges: Their history, discharge physics, and industrial applications‖, 23, 1, pp 1-46, (2003).
[20] Khairallah Y., Arefi F., Amouroux J., Leomard D., Bertrand P., J., Adhes. Sci. Technol. 8, 363, (1994).
polypropylene film treated by an atmospheric pressure plasma,‖ SURFACE & COATINGS TECHNOLOGY 192 : 1 DOI 10.1016/j.surfcoat.2004.09.018 (2005).
[22] Liu C.H., Chen C.W., Chang .C. C., Lin. C.H., ―簡介大氣電漿技術及產業應 用‖ 機械工業雜誌, Vol. 282, pp. 87-98, (2006).
[23] Mukhopadhyay SM., Joshi P., Datta S., Zhao JG., France P J Phys D—Appl Phys 35(16): 1927–1933, (2002).
[24] Meiners S., Salge J.G.H., Prinz E., Forster F., Surface and Coatings Tedinology, 98, 1121—1127, (1998).
[25] Morent R., De Geyter N., Gengembre L., Leys C., Payen E., Van Vlierberghe S., Schacht E., ―Surface treatment of a polypropylene film with a nitrogen DBD atmedium pressure,‖ EUROPEAN PHYSICAL JOURNAL-APPLIED PHYSICS 43 : 289 DOI 10.1051/epjap:2008076 (2008).
[26] Moravej, M., Yang, X., Barankin, M., Penelon, J., Babayan, S.E., Hicks, R.F., ―Properties of an atmospheric pressure radio-frequency argon and nitrogen plasma,‖ Plasma Sources of Science & Technology, Vol. 15, pp. 204-210, (2006). [27] Okazaki S., Kogoma M., Uehara M., Kimura Y., Journal of Physics D: Applied
Physics, 26:889, (1993).
[29] Poncin-Epailard F., Chevt B., Brosse J.C., J. Adhes. Sci. Technol. 8 1047, (1994).
[30] Roth J. R., Spence P. D., Liu C., A PS Bull., 38:1901, (1993). [31] Siemens W., Poggendorff ‘s Ann. Phys. Chem., 102, 66, (1857).
[32] Samoilovich V., Gibalov V., Kozlov K., ―Physical chemistry of the barrier discharge.‖ D. usseldorf: DVS-Verlag GmbH, (1997).
[33] Schutze, A., Jeong, J.Y., Babayan, S.E., Park, J., Selwyn, G.S., Hicks, R.F., ―The
atmospheric-pressure plasma jet: a review and comparison to other plasma sources‖, IEEE Transactions of Plasma Science, Vol. 26, No. 6, pp. 1685-1694, (1998).
[34] Tsai P. P., Wadsworth, Lc., Roth Jr., - Textile research journal, 67:359, (1997). [35] Tanaka K., Inomata T., Kogoma M., Thin Solid Films 386 217, (2001).
[36] Vossen J.L., Kern W., ―Thin Film Process‖, Academic Press, London, p. 12, (1978).
[37] Von Engle A., Seeliger R., Steenbeck M., Physik Z., 85:144, (1993).
[38] Wagner HE., Brandenburg R., Kozlov KV., Sonnenfeld A., Michel P., Behnke JF Vacuum 71(3):417–436, (2003).
[39] Wang Kun, Li Jian, Ren Chunsheng, Wang Dezhen, Wang Younian, Plasma Science and Technology, Vol.10, No.4, Aug. (2008).
[40] Wagner H.E., Brandenburg, R., Kozlov, K.V., Sonnenfeld, A., Michel, P., Behnke J.F., ―The barrier discharge: basic properties and applications to surface treatment,‖ Vacuum, Vol. 71, pp. 417-436, (2003).
[41] Wang S.P., ―Characterization of an atmospheric pressure plasma jet‖, MS thesis, Department of Physics, NTHU, Hsinchu, Taiwan, June (2005).
Table
Table 1 The temperature measurement of air without stage. Other discharge parameters are: gas flow rate=50 slm, input power=500 W, gap=1 mm, and power density= large.
T (℃) X = 5 mm X = 15 mm X = 25 mm X = 35 mm X = 45 mm Z = 2 mm 70 75 78 78 77 Z = 4 mm 70 75 77 78 77 Z = 6 mm 68 73 77 77 75 Z = 8 mm 65 70 72 73 68 Z = 10 mm 58 62 63 65 63
Table 2 The temperature measurement of air with stage. Other discharge parameters are: gas flow rate=50 slm, input power=500 W, gap=1 mm, and power density= large.
X = 25 mm Z = 2.4 mm 91 Z = 4.4 mm 87 Z = 6.4 mm 83 Z = 8.4 mm 79 Z = 10.4 mm 73
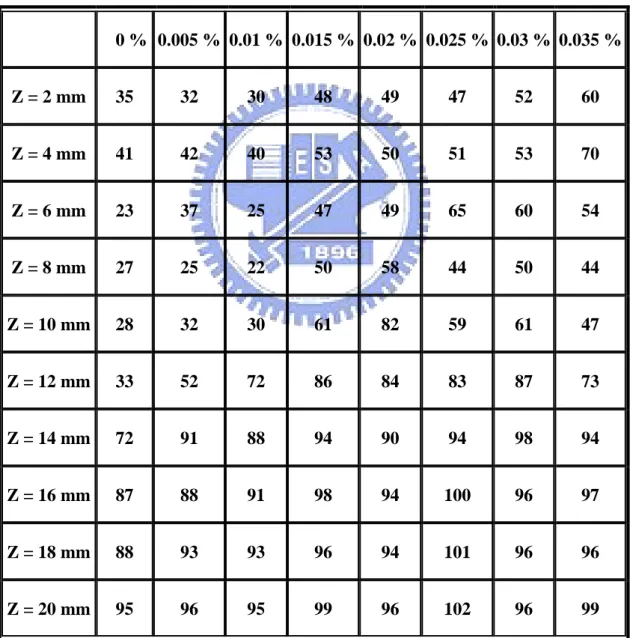
Table 3 Contact angles (0) of PP treated for various working gases and Z axis. The columns show the contact angles obtained with various Z axis. The rows show the contact angles for various working gases (con.). Other discharge parameters are: gas flow rate=50 slm, input power=500 W, gap=1 mm, and power density= large.
0 % 0.005 % 0.01 % 0.015 % 0.02 % 0.025 % 0.03 % 0.035 % Z = 2 mm 35 32 30 48 49 47 52 60 Z = 4 mm 41 42 40 53 50 51 53 70 Z = 6 mm 23 37 25 47 49 65 60 54 Z = 8 mm 27 25 22 50 58 44 50 44 Z = 10 mm 28 32 30 61 82 59 61 47 Z = 12 mm 33 52 72 86 84 83 87 73 Z = 14 mm 72 91 88 94 90 94 98 94 Z = 16 mm 87 88 91 98 94 100 96 97 Z = 18 mm 88 93 93 96 94 101 96 96 Z = 20 mm 95 96 95 99 96 102 96 99
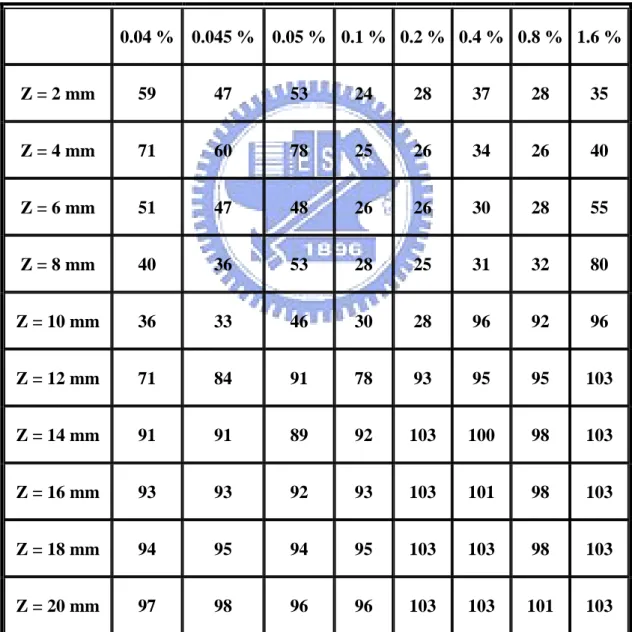
Table 4 Contact angles (0) of PP treated for various working gases and Z axis. The columns show the contact angles obtained with various Z axis. The rows show the contact angles for various working gases. Other discharge parameters are: gas flow rate=50 slm, input power=500 W, gap=1 mm, and power density= large. 0.04 % 0.045 % 0.05 % 0.1 % 0.2 % 0.4 % 0.8 % 1.6 % Z = 2 mm 59 47 53 24 28 37 28 35 Z = 4 mm 71 60 78 25 26 34 26 40 Z = 6 mm 51 47 48 26 26 30 28 55 Z = 8 mm 40 36 53 28 25 31 32 80 Z = 10 mm 36 33 46 30 28 96 92 96 Z = 12 mm 71 84 91 78 93 95 95 103 Z = 14 mm 91 91 89 92 103 100 98 103 Z = 16 mm 93 93 92 93 103 101 98 103 Z = 18 mm 94 95 94 95 103 103 98 103 Z = 20 mm 97 98 96 96 103 103 101 103
Table 5 Contact angles (0) of PP treated for various working gases and V= 0.5 cm/s. Other discharge parameters are: gas flow rate=50 slm, input power=500 W, gap=1 mm, Z= 2mm and power density= large.
Z= 2mm V= 0.5 cm/s 0.000% 0.005% 0.010% 0.015% 0.020% 0.025% 0.030% 0.035% 75 74 73 72 70 77 77 76 0.040% 0.045% 0.050% 0.100% 0.200% 0.400% 0.800% 1.600% 74 73 73 26 27 33 39 77
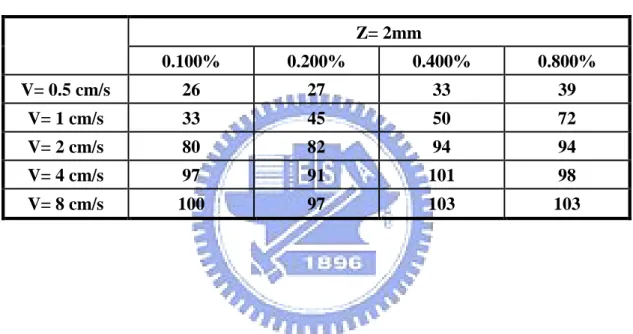
Table 6 Contact angles (0) of PP treated for various working gases and stage velocity. The columns show the contact angles obtained with various stage velocity. The rows show the contact angles for various working gases. Other discharge parameters are: gas flow rate=50 slm, input power=500 W, gap=1 mm, Z= 2mm and power density= large.
Z= 2mm 0.100% 0.200% 0.400% 0.800% V= 0.5 cm/s 26 27 33 39 V= 1 cm/s 33 45 50 72 V= 2 cm/s 80 82 94 94 V= 4 cm/s 97 91 101 98 V= 8 cm/s 100 97 103 103
Table 7 RMS roughness of PP film with respect to treatment distance of atmospheric pressure plasma. Other discharge parameters are: gas= nitrogen, gas flow rate=50 slm, input power=500 W, gap=1 mm, Z= 2mm and power density= large. RMS roughness (nm) Untreated 40.369 Z= 2mm 19.628 Z= 6mm 17.836 Z= 20mm 28.635