研究有機黏土對玻璃纖維材料在層間破壞韌性行為的影嚮
59
0
0
全文
(2) 研究有機黏土對玻璃纖維材料在層間破壞韌性行為的影嚮 Investigating the Organoclay Effect on the Interlaminar Fracture Toughness of Fiber Reinforced Nanocomposites 研 究 生:許世民. Student:Shih-Ming Hsu. 指導教授:蔡佳霖. Advisor:Jia-Lin Tsai. 國. 立. 交. 通. 大. 學. 機 械 工 程 系 碩 士 論 文 A Thesis Submitted to Department of Mechanical Engineering College of Engineering National Chiao Tung University in partial Fulfillment of the Requirements for the Degree of Master in Mechanical Engineering July 2006 Hsinchu, Taiwan, Republic of China. 中 華 民 國 九 十 五 年 七 月.
(3) 研究有機黏土對玻璃纖維材料 在層間破壞韌性行為的影嚮 學生:許世民. 指導教授:蔡佳霖. 國立交通大學機械工程學系碩士班 摘. 要. 本研究目的是利用有機黏土作為加強材,研究環氧樹脂和玻璃纖維/環 氧樹脂材料的機械行為。為了確認有機黏土在環氧樹脂中的效應,分別將 含有 2.5wt%,5.0wt%以及 7.5wt%的有機黏土利用超音波震盪的方式將其分 散在環氧樹脂裏。拉伸試驗和破壞實驗分別用來分析他們的剛性,破壞強 度以及破壞行為。從拉伸驗實驗的結果得知,增加 5 wt%的有機黏土可以使 得環氧樹脂原本的剛性增加了 16%的加成效應,但是原有的破壞應變的特性 卻減少了。並且使用一具有單邊裂紋的變矩(SENB)試片執行破壞實驗,結 果指出有機黏土會使得環氧樹脂的破壞韌性產生劇烈的下降。從電子掃描 顯微鏡觀察發現奈米複合材料有轉變成脆性材料的特性。 為了研究有機黏土在玻璃纖維/環氧樹脂複合板材的影嚮,利用 5 wt% 的有機黏土分在環氧樹脂裏,接著使用手積層(hand-lay-up)的方式將之和 玻璃維材料製成奈米複合板材。依照偏軸拉伸試驗以及第一類層間的破壞 試驗分析奈米複合板材的拉伸強度以及破壞行為。從偏軸拉伸試驗顯示出 奈米複合板材比傳的複合板材具有較好的拉伸強度,在另一方面,奈米複 i.
(4) 合板材的層間破壞韌性卻變差了,這個趨勢和在環氧樹脂的樣本上具有相 同的特性。. ii.
(5) Investigating the Organoclay Effect on the Interlaminar Fracture Toughness of Fiber Reinforced Nanocomposites Student:Shih-Ming Hsu. Advisor:Dr. Jia-Lin Tsai. Institute of Mechanical Engineering. National Chiao Tung University. Abstract This study aims to investigate the organoclay effect on the mechanical behaviors of epoxy resin as well as glass fiber/epoxy composites.. To understand organoclay effect on the. epoxy phase, three different amounts of organoclay, 2.5, 5 and 7.5 % wt, were dispersed into the epoxy with the mechanical blender followed by the sonication. Both tensile tests and fracture tests were carried on these specimens for characterizing their stiffness, tensile strength and fracture behaviors.. The experimental results obtained from tensile tests. indicated that with the inclusion of 5% wt organoclay, the stiffness of the epoxy increase up to 16%; however, the corresponding failure strain decreases.. Moreover, by utilizing the. single-edge-notch bending specimens for fracture tests, the results depicted that the organoclay may dramatically reduce the fracture toughness of the epoxy resin.. SEM. micrographics demonstrate that the brittle fracture occurs in the nanocomposites. For the examination of organoclay effect on glass/epoxy composites, 5 wt% organoclay were dispersed into the epoxy at the beginning and then the compound were in corporation with dry iii.
(6) glass fiber through hand lay-up process to form glass fiber/epoxy/organoclay nanocomposites. Off-axis tensile tests as well as Mode I interlaminar fracture tests were conducted on the fiber nanocomposites to understand the tensile strength and the fracture behavior of the sample with organoclay.. From off-axis tests, it is indicated that the nanocomposites exhibit high. tensile strength then the conventional fiber composites.. On the other hand, the interlaminar. fracture toughness decreases in the nanocomposite specimens. similar to that in the pure epoxy case.. The decreasing tendency is. with glass fiber and epoxy resin.. The fracture tests. will be performed on the hydraulic MTS machine with 10-1 mm/min loading rate.. iv.
(7) 致謝 在此論文定稿之際,忠心的感謝 蔡佳霖博士三年來的殷切指導,引領 世民踏入學術的殿堂,蔡老師的諄諄教誨,使世民學習到許多的經驗並獲 得成長,在此致上由衷的謝意。同時感謝金大仁教授及博士撥允擔任學生 口試委員,給予指導。 世民最感謝的是偉大的雙親,許榮雄及林寶鳳女士,給予世民無匱乏 的生活及無限的關懷與支持,求學之路有您們的寬容與呵護,讓世民在無 憂無慮下成長且在無後顧之憂完成學業。感謝老婆淑貞最後一年的支持與 鼓勵,由於你的諒解讓世民得以安心的完成學業。 感謝學長王漢偉及黃仁傑提供世民學業上及實驗上寶貴的經驗,幫助 世民提早適應實驗室的生活。工研院美秀、廷鉅前輩分別協助世民在製作 試片的經驗及試片檢測上的幫助。同學陳奎瀚及郭濬清,有你們的陪伴讓 世民的求學之路並不孤單,並給予許多的扶持與幫助。感謝學弟曾世華及 吳明道過去一年來的陪伴,有你們的陪伴讓世民的生活增添不少的樂趣, 在此也預祝你們的研究順利。還有許多不及備載但曾經幫助過且指導過世 民的朋友,給予世民許多的寶貴意見及協助,世民亦銘記在心,在此僅以 論文獻給你們。. v.
(8) 目. 錄. 中文摘要. ………………………………………………………………………………. i. 英文摘要. ………………………………………………………………………………. iii. 致謝. v. 目錄. ………………………………………………………………………………. 表目錄. ……………………………………………………………………………… vii. 圖目錄. ……………………………………………………………………………… vii. Chapter 1. Introduction…………………………………………………………………. vi. 1. 1.1 Research Motive………………………………………………………. 1. 1.2 Paper Review…………………………………………………………. 1. 1.3 Research Approach……………………………………………………. 6. Chapter 2. Preparation and Characterization of Clay/Epoxy Nanocomposites………. 7. 2.1 Preparation of Clay/Epoxy Nanocomposites……………………. 7. 2.2 Material Characterization…………………………………………. 8. 2.3 Tensile Behavior of Clay/Epoxy Nanocomposites……………………. 9. 2.4 Fracture Properties of Clay Nanocomposites. 10. Chapter 3. Preparation and Characterization Glass/Epoxy/Clay Nanocomposites … 3.1 Fabrication of Glass/Epoxy/Clay Nanocomposites…………………. 13 13. 3.2 Analytical Compliance Method for Mode I Interlaminar Fracture 13 Toughness 3.3. Interrlaminar. Fracture. Toughness. Properties. of. Clay/Epoxy 14. Nanocomposites 3.4 Off-axis Test of Clay/Epoxy Nanocomposites Chapter 4. Conclusion……………………………………………… 4.1 Conclusion………………………………… Reference ………………………………………………………………………………. vi. 16 17 17 18.
(9) LIST OF TABLES Table01. Table02. Table03. Table04. Table05. Table06. Table07. Table08. Table09. Table010. Table011.. Young’s modulus obtained from tensile test for epoxy resin and nanocomposites. ..............................................................................................................................24 Fracture toughness for nanocomposites with 2.5 wt% organoclay.......................24 Fracture toughness for nanocomposites with 5.0 wt% organoclay.......................24 Fracture toughness for nanocomposites with 7.5 wt% organoclay.......................25 Fracture toughness for neat epoxy. .......................................................................25 Interlaminar fracture toughness for composites laminates ...................................25 Interlaminar fracture toughness for nanacomposites with 5.0 wt% organoclay...25 Failure stress for composites and nanocomposites with 5.0 wt% organoclay (case 1)...........................................................................................................................26 Failure stress for composites and nanocomposites with 5.0 wt% organoclay (case 2)...........................................................................................................................26 Failure strain for composites and nanocomposites with 5.0 wt% organoclay (case 1)...........................................................................................................................27 Failure strain for composites and nanocomposites with 5.0 wt% organoclay (case 2)...........................................................................................................................27. LIST OF FIGURES Fig 1.1. Fig. 2.1 Fig. 2.2 2.2 Fig. 2.3 Fig. 2.4 Fig. 2.5 Fig. 2.6 Fig. 2.7 Fig. 2.8 Fig. 2.9. Schematic illustrations of three possible types of polymer-clay nanocomposites ((a) conventional composites, (b) intercalated nanocomposites and (c) exfoliated nanocomposites) X-ray diffractions scans for neat clay and nanocomposites with 2.5 wt%, 5.0wt% and 7.5 wt% organoclay………………… TEM micro-photo for the epoxy/organoclay nanocomposites ((a) 50,000 magnification, (b) 200,000 magnification)………………………………….. TEM micro-photo for the epoxy/organoclay nanocomposites ((b) 200,000 magnification)………………………………….. Specimen configurations for tensile tests (unit: mm)………… Stress and strain curves for neat and nanocomposites with three different loading of organclay…………….. SENB specimens for mode I fracture tests…………… Photo of the experimental setup for the three point bending test…. Displacement and force curves for nanocomposites with 5 wt% organoclay loading in three point bending test………………………………….. Fracture toughness of the nanocomposites with different organoclay loading Optical microscope of neat epoxy in fracture tests (50 magnification)……. vii. 28. 29 30 31 32 33 34 34 35 36 37.
(10) Fig. 2.10 Fig. 2.11 Fig. 2.12 Fig. 3.1 Fig. 3.2 Fig. 3.3 Fig. 3.4 Fig. 3.5 Fig. 3.6 Fig 3.7 Fig 3.8 Fig 3.9. Optical microscope of nanocomposites with 5.0 wt% Organoclay in fracture tests (50 magnification, crack propagation is downward) SEM photomicrographs of neat epoxy in fracture tests (500 magnification). SEM photomicrographs of nanocomposites with 5 wt% organoclay in fracture test (500 magnification)……………………………………. The exponent, n , of composites for calculation interlaminar fracture toughness The exponent, n , of nanocomposites for calculation interlaminar fracture toughness………………………………………………. DCB specimens for interlaminar fracture tests………………….. Photo of experimental setup for interlaminar fracture test……………... The displacement and load curve of nanocomposites with 5.0 wt% organoclay The displacement and load curve of neat epoxy……………….. Interlaminar fracture toughness of the nanocomposites with 5.0 wt% Stress and strain curves for neat composites with five different angles Stress and strain curves for nanocomposites containing 5.0 wt% organoclay loading with five different angles. viii. 38 39 40 41 42 43 44 45 46 47 48 49.
(11) Chapter 1. Introduction 1.1 Research Motive Composites have been employed extensively in the industry, such as air-flight applications, shipbuilding, sport equipment and marine structures because of its low weight and relatively high stiffness.. The epoxy system is usually used as matrix of composites, and. organoclay with high aspect ratio and high stiffness employed to reinforce some mechanical properties of neat epoxy in recent years.. To investigate the effect of organoclay for epoxy. system, nanocomposites were fabricated to analyze the mechanical behavior in many studies. In order to fully understand the effect of organoclay, it is desired to investigate and characterize the change of mechanical behavior of nanocomposites after adding organoclay into neat epoxy system.. 1.2 Paper Review Polymer layered silicate nanocommposites have been studied for nearly 50 years, although the concept was first introduced by Toyota [1,2] , who discovered the possibility of building a nanocomposites from polyamide 6 and an organophilic clay. These new materials showed dramatic improvement in barrier properties, fire resistance, and mechanical properties. The crystalline structure of some clay, especially smectite clay, is layered and amenable to form organoclay because of the weak van der Waals bonding between layers. Smectite clays is composed of oxide layers with cations between layers and it contains layered silicate structure with the dimension of 1μm × 1μm × 1nm [3].. The layered. silicate has a modulus of 175 GPa (25 Msi) and has aspect ratios in the range of 100-1000. In general, the layers were usually in the form of the aggregation with a size of about 0.1~1 μm and their characteristic could absorb water but natural clay with epoxy could not form nanocomposites.. To swell d-spacing of clay and polymerize with epoxy together, the 1.
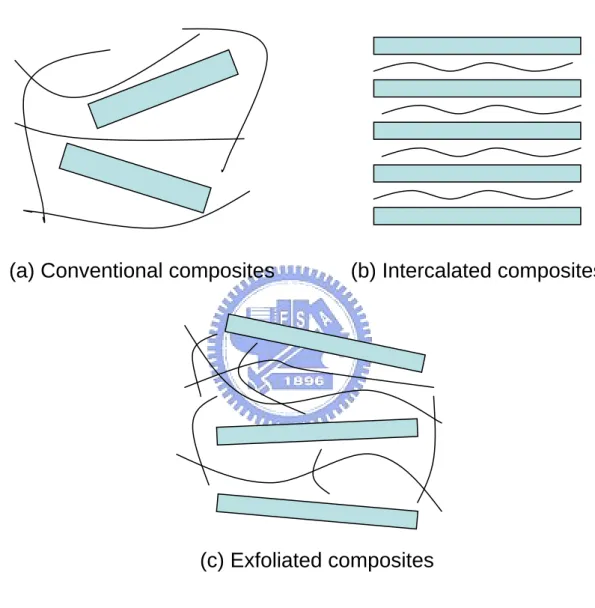
(12) inorganic interlayer cations have to be exchanged by hydrophobic cations [4] which are usually the alkyl ammonium group.. Through the ion exchange process, the sodium ions. attracted on the surfaces of the silicate were replaced with organic cations which can improve the interfacial adhesion between the polymer and the platelet and facilitate the exfoliation of the organoclay.. Without special processing, the platelets are held together by the weak ionic. bond into clay tactoids.. According to morphology of dispersion of clay, the. polymer/organoclay composites were divided into three types, i.e. conventional composites, intercalated nanocomposites and exfoliated nanocomposites [5,6]. The detailed illustrations are as follows: One, in the conventional composites, the clay particles existed in their original stacked state with no insertion of polymer matrix between the interlayers.. In this state, the. mechanical properties can not distinct change. Second, in the intercalated nanocomposites, the polymer is inserted into the clay structure between the galleries in a regular fashion. For exfoliated composites, the individual 1 nm thick clay layers are separated and the direction of clays were dispersed disorderly in a continuous polymer matrix.. There are three different. organoclay nanocomposites depending on the degree of the dispersion of the platelet as illustrated in figure 1.1. In general, several fabrication methods have been developed for forming the nanocomposites and three of them are utilized broadly in this field, i.e., melt compounding [7], in situ polymerization [8, 9] and solution method [10].. Melt compounding Over the past few years, melt compounding method was usually used for the fabrication of thermoplastic polymer/organoclay nanocomposites. In this method, blending the organoclay into polymer was carried out in twin screw extruder which controlled shear intensity by changing the screw configuration. 2. After blending of different shear intensity,.
(13) the organoclay was dispersed into polymer and then the polymer/organoclay was heated to increase the mobility of mixture during the mixing process. Finally, the polymer/organoclay was formed nanocomposites according to cured procedure of polymer. Solution method The first step, the organoclay was dissolved in solvent in this method, and then polymer was added and mixed well using mechanical blender or sonicator. This process can modify the organoclay and reduces particle agglomeration. Second step, the mixture is heated to remove solvent in the vacuum.. Finally, the curing agent is added to mix well with. the mixture and then it is cured following a proper curing cycle. However, this method is rarely used to fabricate nanocomposites in recent years because it can not fully remove solvent.. In situ polymerization In situ polymerization method is an efficient method and is used extensively for the preparation of nanocomposites. It was composed of two steps: swelling and polymerization. In swelling step, monomer molecules were allowed to diffuse into organoclay galleries by the proper equipment, such as sonicator, stirrer and three roll mills, and then the d-spacing increased gradually.. In polymerization step, the large polymer molecules occurred between. the layers of silicate when the epoxy and hardener were mixed well, and then the intercalated or exfoliated nanocomposites was formed after the curing procedure.. The main purpose of the above processes is to have dispersed and exfoliated organoclay in the nanocomposites since experimental observations show that the material stiffness of the nanocomposites can be enhanced if the platelets are well dispersed and that little improvement would be obtained if the platelets are lumped together [7, 11]. Miyagawa et al. [12] fabricated completely exfoliated nanocomposites using solvent solution during the 3.
(14) sonication process.. However, the intercalated nanocomposites were prepared through. mechanical stir of the organoclay and epoxy mixture.. Pluart et al. [13] found that the. dispersive situation of organoclay was affected by the reaction between the organoclay and its dispersion medium.. Tsai and Sun [14] performed a theoretical analysis indicating that well. exfoliated organoclay in the polymer can significantly enhance the load transfer efficiency in the nanocomposites.. The characterization and modeling of material stiffness of. polymer/clay nanocomposites was found in the references [15-18].. No matter from. analytical models or from experimental results, it was concluded that the material stiffness of nanocomposites is increasing with the increase of the organoclay contents if the organoclay is exfoliated in the polymers. However, for the fracture toughness, there were no consistent results obtained regarding the organoclay effect.. Some results have indicated that the fracture toughness increases with. the increase of the organoclay contents in the polymers [19-23].. Nevertheless, the others. demonstrated adverse trends for the organoclay effect on the fracture toughness [24-27]. Another observation from Pluart et al. [13] and Miyagawa and Drzal [28] reported that the fracture toughness can be improved by organoclay aggregation.. Moreover, the fracture. toughness increased with the increasing organoclay content up to 1.5 vol% and then reached a plateau.. On the other hand, for completely exfoliated nanocomposites, fracture toughness. was an inferior behavior because it is easy to break the individual nano-platelets. In addition, Balakrishnan et al. [29] reported that the improvement of toughness for the samples with organoclay modification was unapparent, however, for the specimens with rubber, it become obvious.. This discrepancy could be due to the organoclay morphology within the polymer.. The addition of organoclay platelets, if not well exfoliated, can create weak spots which are prone to the failure initiation.. Some reports that there is an enhancement effect on both. Young’s modulus and fracture toughness for the epoxy nanocomposites modified with organoclay and rubber as compared to the epoxy resin [19, 24]. 4. Thus, the efficiency of.
(15) utilizing organoclay to increase the fracture toughness of a polymer still remains an unidentified question. It is required to revisit this problem again by performing several fracture tests on the epoxy/clay nanocomposites with different loadings of organoclay. The morphology of the organoclay organization and the associated fracture surface around the crack tip will be examined with care using TEM and SEM, respectively. In past decades, most of the efforts related to nanocomposites were dedicated on the polymers and their organoclay compounds; nevertheless, few works concerning the effect of the organoclay on of the conventional fiber reinforced composites have been carried out. Haque et al. [30] investigated the interlaminar shear strength, flexural properties as well as the fracture toughness for both conventional glass/epoxy composites and glass/epoxy nanocomposites with low loading of organoclay. It was indicated that with dispersing 1 wt% organoclay, glass/epoxy nanocomposites exhibited mechanical properties rather than the conventional one.. However, when the organoclay loading is over 5%, there were not. effective enhancements in mechanical properties observed.. Becker et al. [31] performed. fracture tests on epoxy/clay nanocomposites and ternary carbon fiber/epoxy/clay nanocomposites.. It was indicated that the fracture toughness for both material systems. increases with the increases of clay contents until the loading up to 5 wt%.. Moreover,. apparent higher fracture toughness was found in the neat nanocomposites rather than in the fiber nanocomposites system associated to the same clay loading. It is interesting to note that with the addition of organoclay in the fiber/epoxy composites, the interfacial bonding between the fiber and matrix is considerable enhanced [30, 31]. One of the most frequently problems in composite laminates is interface cracking, sometimes also known as delamination. Delaminations in layered composite materials may occur due to a variety of reasons, such as low energy impact, manufacturing defects, or high stress concentration at geometric or material discontinuities.. Therefore, considerable efforts have been devoted to. characterization of delamination resistance. The double cantilever beam (DCB) has been 5.
(16) standardized for measuring the mode I critical energy release rate, GIC, of unidirectional specimens [32,33]. To investigate the effect of organoclay for conventional composites in this study, the interlamninar fracture test and off-axis test were applied.. 1.3 Research Approach To understand the effect of organoclay for epoxy system, the specimens of nanocomposites with three contents of organoclay were prepared using sonication method for investigation the change of mechanical behavior.. To effectively determine the dispersive. morphology of organoclay, the Transmission Electron Microscope (TEM) and X-ray Diffraction method were applied extensively in this field. The glass/epoxy/organoclay was employed to fabricate nanocomposites laminates by hand-lay up method for investigation the interlaminar fracture toughness and mechanical behavior.. All the details about the. experimental procedures and results will be presented in the next chapters.. 6.
(17) Chapter 2. Preparation and Characterization of Clay/Epoxy Nanocomposites 2.1 Preparation of Clay/Epoxy Nanocomposite The epoxy resin used in this study is diglycidyl ether of bisphenol A (DGEBA, EPON828 with an epoxy equivalent weight of 187), obtained from Resolution Performance Products. The hardener is a polyoxypropylenediamine (Jeffamine D-230 with a molecular weight of 230) provided by Huntsman Corp. The clay used for synthesis of nanocomposites is organoclay (Nanomer I.30E), purchased from Nanocor Inc.. It is basically an. octadecyl-ammonium ion surface modified montmorillonite mineral designed to be easily dispersed into amine-cured epoxy resin and to form nanocomposites [34]. The neat epoxy was fabricated by blending the epoxy with hardener (100:32 by weight) at room temperature for ten minutes using a mechanical stirrer with spindle speed of 100 rpm. The mixture was then degassed in the vacuum oven for 50 minutes at room temperature follow by another 40 minutes at 60˚C.. To form the epoxy specimens for mechanical testing,. the mixture was poured into the designed steel mold with Teflon coating on its surfaces. Subsequently, the samples were cured at 100˚C for 3 hours with additional 3 hours at 125˚C for post-curing. When preparing the epoxy/clay nanocomposite samples, the organoclay clay was dried in the vacuum oven for 6 hours at 90˚C in order to remove containing moisture.. The. organoclay was blended with EPON828 at 80˚C for 4 hours using a mechanical stirrer at 800 rpm.. The mixture was then sonicated for 30 minutes using a sonicator incorporation with. cooling system around the container until the compounds become transparent.. The. epoxy/clay mixture was degassed at room temperature for ten minutes in a vacuum oven and then 32 wt% curing agent was added into the mixture slowly. Again, the mechanical stirrer was utilized to blend the final mixture at room temperature for ten minutes.. The same. degassing and curing process used for pure epoxy resin was employed for the fabrication of the nanocomposites.. In the study, the nanocomposites containing 2.5%, 5% and 7.5% 7.
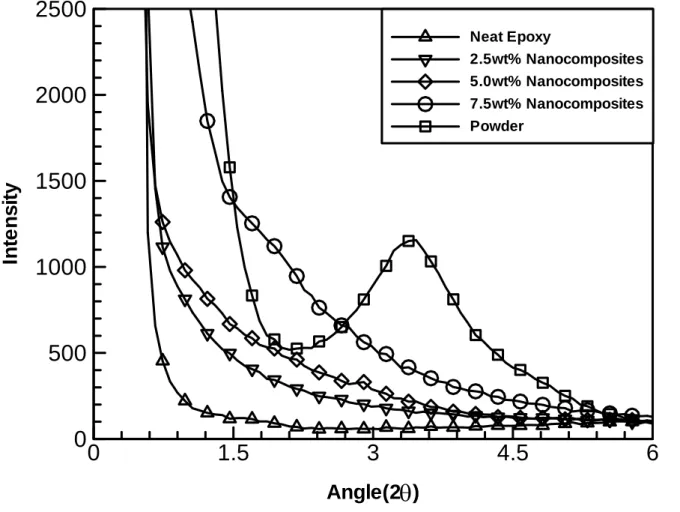
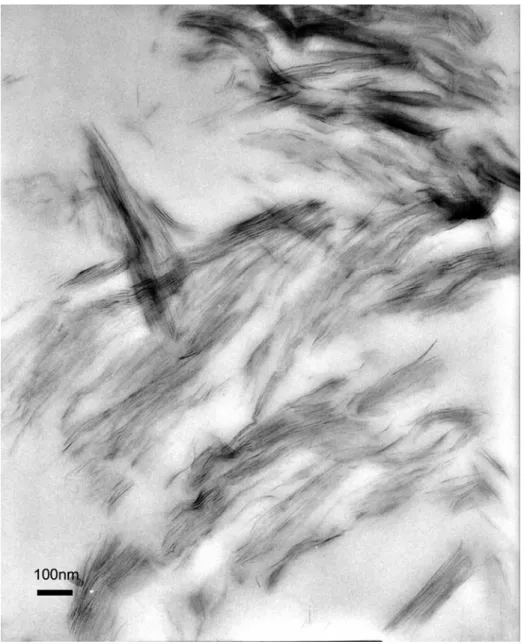
(18) loadings (by weight) of organoclay were investigated, respectively.. 2.2 Material Characterization In order to evaluate the degree of exfoliation of the organoclay in the epoxy resin, the samples were examined using X-Ray Diffraction (XRD) and Transmission Electron Microscope (TEM), which are widespread methods for characterizing nanocomposites. XRD measurements were conducted on neat epoxy and epoxy/clay nanocomposites films (about 4mm thick) using a Bede D1 diffractometer. The incident X-ray wavelength was 1.54Å, and the scanning speed and step size were 0.008/sec and 0.08˚, respectively.. Figure 2.1. shows the XRD patterns for the nanocomposites containing 5 wt% organoclay together with the organoclay and epoxy resin.. For organoclay, the reflection peak at 2θ =3.78° is. corresponding to the 2.3 nm interlayer spacing of the organoclay. However, there is no significant peak value found in the nanocomposites, which may be attributed to several possible reasons.. For example, some clay platelets may not exhibit significant basal. reflections and it is difficult to determine the intensity patterns as well as their relative peaks [20]. Thus, the XRD pattern may not be a full indication of the nanostructures of the nanocomposites, and to further understand the morphology of the nanocomposites, we resort to the assistance of Transmission Electron Microscope which can provide direct visualization of the spatial distribution of the organoclay. For TEM examination, several film samples of epoxy/organoclay nanocomposites (about 100 nm thick) were cut from tension specimen using a Reichert-Jung Ultracut E microtome and then the associated morphology were imaged using a JEOL 200CX transmission electron microscope at an accelerating voltage of 120KV. Two different magnifications, 50k, and 200k, were taken for the observations and the results were shown, respectively in Figure 2.2.. At low magnification, it was found that most of the. clay is aggregated together in the form of cluster structures in some regions.. However, there. are other regions where there are no distinct clay platelets observed.. Based on these. 8.
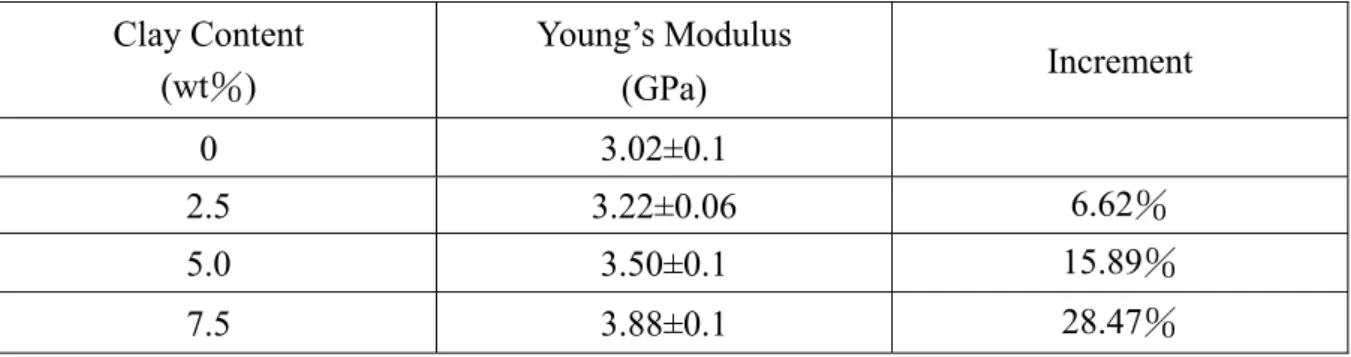
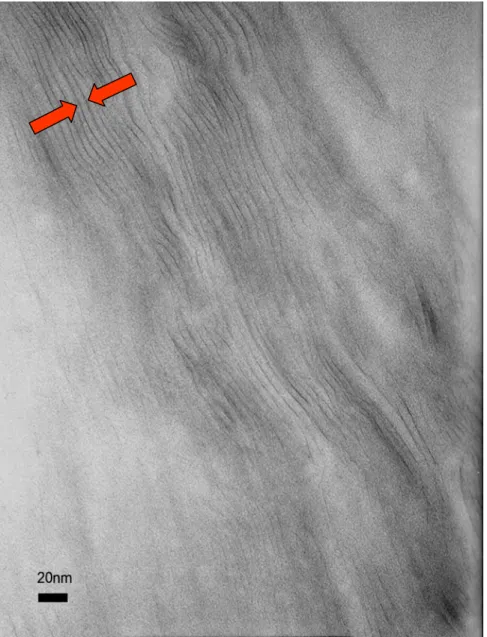
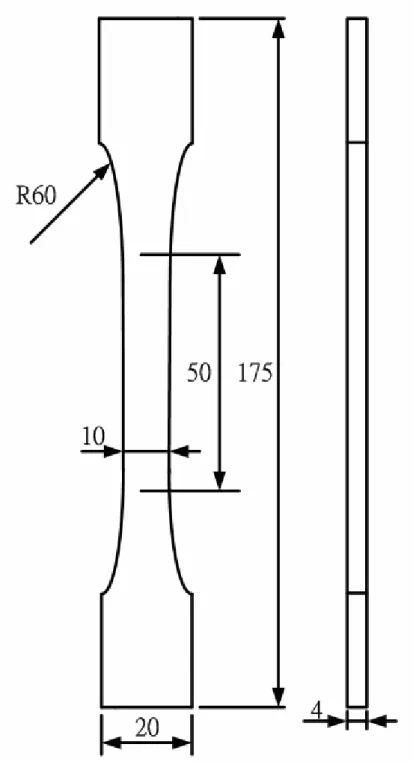
(19) micrographic observations, it is depicted that the platelets are not dispersed well and distributed homogeneously in the nanocomposites.. From the higher magnification. micrographics, the interlayer spacing of the clay was estimated around 5 nm as indicated by the arrows.. Moreover, few exfoliated organoclay layers were found individually in the. nanocomposites.. Thus, the XRD measurement and TEM observation suggest that the. present samples should be regarded as the intercalated nanocomposites.. 2.3 Tensile Behavior of Clay/Epoxy Nanocomposites To determine the effect of the organoclay on the mechanical properties, the tensile tests were performed on the bulk epoxy nanocomposites with three different loadings of organoclay, 2.5%, 5% and 7.5% by weight.. Coupon specimens as shown in Figure 2.3 were. fabricated using pre-designed mold with releasing agent on the surfaces and then tested in tension on the hydraulic MTS machine with stroke control at strain rate of 10-4/s.. Back to. back strain gages were mounted on the center of the specimens for the elimination of the possible bending effect and for the measurement of the strain history as well during the tensile tests.. The corresponding stress histories were obtained from the load cell mounted on the. loading fixture.. For comparison purpose, the bulk resin without any organoclay included. were prepared and tested in the same manner as those for organoclay epoxy. Figure 2.4 demonstrate the stress and strain curves for the pure epoxy and organoclay/epoxy systems. The corresponding Young’s moduli of the samples measured at strain level of 0.4% are summarized in Table 1. It was shown that the stiffness increases with the increase of the organoclay loadings.. However, the corresponding strains to failure decrease when the. organoclay loading increases.. The phenomena imply the epoxy may become more brittle. when the organoclay was dispersed in its system. Thus, the organoclay may enhance the stiffness of the epoxy resins with the scarification of their ductility.. 9.
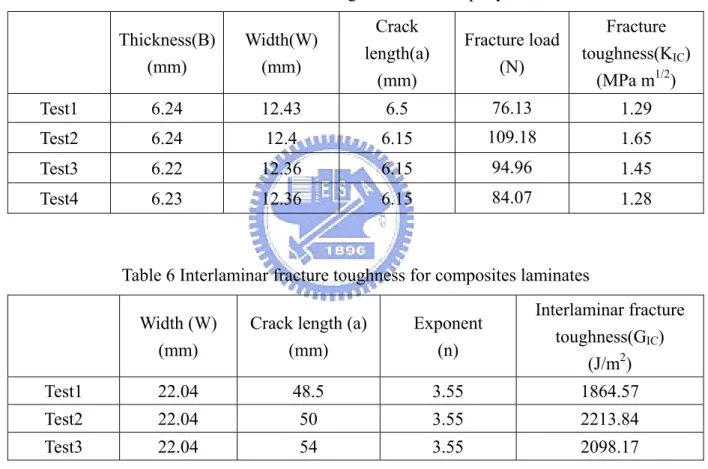
(20) 2.4 Fracture Properties of Clay/Epoxy Nanocomposites In the forgoing tensile tests, the nanocomposites demonstrate higher stiffness with low ductility.. To further investigate the effect of the organoclay on the fracture toughness (KIC). of the nanocomposites and their failure mechanisms, the single-edge-notch bending (SENB) specimens was adopted for the fracture tests according to ASTM D5054 [35].. The. dimension of the specimens was illustrated in Figure 2.5 where B is the thickness, and W is the width of the sample.. The pre-crack length, a, was created by a jewel saw followed by a. new razor blade to have a sharp pre-crack tip. The correlations of the dimensions, W = 2B and a = B suggested by ASTM D5054 were followed in the preparation of SENB specimen with the thickness B around 6.2 mm.. Again, three different loadings of organoclay, 2.5%,. 5% and 7.5% by weight were added in the epoxy resin using the same manner described previously. It is noted that in order to measure a valid plane strain fracture toughness, the inequality equation. (1). B, a , ( W − a ) > 2.5( K I / σ y ) 2. must also to be satisfied. In eqn (1), KI denote the trial KIC value and σy is the yield stress of the samples obtained from the tensile tests. Based on the load and deflection curve obtained from the three point bending tests, the fracture toughness of the SENB samples can be calculated using the following formulation [36]. KI =. PI. B W. f (x) = 6x. 0.5. f (x). [1.99 − x(1 − x)(2.15 − 3.93x + 2.7x )] 2. (1 + 2x )(1 − x ). 3. (2). 2. where PI is the fracture load for brittle epoxy system and x indicates the pre-crack length a divided by the width of the samples.. The fracture tests were carried out on the 10.
(21) servo-electrical control machine (HT-2102BP) at displacement rate of 0.05 mm/min. Figure 2.6 shows the photos of the experimental setup.. The typical force versus displacement. curves for the nanocomposites containing 5 wt% organoclay obtained in the three point bending tests were shown in Figure 2.7.. It was found that the experimental data are quite. linear during the loading process and then drop suddenly and dramatically when the crack initiates.. The peak value of the force was employed as the fracture load for the calculation. of the fracture toughness in eqn (2).. The calculated fracture toughness based on the three. point bending test for the 5 wt% organoclay nanocomposites were listed in Table2 together with the detail specimen dimensions.. Similar results were also observed in the other. samples with 2.5% and 7.5% organoclay loadings and the results were also presented in Tables 3 and 4, respectively. For comparison purpose, the same experimental procedures were performed on the pure epoxy resin and the results were shown in Table 5. Figure 2.8 demonstrate the variations of the fracture toughness of the nanocomposites with different organoclay loading.. Apparently, the fracture toughness of the nanocomposites is decreased. considerably with the addition of the organoclay. This reduction in toughness is almost the same for the nanocomposites containing different loadings of organoclay. This observation could be could be attributed to several reasons. One of the possibilities is that the plastic deformation around the crack tip is constrained by the organoclay such that the sudden brittle fracture takes place.. The other may be the poor interface adhesion between the organoclay. and epoxy resin in the nanocomposites causing the crack initiation easily.. Figures 2.9 and. 2.10 show the fracture surfaces of the pure epoxy and 5 wt% organoclay nanocomposites examined using an optical microscope. figures.. It is noted that all crack propagates downward in the. There are significant river-type marks found on the pure epoxy samples; however,. for epoxy/organoclay samples, the surfaces are quite featherless and smooth. were observed on 2.5% and 7.5% organoclay samples.. Similar results. It seems that more plastic. deformation occurring near the crack tip of the pure epoxy resin providing relatively higher 11.
(22) fracture toughness.. Figures 2.11 and 2.12 show the SEM photos of the fracture surfaces of. the pure epoxy resin and the nanocomposites with 5 wt% loading of organoclay, respectively. It is interesting to note that scale-like patterns were observed on the nanocomposites which may be resulted from the poor interfacial bonding between the organoclay and epoxy or interlayer failure within the platelet clusters.. The debonding effect may considerably reduce. the fracture toughness of the nanocomposites. Thus, it is desired to enhance the interfacial bonding of the platelet and epoxy material, if the nanocomposites will be applied for structural materials.. In the future work, the present epoxy/organoclay will be employed as a. matrix phase to fabricate the conventional fiber reinforced composites and the organoclay effect on the interlaminar fracture toughness of the composites will be investigated.. 12.
(23) Chapter 3. Preparation and Characterization of Glass/Epoxy/Clay Nanocomposites 3.1 Fabrication of Glass/Epoxy/Clay Nanocomposites The continuous glass fiber employed in this research is E-LR 0908, purchased from Vectorply Corporation. The dimension of glass fiber fabric was cut as length 190 mm and width 190 mm before the laminates were prepared.. The neat epoxy system and the. nanocomposites system with 5.0 wt% organoclay were respectively introduced as matrix of laminates in this study.. The pre-crack was created by using a 30 um non-adherent film. inserted into mid-plane of the laminates.. To obtain good interface bond between the fiber. and matrix, the glass fiber was immersed in the matrix system using the roller with many V-shape fillisters.. Finally, the specimen with 16 plies was stacked by hand lay up method.. The molding temperature of laminates is the same as that used for the epoxy specimens discussed previously. In addition, the vacuum bag technology was used to remove possible bubbles embedded in the laminates.. During the cured procedure, 20 psi of pressure was. applied directly on the composites laminate, however, for the nanocomposite laminate, the pressure is 80 psi, because of the lower mobility of nanocomposites laminates.. The. thickness of the composites and the nanocomposites are 4.49mm and 3.93mm respectively.. 3.2 Analytical Compliance method for Mode Interlaminar Fracture Toughness Three data reduction methods for calculating mode I interlaminar fracture toughness have been extensively used in the literature [36,37].. These methods are modified beam. theory, a compliance method and modified compliance calibration method. compliance method was applied [38,39].. In this study, the. The strain energy release is defined by:. G=−. dU dA. (3). Assuming linear elastic behavior the following expression can be derived for the strain energy rate G in a plate.. 13.
(24) G=. P 2 dC 2W da. (4). where P as the applied load, W stands for specimen width, a is the crack length and C is the compliance which is defined by:. C=. δ P. (5). Where δ being the displacement. Eqn (4) at failure becomes: GIC =. PC2 dC 2W da. (6). where PC is the load at failure and GIC is the critical strain energy release rate in Mode I. The Berry’s approach as mentioned above uses a plot of compliance C against crack length a, on a log-log plot [40]. A straight line fit to this curve gives: C=Zan. (7). By substituting equation (7) and (5) into equation (6) gives:. GIC =. nPC δ 2Wa. (8). where n obtained from the slope of this line according to a log compliance over log crack length as shown in Figures 3.1 and 3.2, respectively.. 3.3 Interlaminar Fracture Toughness Properties of Clay/Epoxy Nanocomposites. In the previous fracture tests shown in Chapter 2, the mechanical properties of nanocomposites became more brittle when the organoclay added into epoxy system. In order to understand the effect of organoclay on the long fiber composites and its failure mechanisms, the double-cantilever-beam (DCB) specimens were employed for interlaminar Mode I fracture tests according to ASTM D5528 [41]. The dimension of DCB specimen were cut total length 160 mm and width 22.04 mm by using diamond saw from composites or nanocomposites laminates and it was depicted in figure 3.3, where W is width of specimens, h represents the thickness and L stands for the total length of sample. The pre-crack created to. 14.
(25) use a non-adherent film of 30 um thickness was inserted to introduce an artificial mid-plane. The piano hinge was utilized to bond the end of specimen for transmissions the force during fractures tests. The 906 epoxy purchased from Nan Pao Corporation with excellent adhesion characteristic was applied for bonding the hinges to the surfaces of the specimens. Moreover, to have good bonding, the bonding surfaces of the specimens and the hinges was scratched with knife such that the rough surfaces were presented. To observe the crack extension, both sides of specimen were polished and marked every 1 mm from the crack tip. For each DCB specimen, three fracture tests were conducted. All tests were performed on HT-2102BP machine at stroke rate of 0.1 mm/min, and the displacement and loading curves were recorded by PC computer.. According to experimental data, we generate a least squares plot of. compliance versus crack length on log-log scale for the determination of parameter n in eqn (7). Figure 3.1 and 3.2 respectively show the vale of n for composites and nanocomposites sheet with 5 wt% organoclay. Figure 3.4 exhibits the pictures of experimental setup and the displacement verse force curve of nanocomposites laminate was showed in figure 3.5. In addition the experimental data for the nanocomposites is shown in Figure 3.6. When the crack extended, the value of force almost remained constant or slowly decreased and it was employed as critical load in equation (8) for calculating the interlaminar fracture toughness. Table 6 and Table 7 list the interlaminar fracture toughness of composites and nanocomposites laminates calculated from equation (8).. The interlaminar fracture toughness of the. nanocomposites with 5.0 wt% organoclay as well as the conventional composites are shown in Figure 3.7. It was observed that the interlaminar fracture toughness of the composites with organoclay matrix was lower than that of the conventional composites. This tendency is similar to that observed in the pure epoxy cases discussed in the Chapter 2.. The. decreasing behavior of the nanocomposites could also be ascribed to the brittle behavior of the matrix caused by the inclusion of the organoclay.. 15.
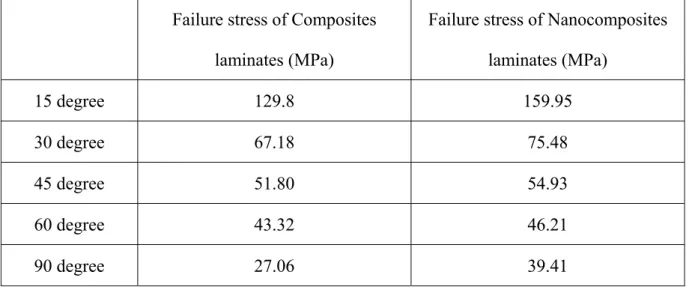
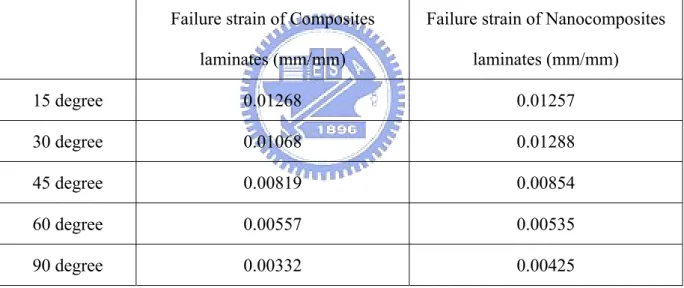
(26) 3.4 Off-Axis Tests of Clay/Epoxy Nanocomposites. In addition to the fracture toughness of the composites, we also investigate the effectof the organoclay on the failure stress of the off-axis laminates. This is examined because the mechanical behavior of the off-axis composite is mainly dominated by the matrix properties and its adhesion to the fibers. If the corresponding matrix properties can be modified by the organoclay, the off-axis performances could be enhanced. The off-axis specimens were prepared from the unidirectional glass/epoxy and glass/epoxy/organoclay composites panels with 6 fiber plies included. The curing pressure used for these specimens is the same as those in the DCB specimens. The thickness of the composites and the nanocomposites are 1.67mm.. All tensile specimens are cut with length 150 mm and width 18 mm from the. composites and nanocomposites panels using diamond saw. Oblique tabs made of glass fiber composites was adherent on the two sides at the ends of the specimens. To understand the effect of organoclay on conventional composites, off-axis specimens with five different degrees, 15∘, 30∘, 45∘, 60∘and 90∘were tested in tension.. The strain gage was. pasted the central surface of specimens to record strain histories during the tension test. All specimens were curried out tensile tests employing MTS 810 machine at stroke rate of 10-4 mm/min. The stress-strain curves of composites and nanocomposites laminates were separately showed in figure 3.8 and figure 3.9. Moreover, their mechanical properties obtained from tensile tests are listed in Table 8. Based on the data presented in this paper, the failure stresses of nanocomposites increase with the inclusion of organoclay.. 16.
(27) Chapter 4 Conclusions 4.1 Conclusions. In this study, the epoxy based organoclay nanocomposites and the glass fiber/organoclay/epoxy hybrid nanocomposites were fabricated. The tensile behaviors as well as the fracture toughness of the nanocomposites were examined from simple tension tests and the fracture tests. The following are the conclusions summarized from our works. 1. The mechanical blending followed by the sonication is an effective process for dispersing the organoclay into epoxy resin and the platelet spacing measured using TEM and XRD is around 5-7 nm. 2. For pure resin with organoclay, the Young’s modulus increases with the inclusion of organoclay. Moreover, the yielding as well as the failure stress is also increased with the increment of the organoclay, however, the failure strain is decreasing. From the Mode I fracture test conducted on the specimens of pure epoxy, there are apparent plastic deformation marks observed on the failure surfaces.. In contract, for the epoxy/organoclay. nanocomposites, the failure surface are featureless which indicates that the inclusion of organoclay alter the failure mechanism to brittle fracture. 3. The decreasing tendency of fracture toughness also observed in the glass fiber/organoclay/epoxy nanocomposites when Mode I fracture were conducted on the DCB specimens. Thus it was suggested that in the current nanocomposites system, the fracture toughness is relatively poor as compared to the conventional composites system without any organoclay included. 4. From the off-axis tensile tests, it was found that glass fiber/organoclay/epoxy nanocomposites exhibit higher tensile strength than the conventional one. This enhancement could be due to organoclay effect and more investigations on this issue are required to understand the enhancing mechanism.. 17.
(28) Reference:. [1] Usuki, A., Kawasumi, M., Kojima, Y., Okada, A., Kurauchi, T. and Kamigaito, O. 1993 “Swelling Behavior of Montmorillonite Cation Exchanged for ω-amino Acids by ε-caprolactam”, Journal of Materials Research, Vol. 8, No. 5, pp. 1174-1178.. [2] Usuki, A., Kojima, Y., Kawasumi, m, Okada, A., Fukushima, Y. Kurauchi, T. and Kamigaito, O. 1993 “Synthesis of Nylon 6 Clay Hybrid”, Journal of Materials Research, Vol.8, No. 5, pp. 1179-1184.. [3] Park, J. H. and Jana, S. C. 2003 “Mechanism of Exfoliation of Nanoclay Particles in Epoxy-Clay Nanocomposites”, Macromolecules, Vol. 36, No. 8, pp. 2758-2768.. [4] Padmananda, T. L., Kaviratna, D. and Pinnavaia, T. J. 1995 “Mechanism of Clay Tactoid Exfoliation in Epoxy-Clay Nanocomposites”, Chemistry of Materials, Vol. 7, No. 11, pp. 2144-2150.. [5] Daniel, I. M., Miyagawa, H., Gdoutos, E. E. and Luo, J. J. 2003 “Processing and Characterization of Epoxy/Clay Nanocomposites”, Society for Experimental Mechanics, Vol. 43, No. 3, pp. 348-354.. [6] Dennis, H. R., Hunter, D. L., Chang, D., Kim, S., White, J. L., Cho, J. W., and Paul, D.R., 2001 “Effect of Melt Processing Conditions on the Extent of Exfoliation in Organoclay Based Nanocomposites”, Polymer, Vol. 42, No. 23, pp. 9513-9522.. [7] Cho, J.W. and Paul, D.R. 2001 “Nylon 6 Nanocomposites by Melt Compounding”, Polymer, Vol. 42, No. 3, pp. 1083-1094.. [8] Chin, I. J., Thurn-Albrecht, T., Kim, H. C., Russell, T. P. and Wang, J. 2001 “On. 18.
(29) Exfoliation of Montmorillonite in Epoxy”, Polymer, Vol. 42, No. 13, pp. 5947-5952.. [9] Ratna, D., Manoj, N., Varley, R., Raman, R. S. and Simon, G. 2003 “Clay-Reinforced Epoxy Nanocomposites”, Polymer International, Vol. 52, No. 9, pp. 1403-1407.. [10] Yano, K., Usuki, A., Okada, A., Kurauchi, T. and Kamigaito, O. 1993 “Synthesis and Properties of Polyimide-Clay Hybrid”, Journal of Polymer Science: Part A: Polymer Chemistry, Vol. 31, No. 10, pp. 2493-2498.. [11] Okada, A. and Usuki, A. 1995, “The Chemistry of Polymer-Clay Hybrids,” Materials Science and Engineering C, Vol. 3, No. 2, pp.109-115.. [12]Miyagawa, H., Misra, M., Drzal, L. T. and Mohanty, A. K. 2005 “Biobased Epoxy/Layered Silicate Nanocomposites: Thermophysical Properties and Fracture Behavior Evaluation”, Journal of Polymer and the Environment, Vol. 13, No. 2, pp. 87-96.. [13] Pluart, L. L., Duchet, J. and Sautereau, H. 2005 “Epoxy/Montmorillonite Nanocomposites: Influence of Organophilic Treatment on Reactivity, Morphology and Fracture Properties”, Polymer, Vol. 46, No. 26, pp. 12267-12278.. [14] Tsai, J. and Sun, C.T. 2004 “Effect of Platelet Dispersion on the Load Transfer Efficiency in Nanoclay Composites”, Journal of Composite Materials, Vol. 38, No. 7, pp. 567-579.. [15] Luo, J. J. and Daniel, I.M., 2003 “Characterization and Modeling of Mechanical Behavior of Polymer/Clay Nanocomposites”, Composites Science and Technology, Vol. 63, No. 11, pp. 1607-1616.. 19.
(30) [16] Fornes, T. D. and Paul, D. R. 2003 “Modeling Properties of Nylon 6/Clay Nanocomposites Using Composite Theories”, Polymer, Vol. 44, No. 17, pp. 4993-5013.. [17] Fertig Ⅲ, R. S. and Garnich, M. R. 2004 “Influence of Constituent Properties and Microstructural Parameters on the Tensile Modulus of a Polymer/Clay Nanocomposites”, Composites Science and Technology, Vol. 64, No. 16, pp. 2577-2588.. [18] Sheng, N., Boyce, M. C., Parks, D. M., Rutledge, G. C., Abes, J. I. and Cohen, R. E. 2004 “Multiscale Micromechanical Modeling of Polymer/Clay Nanocomposites and the Effective Clay Particle”, Polymer, Vol. 45, No. 2, pp. 487-506.. [19] Liu, W., Hoa, S. V., and Pugh, M. 2004 “Morphology and Performance of Epoxy Nanocomposites Modified with Organoclay and Rubber”, Polymer Engineering and Science, Vol. 44, No. 6, pp. 1178-1186.. [20] Liu, T., Tjiu, W. C., Tong, Y., He, C. and Goh, S. S. 2004 “Morphology and Fracture Behavior of Intercalated Epoxy/Clay Nanocomposites”, Journal of Applied Polymer Science, Vol. 94, No. 3, pp. 1236-1244.. [21] Zerda, A. S. and Lesser, A. J. 2001 “Intercalated Clay Nanocomposites: Morphology, Mechanics, and Fracture Behavior”, Journal of Polymer Science Part B: Polymer Physics Vol. 39, No. 11, pp. 1137-1146.. [22] Miyagawa, H. and Drzal, L.T. 2003 “Fracture Behavior of Epoxy/Clay and Epoxy/Silica Nanocomposites”, the 14th International Conference on Composite Materials (ICCM-14), San Diego, California, July 14-18.. [23] Wang, W., Wu, J., Chen, L., He, C., and Toh, M. 2004 “Mechanical Properties and 20.
(31) Fracture Behavior of Epoxy Nanocomposites with Highly Exfoliated Pristine Clay”, ANTEC, pp 1820-1824.. [24] Gam, K. T., Miyamoto, M., Nishimura, R., and Sue, H. J. 2003 “Fracture Behavior of Core-Shell Rubber-Modified Clay-Epoxy Nanocomposites”, Polymer Engineering and Science, Vol. 43, No. 10, pp. 1635-1645.. [25] Lu, H., Roy, S., Sampathkumar, P. and Ma, J. 2002 “Characterization of the Fracture Behavior of Epoxy Nanocomposites.” Proceedings of The American Society for Composites, 17th Technical Conference, West Lafayette, Indiana, October 21-24.. [26] Nair, S. V., Goettler, L. A. and Lysek, B. A. 2002 “Toughness of Nanoscale and Multisclae Polyamide-6,6 Composites”, Polymer Engineering and Science, Vol. 42, No. 9, pp. 1872-1882.. [27] Chen, L., Wong, S. C., and Pisharath, S. 2003 “Fracture Properties of Nanoclay-Filled Polypropylene”, Journal of Applied Polymer Science, Vol. 88, No. 14, pp.3298-3305.. [28] Miyagawa, H. and Drzal, L. T. 2004 “The Effect of Chemical Modification on the Fracture Toughness of Montmorillonite Clay/Epoxy Nanocomposites”, Journal of Adhesion Science and Technology, Vol. 18, No. 13, pp.1571-1588.. [29] Balakrishnan, S., Start, P. R., Raghavan, D. and Hudson, S. D. 2005 “The Influence of Clay and Elastomer Concentration on the Morphology and Fracture Energy of Performed Acrylic Rubber Dispersed Clay Filled Epoxy Nanocomposites”, Polymer, Vol. 46, No. 25, pp. 11252-11262.. [30] Haque, A., Shamsuzzoha, M., Hussain, F. and Dean, D. 2003 “S2-Glass/Epoxy Polymer 21.
(32) Nanocomposites: Manufacturing, Structures, Thermal and Mechanical Properties”, Journal of Composites Materials, Vol. 37, No. 20, pp. 1821-1837.. [31] Becker, O., Varley, R. J., and Simon, G. P. 2003 “Use of Layered Silicates to Supplementarily Toughen High Performance Epoxy-Carbon Fiber Composites”, Journal of Materials Science Letters, Vol. 22, No. 20, pp. 1411-1414.. [32] Lindhagen, J. E and Berglund, L. A. 2000 “Application of Bridging-Law Concepts to Short-Fiber Composites Part 1: DCB Test Procedure for Bridging Law and Fracture Energy”, Composites Science and Technology, Vol.60, No. 6, pp. 871-883.. [33] Ducept, F., Davies, P. and Gamby, D. 1997 ”An Experimental Study to Validate Tests Used to Determine Mixed Mode Failure Criteria of Glass/Epoxy Composites”, Composites Part A: Applied Science and Manufacturing, Vol.28, No. 8, pp. 719-729.. [34] Nanocor Inc., Technical data sheet, http://www.nanocor.com/nanoclays.asp.. [35] ASTM D5054, Standard Test Method for Plane-Strain Fracture Toughness and Strain Energy Release Rate of Plastic Materials, Annual Book of ASTM Standards, 2001.. [36] Papanicolaou, G. C. and Bakos. D 1996 “Interlaminar Fracture Behavior of Sandwich Structures”, Composites Part A: Applied Science and Manufacturing, Vol. 27, No. 3 pp.165-173.. [37] Whitney, J. M., Browning, C. E. and Hoogsteden, W. 1982 ”A Double Cantilever Beam Test for Characterizing Mode I Delamination of Composite Materials”, Journal of Reinforced Plastics and Composites, Vol. 1, No. 4, pp. 297-313.. 22.
(33) [38] Kinloch, A. J. and Young, R. J. 1983 Fracture Behavior of Polymers, Elsevier Applied Science, London. [39] Hwang, W. and Han, K. S. 1989 “Interlaminar Fracture Behavior and Fiber Bridging of Glass-Epoxy Composite under Mode I Static and Cyclic Loading”, Journal of Composite Materials, Vol. 23, No. 4, pp. 396-430.. [40] Tzetzis, D., Hogg, P. J. and Jogia, M. 2003 ”Double Cantilever Beam Mode-I Testing for Vacuum Infused Repairs of GFRP”, Journal of Adhesion Science and Technology, Vol. 17, No. 3, pp. 309-328.. [41] ASTM D5528, Standard Test Method for Mode I Interlaminar Fracture Toughness of Unidirectional Fiber-Reinforced Polymer Matrix Composites, Annual Book of ASTM Standards, 2001.. 23.
(34) Table 1 Young’s modulus obtained from tensile test for epoxy resin and nanocomposites. Clay Content (wt%). Young’s Modulus (GPa). 0. 3.02±0.1. 2.5. 3.22±0.06. 6.62%. 5.0. 3.50±0.1. 15.89%. 7.5. 3.88±0.1. 28.47%. Increment. Table 2 Fracture toughness for nanocomposites with 2.5 wt% organoclay. Thickness(B) (mm). Width(W) (mm). Crack length(a) (mm). Fracture load (N). Fracture toughness(KIC) (MPa m1/2). Test1. 6.62. 13.28. 6.2. 72.49. 0.91. Test2. 6.67. 13.31. 5.8. 91.62. 1.04. Test3. 6.68. 13.25. 6.0. 78.87. 0.94. Test4. 6.66. 13.28. 6.0. 78.28. 0.93. Table 3 Fracture toughness for nanocomposites with 5.0 wt% organoclay. Thickness(B) (mm). Width(W) (mm). Crack length(a) (mm). Fracture load (N). Fracture toughness(KIC) (MPa m1/2). Test1. 6.09. 11.70. 5.75. 51.74. 0.80. Test2. 6.01. 12.10. 5.7. 51.30. 0.75. Test3. 5.98. 12.07. 5.7. 57.78. 0.85. Test4. 6.02. 12.12. 5.8. 50.42. 0.75. Test5. 6.04. 11.77. 5.4. 54.15. 0.77. 24.
(35) Table 4 Fracture toughness for nanocomposites with 7.5 wt %organoclay. Thickness(B) (mm). Width(W) (mm). Crack length(a) (mm). Fracture load (N). Fracture toughness(KIC) (MPa m1/2). Test1. 6.40. 12.84. 5.70. 68.27. 0.84. Test2. 6.41. 12.82. 5.60. 70.53. 0.85. Test3. 6.42. 12.81. 6.2. 58.86. 0.82. Test4. 6.43. 12.80. 5.60. 65.13. 0.78. Table 5 Fracture toughness for neat epoxy. Thickness(B) (mm). Width(W) (mm). Crack length(a) (mm). Fracture load (N). Fracture toughness(KIC) (MPa m1/2). Test1. 6.24. 12.43. 6.5. 76.13. 1.29. Test2. 6.24. 12.4. 6.15. 109.18. 1.65. Test3. 6.22. 12.36. 6.15. 94.96. 1.45. Test4. 6.23. 12.36. 6.15. 84.07. 1.28. Table 6 Interlaminar fracture toughness for composites laminates Width (W) (mm). Crack length (a) (mm). Exponent (n). Interlaminar fracture toughness(GIC) (J/m2). Test1. 22.04. 48.5. 3.55. 1864.57. Test2. 22.04. 50. 3.55. 2213.84. Test3. 22.04. 54. 3.55. 2098.17. Table 7 Interlaminar fracture toughness for nanocomposites laminates with 5.0 wt% organoclay Width (W). Crack length (a) mm. Exponent (n). Interlaminar fracture toughness(GIC). Test1. 22.04. 48. 1.99. 609.1. Test2. 22.04. 53. 1.99. 620.79. Test3. 22.04. 57. 1.99. 702.13. 25.
(36) Table 8 Failure stress for composites and nanocomposites with 5.0 wt% organoclay (case 1) Failure stress of Composites. Failure stress of Nanocomposites. laminates (MPa). laminates (MPa). 15 degree. 129.8. 159.95. 30 degree. 67.18. 75.48. 45 degree. 51.80. 54.93. 60 degree. 43.32. 46.21. 90 degree. 27.06. 39.41. Table 9 Failure stress for composites and nanocomposites with 5.0 wt% organoclay (case 2) Failure stress of Composites. Failure stress of Nanocomposites. laminates (MPa). laminates (MPa). 15 degree. 131.97. 157.56. 30 degree. 66.31. 76.79. 45 degree. 51.06. 56.25. 60 degree. 39.09. 41.29. 90 degree. 27.53. 39.41. 26.
(37) Table 10 Failure strain for composites and nanocomposites with 5.0 wt% organoclay (case 1) Failure strain of Composites. Failure strain of Nanocomposites. laminates (mm/mm). laminates (mm/mm). 15 degree. 0.00933. 0.01326. 30 degree. 0.00837. 0.01301. 45 degree. 0.00904. 0.01038. 60 degree. 0.00560. 0.00606. 90 degree. 0.00418. 0.00481. Table 11 Failure strain for composites and nanocomposites with 5.0 wt% organoclay (case2) Failure strain of Composites. Failure strain of Nanocomposites. laminates (mm/mm). laminates (mm/mm). 15 degree. 0.01268. 0.01257. 30 degree. 0.01068. 0.01288. 45 degree. 0.00819. 0.00854. 60 degree. 0.00557. 0.00535. 90 degree. 0.00332. 0.00425. 27.
(38) (a) Conventional composites. (b) Intercalated composites. (c) Exfoliated composites Figure 1.1 Schematic illustrations of three possible types of polymer-clay composites ((a) conventional composites, (b) intercalated nanocomposites and (c) exfoliated nanocomposites). 28.
(39) 2500 Neat Epoxy 2.5wt% Nanocomposites 5.0wt% Nanocomposites. 2000. 7.5wt% Nanocomposites. Intensity. Powder. 1500. 1000. 500. 0. 0. 1.5. 3. 4.5. 6. Angle(2θ). Figure 2.1 X-ray diffractions scans for neat clay, neat epoxy and nanocomposites with 2.5 wt%, 5 wt% and 7.5wt% organoclay.. 29.
(40) Figure 2.2 TEM micro-photos for the epoxy/organoclay nanocomposites ((a) 50,000 magnification).. 30.
(41) Figure 2.2 TEM micro-photos for the epoxy/organoclay nanocomposites ((b) 200,000 magnification).. 31.
(42) Figure 2.3 Specimen configurations for tensile tests (unit: mm).. 32.
(43) 70 60. Stress(MPa). 50 40 30 20 Neat Epoxy. 10. 2.5wt% Nanocomposites 5.0wt% Nanocomposites 7.5wt% Nanocomposites. 0. 0. 0.01. 0.02. 0.03. 0.04. 0.05. 0.06. 0.07. Strain. Figure 2.4 Stress and strain curves for neat epoxy and nanocomposites with three different loadings of organoclay.. 33.
(44) Figure 2.5 SENB specimens for mode I fracture tests.. Crack tip. Figure 2.6 Photo of the experimental setup for the three point bending test.. 34.
(45) 60 Nanocomposites Test1 Nanocomposites Test2. 50. Nanocomposites Test3 Nanocomposites Test4 Nanocomposites Test5. Force(N). 40 30 20 10 0. 0. 0.1. 0.2. 0.3. 0.4. 0.5. 0.6. Displacement(mm). Figure 2.7 Displacement and force curves for nanocomposites with 5 wt% organoclay loading in three point bending test.. 35.
(46) 1.8. 1.41. 1.6. KIC(MPa m1/2). 1.4 1.2 0.95. 1. 0.85. 0.82. 5. 7.5. 0.8 0.6 0.4 0.2 0 0. 2.5. Organoclay Content(wt% ). Figure 2.8 Fracture toughness of the nanocomposites with different organoclay loading.. 36.
(47) Crack tip. Figure 2.9 Optical microscope of neat epoxy in fracture tests (50 magnification).. 37.
(48) Crack tip. Figure 2.10 Optical microscope of nanocomposites with 5 wt% organoclay in fracture tests (50 magnification, crack propagation is downward).. 38.
(49) Figure 2.11 SEM photomicrographs of neat epoxy in fracture tests (500 magnification).. 39.
(50) Figure 2.12 SEM photomicrographs of nanocomposites with 5 wt% organoclay in fracture test (500 magnification).. 40.
(51) -3.9. Log C. -3.85 -3.8 -3.75 y=3.55+0.798. -3.7 -3.65 -1.26. -1.27. -1.28. -1.29 Log a. -1.3. -1.31. Figure 3.1 The exponent, n, of composites for calculation interlaminar fracture toughness. 41. -1.32.
(52) -3.98 -3.9. Log C. -3.82 y=1.99x-1.275. -3.74 -3.66 -3.58 -3.5 -1.2. -1.23. -1.26. -1.29. -1.32. -1.35. Log a Figure 3.2 The exponent, n, of nanocomposites for calculation interlaminar fracture toughness. 42.
(53) Figure 3.3 DCB specimens for interlaminar fracture tests. 43.
(54) Crack tip. Figure 3.4 Photo of experimental setup for interlaminar fracture test. 44.
(55) 100 90 80. Force(N). 70 60 50 40 30 20 Neat Epoxy Test 1 Neat Epoxy Test 2 Neat Epoxy Test 3. 10 0. 0. 2. 4. 6. 8. 10. 12. 14. 16. 18. 20. Displacement(mm). Figure 3.5 The displacement and load curve of nanocomposites with 5 wt% organoclay. 45.
(56) 80 70. Force(N). 60 50 40 30 20 5.0wt% Nanocomposites Test 1. 10 0. 5.0wt% Nanocomposites Test 2 5.0wt% Nanocomposites Test 3. 0. 2. 4. 6. 8. 10. 12. Displacement(mm). Figure 3.6 The displacement and load curve of neat epoxy. 46. 14. 16.
(57) 2500 2058.86. 2. GIC(J/m ). 2000 1500 1000. 644.005. 500 0 0. 5. Organoclay Content (wt%). Figure 3.7 Interlaminar fracture toughness of the nanocomposites with 5.0 wt% organoclay. 47.
(58) Stress(MPa). 150. 100. 50 Composites 15° Composites 30°. 0 0. Composites 45° Composites 60° Composites 90°. 0.0025 0.005 0.0075. 0.01. 0.0125 0.015. Strain. Figure 3.8 Stress and strain curves for neat composites with five different angles. 48.
(59) Stress(MPa). 150. 100. 50. 5 wt% nanocomposites 15° 5 wt% nanocomposites 30° 5 wt% nanocomposites 45° 5 wt% nanocomposites 60° 5 wt% nanocomposites 90°. 0. 0. 0.0025. 0.005. 0.0075. 0.01. 0.0125. Strain. Figure 3.9 Stress and strain curves for nanocomposites containing 5 wt% organoclay loading with five different angles. 49.
(60)
數據
+7

相關文件
To help students achieve the curriculum aims and objectives, schools should feel free to vary the organization and teaching sequence of learning elements. In practice, most
Biases in Pricing Continuously Monitored Options with Monte Carlo (continued).. • If all of the sampled prices are below the barrier, this sample path pays max(S(t n ) −
(1988), “Individual strategies for coping with stress during organizational transitions," Journal of Applied Behavioral Science, Vol.24, pp.19-36.. Paul (1983), “
The result indicated that the constitutive relationship among the flow stress, deformation temperature, and strain rate for IN 600 during hot deformation satisfied the
The product of the luminescent nano materials on the film were illuminated with LED and luminance value were measured with incident angles of 0 o 、30 o 、45 o 、60 o 、90 o..
The analysis of biomechanics after the total hip replacement can be reached by comparing with the stress and strain distribution of the intact femur and “Tripot Stemless Total
In different gender、time for study、time for cram、the parents education level and household income of junior high school students , some aspects of the academic stress were
(1980), A Conceptual Formulation for Research on Stress, In J.E.McGrat, Social and psychological factors in stress, New York: Holt Rinehart and Winston. (1982), “Counselor’s Role
