How Do Colors Influence the Haptic Perception of Textured Surfaces
8
0
0
全文
(2) haptic effects did not improve user performance in terms of task completion time. Psychophysical research into multisensory perception has shown ample evidence that visual information can alter haptic perception. An interesting illusion first observed in the late nineteenth century by Weber and recently reviewed by Sherrick [10] is that cold objects feel heavier than warm ones of equal weight [10]. In another experiment, the perceived size of an object appears to affect weight perception [11]. Therefore, it is important for the designers of multimodal interfaces to have a clear picture of what should and should not be done when designing a multimodal interface. Different factors contributing to the resultant effectiveness have to be carefully studied and adequately balanced. The mechanisms underlying human perception of information in each mode involved, and more importantly, the cross-interaction, or possibly, the interference, between the information, are important and therefore have to be studied. Introducing haptic interaction into current computer interfaces faces the same problem. Therefore, this paper presents the influence of the visual information, the colors, on the haptic perception of the textured surfaces. We chose to study color as a factor in the visual mode, considering its prevalence in today’s computer interfaces, and chose to study haptic textured surfaces as haptic effects in the haptic mode.. 2. on an underlying surface as the stimuli in the experiments. Two texture rendering methods, introduced by Massie [19], and Ho, Basdogan and Srinivasan [18], respectively, were used. The texturing rendering method used in this study was based on that introduced by Massie [19].. 3. General Methods. 3.1. Apparatus. The hardware setup consists of a PHANToM (Model: Premium EW) from SenseAble Technologies, a dual Pentium III PC operating on Window 2000 Professional platform and a wireless liquid crystal stereo shutter eyewear (Model: CrystalEyes 3) from StereoGraphics. This model of PHANToM has a maximum stiffness of around 1100 Newton seconds/meter and a workspace of 19.5cm × 27.0cm × 37.5cm. The shutter was used to enable subjects to see the 3D experiment environment.. Related Studies. In human sensing and manipulation of everyday objects, the perception of textured surfaces is fundamental to accurate identification of an object [12]. As the simulation of surface textural features in virtual environment became possible, the research on the perception of virtual textured surface strengthened. For example, the perception of haptic texture button and that of other three types of haptic buttons were studied and compared [13]. In another study, the effect of texture frequency on roughness perception was analyzed [14]. Minsky [15] pioneered in the work on synthetic texture rendering using a two-dimensional force feedback joystick. Successful implementations of texture rendering can also be found in [16][17]][18]. These are studies on the computational aspects of texture rendering. The stability problem of synthetic texture rendering was also studied [2]. Explored was the parameter space within which perceptually stable texture rendering can be achieved, using one-dimensional sinusoidal gratings superimposed. Figure 1 Hardware setup for the experiment The Reachin 3.0 API [20] from Reachin Technologies AB was used for programming the experimental environment, in which haptic interactions are made available through the PHANToM. The programming languages used for creating the 3D experiment environment are C++ (Borland C++ Builder 5.0), VRML (The Virtual Reality Modeling Language) and Python.. 3.2 3.2.1. Stimuli The Colors. Six types of colors (red, orange, yellow, blue, green and violet) are used as visual stimuli of the experiments. They were chosen because (1) they are most frequently used in computer interfaces; (2) they cover the range of spectrum perceivable by.
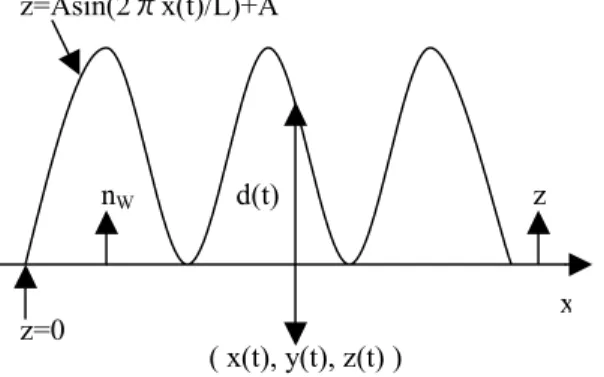
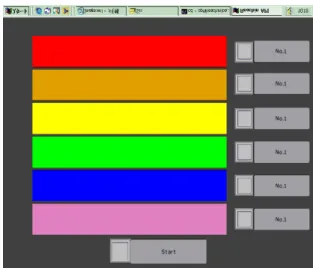
(3) the human visual system. 3.2.2. Haptic Textured Surfaces. The haptic stimuli used for the experiments are 6 one-dimensional sinusoidal gratings superimposed on 6 underlying boxes. Each of the boxes has an dimension of 17.0cm × 2.4cm × 0.2cm (L × W × D). To simultaneously accommodate 6 haptic textured surfaces and 7 selection buttons in our experiment environment, the boxes and 7 selection buttons are positioned such that they are at the xy plane located at z=7.0cm (outside towards the subjects) in the PHANToM coordinate frame. The sinusoidal gratings are described by z=Asin(2πx(t)/L)+A, where the A and L are the amplitude and the spatial wavelength, respectively (see Figure 2). z=Asin(2πx(t)/L)+A. nW. z=0. d(t). z. x ( x(t), y(t), z(t) ). Figure 2: An illustration of the textured surface and its associated variables. the stroking mode; (2) The stroking mode results in a more stable rendering of textured surfaces than the free exploration mode (see the discussion part of [2]). For all experiments described in this paper, amplitude A is fixed at 1.0mm. Because our PHANToM has a fairly larger value of stiffness K than that of Choi’s [2], it is fixed at 450 Newton seconds/meter for all experiments. Six wavelength Ls (L1, L2, L3, L4, L5 and L6) used are 1.0, 2.0, 3.0, 4.0, 5.0 and 6.0mm, each one being a possible candidate value to be used for each surface. The actual value each surface has will be decided randomly according to a 6 × 6 Balanced Latin Square orders described in the section 3.4.2.. 3.3. The experiment environment is shown in Figure 3. In it, there are 6 haptic textured surfaces and 7 selection buttons. The 6 selection buttons (answer buttons) to the right of the surfaces are used to give a ranking (described in section 3.4.2) for the roughness on the 6 surfaces. Eight experiments were conducted in this environment. There are totally 6 steps in each experiment and in each step a ranking is required as an answer.. 3.4 3.4.1. In Choi’s study [2], there are two kinds of texture rendering methods, F1(t) and F2(t), and two exploration methods, free exploration and stroking. We use the first method F1(t) in Choi’ s study [2] for texture rendering. The force F1(t) generated can be calculated as follows: 0, z(t)<0 d(t)= z(t)-Asin(2πx(t)/L)-A,. z(t)≥0. F1(t) = Kd(t)nW, where K is the stiffness of the surface, nW is the normal vector of the surface of the underlying box, (x(t), y(t), z(t)) are the coordinates of the stylus at time t, d(t) is the penetration depth of the stylus into the textured surface at time t. In our experiments, only the stroking mode (moving the stylus laterally across the textured surfaces) is allowed so as to guarantee a stable haptic rendering on each surfaces, because the results of Choi’s study [2] show that (1) F1(t) has a larger stable range of K (stiffness) than F2(t) for. Experiment Environment. Experiment Conditions The Color condition. When a color, for example, the red, is painted on all of the 6 textured surfaces, we call it as the color condition Red. There are 6 color conditions: Red, Orange, Yellow, Green Blue and Violet. There are two additional color conditions called 6Colors and NoColor. Figure 3 shows the layout of the experiment environment for the 6Colors condition. The surfaces from the top to the bottom are painted as red, orange, yellow, green, blue and violet, respectively. These colors will not change their positions on the surfaces from step to step described in the section 3.4.2. When a comparison is made, a standard must be specified. The last condition, NoColor, is set up as such a standard. In this condition, all of the 6 surfaces bear no color. But strictly speaking, there is no clear definition for such a concept as no color. We handle this problem by an approximation approach described as follows: The RGB values of the default background of a scene created by Reachin API 3.0 are (0.3, 0.3, 0.3). The RGB value of (0.3, 0.3, 0.31) was chosen to paint all the surfaces in the NoColor condition. The resultant visual effect is that surfaces.
(4) almost integrate with the background of the environment, with their profiles being marginally discernible. This gives the subjects of the experiments an idea of where each surface is so that they know which surface they are actually exploring. But the color information available is reduced to the minimum as a result of the almost identical RGB values used for both the background and the surfaces.. Step 5: (Order E) L5L3L1L6L4L2 Step 6: (Order F) L6L5L4L3L2L1 The advantage of this Latin Square is that (1) each of the 6 L values appears precisely once in each row and column; (2) each of the 6 L values appears before and after each other an equal number of time. Thus, the asymmetric transfer of skill from one step to another is eliminated.. 3.5. Hypotheses. It was hypothesized that the colors will influence the haptic perception of textured surfaces: (1) The error rate under different color conditions will differ. (2) Hopefully, comparing the error rate for NoColor condition with that for other color conditions will show significant difference.. 3.6. Figure 3. The layout of experiment environment for the 6Colors condition. Therefore, there are 8 color conditions: Nocolor, 6Colors, Red, Orange, Yellow, Green, Blue and Violet, each condition used for one and only one experiment.. 3.4.2. The Haptic Textured Surface Condition. Each of the 8 experiments terminates when 6 steps are completed (described below). The value of L for each surface varies from one step to another. Haptically, the larger the L, the rougher the surface feels. A 6 × 6 Balanced Latin Square is used to control the actual L value a specific textured surface should have. Specifically, assuming that when L1, L2, L3, L4, L5 and L6 are used for the 6 surfaces from the top to the bottom in Figure 3, respectively, the order is named as L1L2L3L4L5L6. The 6 × 6 Balanced Latin Square for the six L values is shown as follows: Step 1: Step 2: Step 3: Step 4:. (Order A) (Order B) (Order C) (Order D). L1L2L3L4L5L6. L2L4L6L1L3L5 L3L6L2L5L1L4 L4L1L5L2L6L3. The Experiment Task. At the beginning of each experiment, the selection button below the surfaces (bottom button) bears a prompt text “Start” and the 6 selection buttons (answer buttons) to the right of the surfaces have no prompt text on it (again, see the Figure 3). When “Start” button is pressed, its prompt text will disappear and the experiment (step 1) begins. As the “Start” button is pressed, the identical prompt text “No.1” will appear on all of the 6 answer buttons. When any of them is pressed, the prompt text “Verified” will appear on the bottom button. When the “Verified” button is pressed, the answers given on the answer buttons and time information are recorded into a log file and the step 2 is entered. Each of the 6 answer buttons can be set to either “No.1”, “No.2”, “No.3”, “No.4”, “No.5”, or “No.6”, by pressing it continuously. The subjects were asked to explore the surfaces horizontally to feel their roughness. For the surface judged as the roughest, the answer button to the right of it should be set to “No.6”. For the second roughest surface, “No5” should be set on the button to the right of the surface. The process repeats until “No.1” is set for the least rough surface. For example, for the step 1 (Order A), the subjects should set the answer buttons from the top to the bottom in Figure 3 as “No.1”, “No.2”, “No.3”, “No.4”, No.5” and “No.6”, respectively. The ranking now given is 123456, which is a correct answer for the haptic effects set on the 6 surfaces (any other ranking is counted as an error). Then the “Verified” button (bottom button) should.
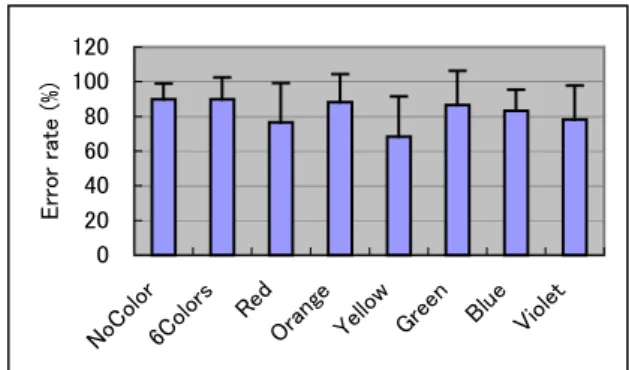
(5) Data Analysis. Statistical analyses were performed using SPSS 10.0 (SPSS Inc., USA). Data were expressed as mean ±SD. Comparisons of means for the error rates in the haptic perception of textured surfaces under different conditions were performed using the general linear model univariate procedure (color and order as two factors). The post hoc comparisons were made using LSD test. A value of p<0.05 was taken to indicate statistical significance.. 3.8. Subjects. Ten subjects, eight males and two females, aged from 18 to 36, participated in all of the 8 experiments. They were randomly divided into two groups. One group performed the experiments in the order of NoColor, 6Colors, Blue, Green, Orange, Red, Violet and Yellow. The other group performed the same experiments, but in the reversed order.. 4. Results. The mean error rate for the colors is shown in Figure 4. It can be seen that the error rate of yellow is the lowest among the color conditions; the error rate for the single color conditions (Red, Orange, Yellow, Green, Blue and Violet) is less than that for the NoColor condition; to our surprise, the error rate for 6Colors condition is no greater than that for NoColor condition. In order to analyze the statistical significance between pairs of color conditions, statistical analyses were performed using SPSS 10.0 (SPSS Inc., USA). The general linear model univariate procedure was used to provide the analysis of. 120 100 80 60 40 20 0 Re d Or an ge Ye llo w Gr ee n Bl ue Vi ol et. 3.7. Error rate (%). For each of 8 color conditions described above, one ranking is required as an answer in step 1, and then step 2 is entered. The process repeats until step 6 is finished and 6 rankings given.. variance of one dependent variable (error rate) by two factors (color and order). A value of p<0.05 was taken to indicate statistical significance. Table 1 shows the values of mean difference and significant level p for the colors as the result of the LSD test.. No Co lo 6C r ol or s. be pressed to enter the next step (step2). The “Verified” prompt will become a warning prompt “Error” if there is any repeat of the numbers in the answer ranking. This means that the ranking 112346, for example, is not a possible answer in our experiments. If this ranking is given, the next step could not be entered and the answer ranking must be corrected.. Figure 4 The mean error rate (%) for the colors Table 1 The Values of Mean Difference and Significant Level (p) for the Colors. Yellow. Mean Difference. p. NoColor. -21.6667(*). 0.002. 6Colors. -21.6667(*). 0.002. Blue. -15.0000(*). 0.030. Green. -18.3333(*). 0.009. Orange. -20.0000(*). 0.005. (*) means significant at 0.05 level As the result of the LSD test in Table 1 shows, there is significant difference between the following color conditions: Yellow and NoColor, Yellow and 6Colors, Yellow and Blue, Yellow and Green, Yellow and Orange The values of the mean differences in terms of error rate between the color condition yellow and other 5 color conditions (NoColor, 6 Colors, Blue, Green and Orange) are all negative, implying that of these 6 color conditions, yellow generally has statistically significantly lowest error rate for the haptic perception of the textured surfaces. In other words, yellow has least interference to the haptic perception. We originally planed to analyze the influence of colors on the error rate observed in the haptic perception of textured surfaces. But to our surprise, the mean error rates for different orders show interesting difference, as can be seen in Figure 5. Therefore, the influence of orders on the haptic perception of the textured surfaces was also.
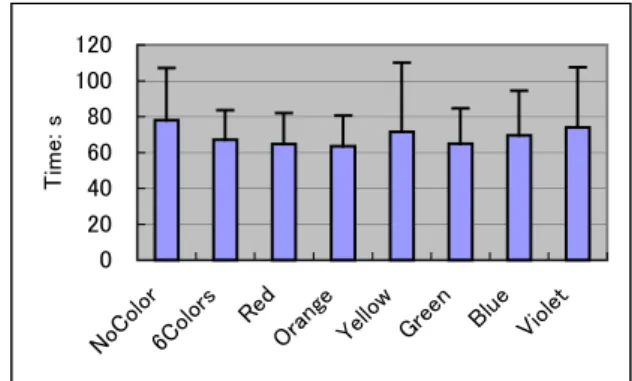
(6) analyzed. For this purpose, the post hoc multiple comparisons for two factors (color and order) were performed using the LSD test in the SPSS. A value of p<0.05 was taken to indicate statistical significance. The results are shown in Table 2 (For the precision reason, an extremely small value of p, for example, 0.00000023, is expressed as 0.000 in the table).. In order to analyze whether the subjects can truly distinguish the roughness on the 6 haptic textured surfaces, the two-factor (subjects and orders) Friedman test was performed to determine whether there is a statistical difference among the 6 values of Ls in each order. For this test, the degree of freedom is 5 (6 Ls - 1), the total number of data is 80 (10 subjects × 8 color conditions), the number of group is 6 (orders). A value of p<0.05 was taken to indicate statistical significance. The result is shown in Table 3.. 120 100 80 60 40. Table 3 The result of Friedman Test. 20. Order. 0. A. B. C. χ. 342.10. 320.52. 277.20. χ2(0.95). 11.07. 11.07. 11.07. D. E. F. χ. 286.58. 318.27. 298.77. χ2(0.95). 11.07. 11.07. 11.07. Order A Order B Order C Order D Order E Order F. Figure 5 The mean error rate (%) for the orders. 2. Order. Table 2. The Values of Mean Difference and Significant Levels (p) for Orders Mean Difference. p. Order B. -30.0000(*). 0.000. Order A Order C. -30.0000(*). 0.000. Order D. -30.0000(*). 0.000. Order E. -35.0000(*). 0.000. Order B. -18.7500(*). 0.002. Order F Order C. -18.7500(*). 0.002. Order D. -18.7500(*). 0.002. Order E. -23.7500(*). 0.000. (*) means significant at 0.05 level We did not expect that the order in which different levels of roughness presented to the subjects has an effect on the haptic perception of the textured surfaces. But the results of 8 experiments in this study show that the order A and order F is easiest to perceive correctively. In other words, continuously increasing or decreasing the roughness will make it easier for the subjects. It can be seen from Table 3 that all the values of χ2 are greater than the boundary value χ2(0.95). Therefore, there is statistical difference between the Ls. In other words, for the 10 subjects, the 6 levels of roughness created with the 6 wavelengths (Ls) in the 6 orders are all distinguishable. Thus, the selection of L values is reasonable. In conducting the experiments, we did not instruct the subjects to finish the task as quickly as possible. But the time information was recorded into a log file. Therefore, we calculate the mean time for each ranking-given for the color conditions and show the result in Figure 6.. Time: s. Order: A and B; A and C; A and D; A and E; F and B; F and C; F and D; F and E.. 120 100 80 60 40 20 0 No Co lo 6C r ol or s. As can be seen, there is significant difference between the following conditions:. 2. Re d Or an ge Ye llo w Gr ee n Bl ue Vi ol et. Error rate (%). to correctly fulfill the experiment task. Randomly changing the roughness from one surface to the other will confuse them.. Figure 6 The mean time for each ranking-given for the colors.
(7) 5. Discussion. Perceivable and distinguishable roughness of 6 levels was provided for the experiments in this study. Due to the complexity of the experiment task, however, the error rates are generally high. Colors do have influence on the haptic perception of textured surface in terms of error rate. Specifically, the perception error rate for the yellow condition is statistically significantly lower (Figure 4). Based on our statistical analysis, Yellow was found to be significantly different from NoColor, 6Colors, Blue, Green and Orange condition in terms of the error rate. Its error rate is statistically significantly lowest (Table 1), implying that yellow is the best candidate color to be used in an environment in which both colors and haptic textured surfaces coexist and in which the true and correct judgment of haptic perception is to be maintained. In another respect, the error rate of the 6 color conditions (6Colors, Red, Yellow, Green, Blue and Violet) is no greater than that of the NoColor condition, implying that the introduction of color(s) into haptic environment will not increase the error rate. This is even true of the 6Colors condition. We originally thought that introducing 6 types of colors into the environment would increase the error rate significantly. But it turns out not to be true. To sum up, colors do have influence on the haptic perception. But generally they do not make the perception error rate higher than when no color is used; it is safe to introduce up to 6 types of colors into haptic interfaces without worsening the haptic perception; yellow is quite unique in that its error rate is statistically significantly lower than that of blue, green, orange, than that when no color is used and than that when up to 6 colors are adopted. It is safe to use yellow in haptic interfaces without worsening the haptic perception. On the other hand, the finding of the two special orders, order A and order F, is also interesting. Figure 5 shows the mean values of error rate under different order conditions. The error rate of order A and order F is statistically significantly lower than that of other 4 orders, as the Table 2 shows. This finding demonstrates that human haptic perception is very sensitive to continuously increasing or decreasing changes of the strength of roughness on surfaces of objects, but has difficulty to discern the randomly changed strength of roughness, even under the same test environment. This finding has an implication for practical applications. For example, in the future haptic interfaces, when two users interact with each other. haptically through networks, critical information (signals) can be coded with the special orders for it to be perceived correctly. In the applications designed for the blind, warnings for extremely danger environment can be “coded” with these special orders for their correction perception. If large enough numbers of similar orders can be found, the haptic interfaces will have a far more richer language than it has now to speak with in multimodal interfaces. In fact, in their discussion of information transfer rates for different modes of manual communication in the chapter 5 (haptic interfaces) of their book, Bigges et al [21], of MIT, states that advances in HCI require finding rich codes for haptic input and output that user can learn quickly and easily. The special orders that we found in this study might be that kind of codes.. 6. Future Work. For the value of the parameter K and A in our experiments, the △L=1mm was proved to have produced a large enough value for the haptic perception of roughness. We plan to design future experiments to test the smallest △L value so as to evaluate the sensitivity of human haptic perception. In this paper, the position of 6 colors on the surfaces is fixed (Figure 3). It is also possible to design future experiments in which the position of the colors is changed. This will simulate an interactive, moving scene in which colored objects are moved around as a result of haptic interaction.. 7. Conclusions. Eight experiments were performed to investigate the influence of colors on the haptic perception of textured surfaces. Our results show that: colors do have influence on the haptic perception; but generally they do not make the perception error rate higher than when no color is used; it is safe to introduce up to 6 types of colors into haptic interfaces without worsening the haptic perception; yellow is quite unique in that its error rate is statistically significantly lower than that of blue, green, orange, than that when no color is used and than that when up to 6 colors are adopted. It is safe to use yellow in haptic interfaces without worsening the haptic perception. We also found two special orders for haptic perception. The finding demonstrates that human.
(8) haptic perception is very sensitive to continuously increasing or decreasing changes of the strength of roughness, but has difficulty to discern the randomly changed strength of roughness on textured surfaces, even under the same test environment. These special orders can be used to convey haptic information for applications in which the correct haptic perception is important, critical or of highest priority.. Acknowledgements We would like to thank Professors XiaoYang Mao, Ryutaro Ohbuchi and Dr. Kentaro Go of Yamanashi University for helpful discussions and comments. We are grateful for Dr. Li Jing, of the National University of Singapore, who supported us with the statistical analysis of our experiment data. A very special thanks goes to Mr. Adam Nyback, of Reachin Technologies AB, of Sweden, (www.reachin.se) for his support of this study at the API level. This research was supported in part by the Japan Society for the Promotion of Science, by the Telecommunications Advancement Organization of Japan, and by the Research Institute of Electrical Communication of Tohoku University awarded to A.Imamiya.. References [1] Klatzky, R. L. et al.: There’s More to Touch Than Meets the Eye: the Salience of Object Attributes for Haptics With and Without Vision, Journal of Experimental Psychology: General, 116(4), (1987) 356-369. [2] Choi, S. et al.: A Parameter Space for Perceptually Stable Haptic Texture Rendering, Proceedings of the Fifth PHANToM User Group (PUG) Workshop, (2000). [3] McGee, M. R. etc.: Haptic Perception of Virtual Roughness, CHI’2001 (2001). [4] Wall, S. A. et al: Modeling of Surface Identifying Characteristics Using Fourier Series, Proceedings of the ASME Dynamic Systems and Control Division, (1999): 65-71. [5] Srinivasan, M.A.: Haptic Interfaces in “Virtual Reality: Scientific and Technological Challenges”, Durlach, N. I. and Mavor, A.S. (eds.), National Academy Press, (1995) 161-187.. [6] Salisbury, J.K.: Making Graphics Physically Tangible, Communications of the ACM, Vol. 42, No. 8, August (1999) 75-81. [7] Wickens, C. D. et al: Compatibility and Resource Competition between Modalities of Input Central Processing, and Output. Human Factors, Vol.25, No. 2, (1983) 227-248. [8] Engel, F. L. et al: Improved Efficiency Through I- and E-Feedback: a Trackball with Contextual Force Feedback, International Journal of Human Computer Studies, 41, (1994) 949-974. [9] Oakley, I. et al: Putting the Feel in “Look and Feel”, CHI’2000 (2000) 415-423. [10] Sherrick, C. E. et al: Cutaneous Sensitivity, In Boff, K R. et al (eds.), Handbook of Human Perception and Human Performance, Vol. I, (1986) 12-1-12-57. [11] Koseleff, P.: Studies in the perception of Heaviness, Acta Psychologica, 13, (1957) 242-252. [12] Katz, D.: The World of Touch, (Translated by Krueger, L.E.), Erlbaum, Hillsdale, NJ, (1989). Original work was published in 1925. [13] Oakley, I.: Comparing Haptic Effects in a GUI. Proceedings of First PHANToM Users Research Symposium, (1999). [14] McGee, M. R. etc.: Feeling Rough: Multimodal Perception of Virtual Roughness, Eurohoptics’2001. [15] Minsky, M. D. R.: Computation Haptics: the Sandpaper System for Synthesizing texture for a force-feedback display, Ph D Thesis, MIT, (1995). [16] Fritz, J. P.: et al. Stochastic Models for Haptic Textures. Proceedings of SPIE’s International Symposium on Intelligent Systems and Advanced Manufacturing-Telemanipulator and Telepresence Technologies III, Boston, MA. November, (1996). [17] Siira, J. et al.: Haptic Texturing-A Stochastic Approach. International Conference on Robotics and Automation. IEEE, (1996). [18] Ho, C. et al.: Efficient Point-Based Rendering Techniques for Haptic Display of Virtual Objects. Presence, Vol.8, No.5, October (1999) 477-491. [19] Massie, T. H.: Initial Haptic Explorations with the Phantom: Virtual Touch Through Point Interaction, Master Thesis, MIT, 1996 [20] Reachin API 3.0 Programmer’s Guide, Reachin Technologies AB, Sweden, (1998-2001). [21] Biggs, S. J. et al.: Chapter 5. Haptic Interfaces. MIT, (2000).
(9)
數據
![Figure 1 Hardware setup for the experiment The Reachin 3.0 API [20] from Reachin Technologies AB was used for programming the experimental environment, in which haptic interactions are made available through the PHANToM](https://thumb-ap.123doks.com/thumbv2/9libinfo/8915539.261265/2.892.457.771.553.777/hardware-experiment-technologies-programming-experimental-environment-interactions-available.webp)
+2
相關文件
6. To complete the ‘What’s Not’ column, students need to think about what used to be considered a fashionable thing to do, see, listen to, talk about and is no longer
This paper is based on Tang Lin’ s Ming Bao Ji (Retribution after Death), which is written in the Early Tang period, to examine the transformation of the perception of animal since
• Instead, static nested classes do not have access to other instance members of the enclosing class. • We use nested classes when it
• Instead, static nested classes do not have access to other instance members of the enclosing class. • We use nested classes when it
n Receiver Report: used to send reception statistics from those participants that receive but do not send them... The RTP Control
The results revealed that (1) social context, self-perception, school engagement, and academic achievement were antecedents of dropping out; (2) students’ self-factor was a
The grade of the children, education level of parents, the occupation of parents, and the number of times meals are cooked at home have a significant influence on a perception
The results of this study are as follows:(1)Search sites will affect the quality of service users perceived usefulness, perceived ease of use as well as the perception of trust;
