A Study on the Luminescence Properties of CaAlBO
4:RE
3+(RE = Ce, Tb, and Eu) Phosphors
Wei-Ren Liu,a,zYi-Chen Chiu,aChien-Yueh Tung,aYao-Tsung Yeh,a Shyue-Ming Jang,aand Teng-Ming Chenb,z
a
Material and Chemical Research Laboratories, ITRI Hsichu 300, Taiwan b
Phosphors Research Laboratory and Department of Applied Chemistry, National Chiao Tung University, Hsinchu 30010, Taiwan
A series of new phosphors of CaAlBO4:RE3+共RE = Ce, Tb, Eu兲 were synthesized by conventional solid-state reactions. The X-ray diffraction data indicate that a pure phase of CaAlBO4:RE3+can be successfully obtained. The photoluminescence共PL兲 spectra, quantum efficiency, and CIE coordinates of CaAlBO4:RE3+were investigated. The PL and PL excitation spectra indicate that the emission wavelengths of CaAlBO4:Ce3+are 372 and 398 nm共with full width at half maximum of 33 nm兲 attributed to the 4f65d–4f7transition of the Ce3+activator, respectively. CaAlBO
4:Tb3+displays green emission at 483, 543, 584, and 620 nm, while CaAlBO4:Eu3+shows a dominating emission peak at 621 nm, which is attributed to the Eu3+ 5D0−7F2transition. The quantum efficiencies of optimized CaAlBO4:Ce3+, CaAlBO4:Tb3+, and CaAlBO4:Eu3+were found to be 43, 21, and 19%, respec-tively. The phosphors may provide a new kind of luminescent material under UV excitation.
© 2008 The Electrochemical Society. 关DOI: 10.1149/1.2953499兴 All rights reserved.
Manuscript submitted March 5, 2008; revised manuscript received June 9, 2008. Published July 25, 2008.
Recently, great interest in phosphors has resulted in rapid devel-opments in the promising display and illumination technologies. For general lighting, photoluminescent共PL兲 materials including oxides, silicates, aluminates, aluminoborates, aluminosilicates, nitrides, bo-rates, etc., play very important roles for potential applications in UV light-emitting diodes. Among these hosts investigated, borates are good candidates as host structure due to their low synthetic tempera-ture, easy preparation, and high luminescent brightness. The lumi-nescence properties of UV-excitable Eu2+-doped borate phosphors, such as Ba2LiB5O10,1 Ba2Mg共BO3兲2,2 Ba2Ca共BO3兲2, Sr2Mg共BO3兲2,3SrAl2B2O7,4SrBPO5,5Sr2Al2B2O8,6and M2B5O9X 共M = Ca, Sr; X = Cl, Br兲,7
have been reported in the literature. Apart from Eu2+-activated borates, several RE3+-doped borates have also been studied, such as BaAl2B2O7,8共Y,Gd兲BO3,9 BaB8O13,10 and CaAl2B2O7.11,12 Recently, the luminescent properties of RE3+-doped CaYBO
4 in the UV–vacuum UV spectral region have been reported by Wang and Wang13and Yang et al.,14where RE is Eu3+, Tb3+, Gd3+, or Ce3+. To the best of our knowledge, the lumi-nescence properties of rare-earth-ion–activated CaAlBO4are not re-ported yet. The aim of this work is to report our investigation results on the synthesis, PL, and color chromaticity of the new indigo-blue 共CaAlBO4:Ce3+兲, green 共CaAlBO4:Tb3+兲, and red phosphors 共CaAlBO4:Eu3+兲, and their corresponding spectroscopic properties under UV excitation.
Experimental
A series of CaAlBO4:RE3+共RE = Ce, Tb, or Eu兲 phosphors were synthesized by solid-state reactions adopting CaCO3共99.99%, Ald-rich兲, ␥-Al2O3 共99.99%, Aldrich兲, B2O3 共⬎99.9%, Strem Chemi-cals兲, Eu2O3 共99.9%, Aldrich兲, Tb4O7 共99.9%, Strem Chemicals兲, and CeO2 共99.998%, Strem Chemicals兲 as starting materials. The raw materials were weighed out in stoichiometric proportions and the mixtures were then fired at 1000°C for 10 h under N2 atmo-sphere in an inner alumina crucible that was contained in a covered alumina crucible filled with graphite powder. The products were then obtained by cooling to room temperature in the furnace, ground, and pulverized for further measurements.
X-ray diffraction共XRD兲 was carried out on a Philips X’pert PRO diffractometer with Cu K␣ 共1.5418 Å兲 radiation. The PL and PL excitation共PLE兲 spectra were measured at room temperature by a Spex Fluorolog-3 spectrophotometer equipped with a 450 W Xe light source. All the spectra were measured with a scan rate of
150 nm min−1. The CIE chromaticity coordinates were measured by a Laiko DT-101 color analyzer equipped with a charge-coupled device detector共Laiko Co., Tokyo, Japan兲. The reflectance spectra of the samples were collected with a Hitachi 3010 double-beam UV-visible 共UV-vis兲 spectrometer 共Hitachi Co., Tokyo, Japan兲 equipped with a60 mm integrating sphere inner face coated with Spectralon关poly共tetrafluoroethylene兲兴, and ␣-Al2O3 was used as a standard in the measurements. The quantum efficiency 共QE兲 was measured by an integrating sphere whose inner face was coated with Spectralon equipped with a spectrofluorometer共Horiba Jobin-Yvon Fluorolog 3–22 Tau-3兲. The device is based upon a Labsphere opti-cal Spectralon integrating sphere共diameter of 100 mm兲, which pro-vides a reflectance⬎99% over a 400–1500 nm range 共⬎95% within 250–2500 nm兲. The sphere accessories were made from Teflon 共rod and sample holders兲 or Spectralon 共baffle兲. The measurement proce-dures of QE are described as follows. First of all, the empty quartz cell is placed on the light incident route of the sphere, and the optimal excitation light source alone is detected. The integral area of the excitation light is labeled as Le. For the second step, the mea-surement is the same with step one except the sample is placed inside the sphere but not on the light incident route. The integral area of the excitation light source is labeled as Lo, and that of emis-sion region is labeled as Eo. The third step is similar to the second, except that the sample is now directly stricken by the excitation light source. The integral area of the excitation light source is labeled as Li, and that of the emission region is labeled as Ei.
Results and Discussion
The crystal structure of CaAlBO4was first reported by Schafer.15 The Ca2+ ion in the lattice can be considered to be solely six-coordinated with Ca–O distance of 2.4053 Å. The JCPDS card no. 19–0204 reported the crystal structure is orthorhombic共space group Ccc2兲 with lattice constants a = 8.269 Å, b = 15.227 Å, and c = 5.733 Å. The XRD patterns of CaAlBO4at different synthesizing temperatures are shown in Fig. 1. With reaction temperatures at 800 or 900°C for 10 h, the major phases in the mixture are CaAl4O7and Ca2B2O5, which are confirmed by JCPDS card no. 23–1037 and 89–6630, respectively. With the reaction temperature up to 1000°C, a pure phase of CaAlBO4can be obtained. It is known that the ionic radii共r兲 of Ca2+共CN = 6兲, Al3+共CN = 4兲, and B3+共CN = 3兲 are 1.00, 0.39, and 0.01 Å, respectively.16As a result of the ionic radii of doping rare-earth elements of Ce3+共CN = 6, r = 1.01 Å兲, Tb3+ 共CN = 6, r = 0.923 Å兲, and Eu3+ 共CN = 6, r = 0.947 Å兲, it is difficult for RE3+to substitute Al3+or B3+in the CaAlBO
4. Hence, in this study, it is believed that the Ca2+sites are replaced by Ce3+, Tb3+, or Eu3+in the lattice.
z
E-mail: [email protected]; [email protected]
Journal of The Electrochemical Society, 155共9兲 J252-J255 共2008兲
0013-4651/2008/155共9兲/J252/4/$23.00 © The Electrochemical Society
J252
) unless CC License in place (see abstract).
ecsdl.org/site/terms_use
address. Redistribution subject to ECS terms of use (see
140.113.38.11
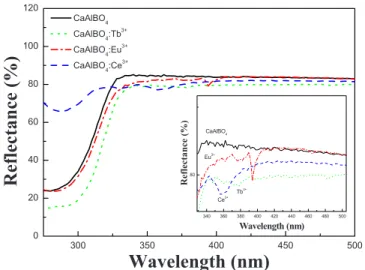
Figure 2 shows the reflectance spectra of pure CaAlBO4 and RE3+ 共RE = 0.1 mol % Ce3+, 10 mol % Tb3+, or 7 mol % Eu3+兲-activated CaAlBO4. The spectrum of pristine CaAlBO4 exhib-ited the host absorption edge at⬃330 nm from which the optical bandgap was estimated to be⬃3.98 eV. The Ce3+-doped CaAlBO
4 shows a broad hump at⬃360 nm and a weak absorption band at around 330 nm. The former is due to host absorption and the latter is attributed to the 4f–5d transition of Ce3+. The observation of host absorption in CaAlBO4:Ce3+mainly results from lower doping con-tent of Ce3+ in the host and weaker luminescent intensity. The CaAlBO4:Tb3+shows a weak peak located at⬃380 nm, which is due to f–f transition of Tb3+, whereas Eu3+-doped CaAlBO
4displays an absorption peak at⬃394 nm, which is typically ascribed to the f–f transition of Eu3+. These results indicate that the emissions of Ce3+, Tb3+, and Eu3+ doped in CaAlBO
4 host correspond to the absorption of activators themselves.
We also investigated the optimization of luminescence perfor-mance of CaAlBO4:RE3+by tuning the respective dopant content, and Fig. 3 displays the PL intensity as a function of Ce3+, Tb3+, and Eu3+dopant concentration for共Ca1−xCex兲AlBO4,共Ca1−yTby兲AlBO4, and共Ca1−zEuz兲AlBO4, respectively. The optimal doping
concentra-tions of Ce3+, Tb3+, and Eu3+were found to be 0.1, 10, and 7 mol %, respectively. Beyond the critical concentration, the emission inten-sity begins to decrease due to concentration quenching of the acti-vators. In order to further estimate the critical energy-transfer dis-tance 共Rc兲 between these activators in the host, the following equation17 is valid because there is only one crystallographically distinct Ca2+site with octahedral coordination in the CaAlBO
4
lat-tice. As a result, the critical energy-transfer distances between RE3+ ions for Eu3+, Tb3+, and Ce3+in the three phosphors can be calcu-lated by the following equation
Rc= 2
冉
3V 4xcN冊
1/3
关1兴 where xcis the critical concentration, N is the number of cation sites in the unit cell, and V is the volume of unit cell. In this case, V = 721.71 Å3, N = 4, and the critical doping concentrations of Ce3+, Tb3+, and Eu3+in CaAlBO4host were found to be 0.001, 0.1, and 0.07, respectively. Therefore, Rcof Ce3+, Tb3+, and Eu3+were then determined to be 70.11, 15.10, and 17.01 Å, respectively, which were found to be in the range of those共i.e., ⬃35 and 20 Å兲 reported by Chang and Chen18and Xie et al.,19except for the Ce3+activator. The larger value of Rcfor Ce3+may be due to the solubility of Ce3+ in CaAlBO4host. Compared to Tb3+and Eu3+, the ionic radius of Ce3+is the largest, which causes the distortion of lattice while the doping content increases. The XRD patterns of CaAlBO4:Ce3+共not shown兲 with higher doping ratio reveals impurity phase of Ca2B2O5 as long as the concentration of Ce3+exceeds 1 mol %. The results of XRD patterns for CaAlBO4:Tb3+and CaAlBO
4:Eu3+, however, are still pure phase, even when the doping content is up to 10 mol %.
In order to further determine the absolute QE of photoconversion for these phosphors, herein we have used the integrated sphere method for the measurements of optical absorbance共A兲 and quan-tum efficiency共⌽兲 of phosphor samples. The absorbance and quan-tum efficiencies of CaAlBO4:RE3+phosphors can also be calculated by using the following equations
A = L0共兲 − Li共兲
L0共兲 关2兴
where L0共兲 is the integrated excitation profile when the sample is diffusely illuminated by the integrated sphere’s surface, and Li共兲 is the integrated excitation profile when the sample is directly excited by the incident beam. Furthermore, QE共⌽兲 of CaAlBO4:RE3+ phos-phors can be calculated by
10 20 30 40 50 60 (420) (190) (352) (402) (172) (370) (440) (421) (080) (171) (261) (170) (132) (311) (060) (112) (022) (310) (240) (150) (221) (131) (220) (040) (130) (110) (c) (b)
Intens
ity
(a.u.
)
2
(a) (020)Figure 1. XRD pattern of CaAlBO4synthesized at different reaction tem-peratures for 10 h:共a兲 800; 共b兲 900, and 共c兲 1000°C. 共쎲兲 JCPDS card no. 19–0204 CaAlBO4;共䊏兲 JCPDS card no. 23–1037 CaAl4O7, and共䉱兲 JCPDS card no. 89–6630 Ca2B2O5. 300 350 400 450 500 0 20 40 60 80 100 120 CaAlBO4 CaAlBO4:Tb 3+ CaAlBO4:Eu 3+ CaAlBO4:Ce 3+ 340 360 380 400 420 440 460 480 500 80 Tb3+ Reflecta nce (% ) Wavelength (nm) CaAlBO4 Eu3+ Ce3+
Reflectance
(%
)
Wavelength (nm)
Figure 2.共Color online兲 Comparison of UV-vis diffuse reflectance spectra of
CaAlBO4 and as-synthesized CaAlBO4:0.1% Ce3+, CaAlBO4:10% Tb3+, and CaAlBO4:7% Eu3+phosphors. The inset illustrates reflection spectra of these phosphors by a larger magnitude.
0.00 0.05 0.10 0.15 0.20 0.25
0 10 20 30 40
3 4 5 6 7 8 9
Ce3+
Doping concentration (mol.%)
Tb3+ Intensi ty (a.u.) Intensi ty (a.u.) Intensi ty (a.u.) Eu 3+
Figure 3. Emission intensity of Ca1−xAlBO4:xCe3+, Ca
1−xAlBO4:xTb3+, and Ca1−xAlBO4:xEu3+as a function of dopant concentration.
J253
Journal of The Electrochemical Society, 155共9兲 J252-J255 共2008兲 J253
) unless CC License in place (see abstract).
ecsdl.org/site/terms_use
address. Redistribution subject to ECS terms of use (see
140.113.38.11
⌽ =Ei共兲 − 共1 − A兲E0共兲
Le共兲A 关3兴
where Ei共兲 is the integrated luminescence of the powder upon di-rect excitation, and E0共兲 is the integrated luminescence of the pow-der excited by indirect illumination from the sphere. The term Le共兲 is the integrated excitation profile obtained from the empty inte-grated sphere 共without the sample present兲. The absorbance of composition-optimized CaAlBO4:Ce3+, CaAlBO
4:Tb3+, and
CaAlBO4:Eu3+were found to be 50, 29, and 38 at excitation wave-lengths of 343, 351, and 396 nm, respectively, and the correspond-ing QE was found to be 43, 21, and 19%. For comparison, the values of A and QE of commodity phosphors BaMgAl10O19:Eu2+ 共blue兲, LaPO4:Ce3+, Tb3+共green兲, and La2O2S:Eu3+共red兲 were also measured with the same approach. The corresponding excitation wavelengths, emission wavelengths, CIE coordinates, absorbance, and QEs are summarized in Table I. We have observed that the QE value of CaAlBO4:Eu3+ is close to that of the commodity La2O2S:Eu3+共Kasei-681兲.
Figure 4 shows the PL and PLE spectra of
共Ca0.999Ce0.001兲AlBO4, in which two excitation humps at 263 and
343 nm were observed in the PLE spectrum. The former is attributed to host absorption that was found to be consistent with the reflec-tance spectrum of pure CaAlBO4 共Fig. 2兲. By Gaussian fitting, a stronger hump between 300 and 360 nm was observed to correspond to the 4f–5d transition of Ce3+. The PL spectrum can be further deconvoluted by assuming a Gaussian-type profile into two emission peaks at 372 and 398 nm, attributed to the transition of 5d to2F5/2 and2F2/7, respectively. The energy difference between 372 and 398 nm is ⬃1756 cm−1, which is close to the theoretical value of ⬃2000 cm−1.20
The Stokes shift for Ce3+ in CaAlBO4 host is ⬃4000 cm−1, which was found to be located in the range of Stokes shift reported by Blasse and Bril for various Ce3+-activated materials21 共i.e., from 1200 cm−1 for ScBO3:Ce3+ and from 8000 cm−1for SrY
2O4:Ce3+兲.
Figure 5 displays the PL and PLE spectra of共Ca0.9Tb0.1兲AlBO4 phosphor. The PLE spectrum shows sharp emission lines at 272, 284, 303, 317, 326, 341, 351, 354, 369, 374, and 379 nm, among which the excitation bands observed in the range of 230–300 nm are attributed to the 4f8→ 4f75d1transition of Tb3+, and those in the range of 300–400 nm are due to the 4f→ 4f transition of Tb3+. The PL spectrum on the right side demonstrates typical Tb3+emission due to the5D4→7FJ共J = 6, 5, 4, 3兲, which are5D4→7F6共483, 490, 493 nm兲,5D4→ 7F5共543, 555 nm兲,5D4→7F4共585, 590 nm兲, and 5D4→7F3 共621, 627 nm兲, respectively. The dominated green emission peak for CaAlBO4:Tb3+is at 543 nm.
Figure 6 shows the PL and PLE spectra of composition-optimized 共Ca0.93Eu0.07兲AlBO4 phosphor. The broad-band at ⬃260 nm can be attributed to the charge-transfer transition of O2−→ Eu3+, and the sharp lines between 300 and 420 nm were due
Table I. The comparison of commodity phosphors and CaAlBO4:RE3+„RE = Ce, Tb, Eu….
Composition Excitation共nm兲 Emission共nm兲 CIE共x, y兲 Relative Absorbance Relative QE
BaMgAl10O17:Eu2+ 343 452 共0.14, 0.07兲 100 100 CaAlBO4:0.1% Ce3+ 343 400 共0.16, 0.04兲 60 45 LaPO4:Ce3+, Tb3+ 351 543 共0.30, 0.54兲 100 100 CaAlBO4:10% Tb3+ 351 543 共0.36, 0.50兲 147 68 La2O2S:Eu3+ 393 621 共0.66, 0.33兲 100 100 CaAlBO4:7% Eu3+ 396 621 共0.54, 0.31兲 74 90 250 300 350 400 450 500 550 2F 5/2 5d 2F 7/2 (a) (b) 2F 5/2 5d 2F 7/2 (a) (b)
Intens
ity
(a.u.)
Wavelength (nm)
(a) (b)Figure 4. 共Color online兲 Excitation and emission spectra of synthesized
CaAlBO4:0.1% Ce3+phosphor. 200 250 300 350 400 450 500 550 600 650 700 f -d 5 D 4 7 F 3 5 D 4 7 F 4 5 D 4 7 F 5
Intensity
(a.u.)
Wavelength (nm)
5 D 4 7 F 6 f -fFigure 5. Excitation and emission spectra of synthesized CaAlBO4:10% Tb3+phosphor. 200 250 300 350 400 500 550 600 650 700 750 5 D 0 7 F 4 5 D 0 7 F 3 5D 0 7F 2 5D 0 7F 1 5 D 0 7 F 0 7 F 0,1 5 G 2 5 L 7 7F 0,1 5L 6 7 F 0,1 5 D 3 7 F 0,1 5 G 4,5,6 5 D 4
Intens
ity
(a.u.
)
Wavelength (nm)
CT 7 F 0,1 5 H 4,5,6,7Figure 6. Excitation and emission spectra of synthesized CaAlBO4:7% Eu3+phosphor.
J254 Journal of The Electrochemical Society, 155共9兲 J252-J255 共2008兲
J254
) unless CC License in place (see abstract).
ecsdl.org/site/terms_use
address. Redistribution subject to ECS terms of use (see
140.113.38.11
to the f–f transition of Eu3+ions. The PL spectrum exhibited typical line emission assigned to the transition of 5D0 to 7FJ 共J = 1, 2, 3, 4兲. It is well known that the highly intense line at 590 nm is due to magnetic dipole5D0→7F1transition and the strong line at 621 nm is associated with the electric dipole transition. In this study, the dominant emission peaks of CaAlBO4:Eu3+located at 621 nm are due to electric dipole transition, indicating that Eu3+ ion occupied the site of noninversion symmetry.22The emission peak of Eu3+at⬃579 nm originating from the 5D
0→7F0 transition is a forbidden transition. The 5D0→7F0 transition is observed when Eu3+occupies a lattice site with Cv, Cnv, or Cs symmetry. In this study, a single emission peak at 579 nm indicates that Eu3+solely occupied one Ca2+cite, and this observation is consistent with site symmetry of Ca2+and the crystal structure of CaAlBO4.
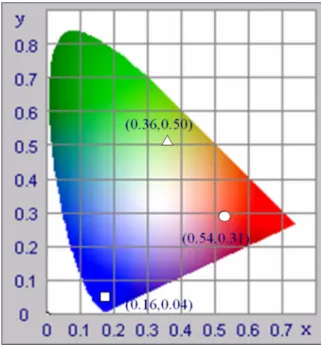
Figure 7 shows the CIE chromaticity diagram with empirically measured CIE coordinates under excitation of 365 nm. The chroma-ticity coordinates of optimized phosphors, 共Ca0.999Ce0.001兲AlBO4,
共Ca0.9Tb0.1兲AlBO4, and 共Ca0.93Eu0.07兲AlBO4, were found to be 共0.16, 0.04兲, 共0.36, 0.50兲, and 共0.54, 0.31兲, respectively. The diagram shown in Fig. 7 displays indigo-blue, green, and red color under 365 nm excitation, which indicates that CaAlBO4:RE3+ 共RE = Ce, Tb, Eu兲 are good candidates as indigo-blue, green, and red luminescence materials for application under UV excitation.
Conclusions
In summary, new phosphors of CaAlBO4:RE3+ 共RE = Ce, Tb, Eu兲 that emit indigo-blue, green, and red lights have been reported and the dominant emission wavelengths were found to be 398, 543, and 620 nm under optimal excitation wavelengths at 343, 351, and 393 nm, respectively. The optimized doping contents of Ce3+, Tb3+, and Eu3+in CaAlBO
4were determined to be 0.1, 10, and 7 mol %, respectively. The experimental QE data have indicated that these phosphors may be potential candidates for applications in luminescent materials under UV excitation.
Acknowledgment
The authors acknowledge generous financial support from Indus-trial Technology Research Institute.
Industrial Technology Research Institute assisted in meeting the publica-tion costs of this article.
References
1. G. J. Dirksen and G. Blasse, J. Solid State Chem., 92, 591共1991兲. 2. A. Akella and D. A. Keszler, Mater. Res. Bull., 30, 105共1995兲. 3. A. Diaz and D. A. Keszler, Chem. Mater., 9, 2071共1997兲.
4. F. Lucas, S. Jaulmes, and M. Quarton, J. Solid State Chem., 150, 404共2000兲. 5. K. Sakasai, M. Katagiri, K. Toh, N. Takahashi, M. Nakazawa, and Y. Kondo, J.
Appl. Phys., 74, S1589共2002兲.
6. M. Schläger and R. Hoppe, Z. Anorg. Allg. Chem., 619, 976共1993兲.
7. M. J. Knitel, B. Hommels, P. Dorenbos, C. W. E. Van Eijk, I. Berezovskaya, and V. Dotsenko, Nucl. Instrum. Methods Phys. Res. A, 449, 595共2000兲.
8. T. R. N. Kutty, R. Jagannathan, and R. P. Rao, Mater. Res. Bull., 25, 343共1990兲. 9. Y. Wang, K. X. Guo, T. Endo, Y. Murakami, and M. Ushirozawa, J. Solid State
Chem., 177, 2242共2004兲.
10. Q. Zeng, Z. Pei, and Q. Su, J. Lumin., 82, 241共1999兲. 11. H. You and G. Hong, Mater. Res. Bull., 32, 785共1997兲.
12. H. Yang, C. Li, H. He, G. Zhang, Z. Qi, and Q. Su, J. Lumin., 124, 235共2007兲. 13. L. Wang and Y. Wang, J. Lumin., 126, 160共2007兲.
14. H. Yang, C. Li, Y. Tao, J. Xu, G. Zhang, and Q. Su, J. Lumin., 126, 196共2007兲. 15. K. Schafer, Neues Jahrb. Miner. Monatsh., 1967, 131.
16. R. D. Shannon, Acta Crystallogr. A, 32, 751共1976兲. 17. G. Blasse, J. Solid State Chem., 62, 207共1986兲.
18. C.-K. Chang and T.-M. Chen, Appl. Phys. Lett., 91, 081902共2007兲.
19. R.-J. Xie, N. Hirosaki, Y. Yamamoto, T. Suehiro, M. Mitomo, and K. Sakuma, J. Ceram. Soc. Jpn., 113, 462共2005兲.
20. G. Blasse and B. C. Grabmaier, Luminescent Materials, p. 45, Springer, Berlin 共1994兲.
21. G. Blasse and A. Bril, J. Chem. Phys., 47, 5139共1967兲. 22. G. Blasse, Chem. Phys. Lett., 20, 573共1973兲.
Figure 7. 共Color online兲 CIE coordinates of CaAlBO4:Ce3+ 共䊐兲, CaAlBO4:Tb3+ 共䉭兲, and CaAlBO4:Eu3+共䊊兲 phosphors, which are 共0.16, 0.04兲, 共0.36, 0.50兲, and 共0.54, 0.31兲, respectively. The photos are taken under excitation at 365 nm in the UV box.
J255
Journal of The Electrochemical Society, 155共9兲 J252-J255 共2008兲 J255
) unless CC License in place (see abstract).
ecsdl.org/site/terms_use
address. Redistribution subject to ECS terms of use (see
140.113.38.11