國 立 交 通 大 學
生物資訊及系統生物研究所
博
士 論 文
一個基於同義字辭典的蛋白質序列分析與
分類的方法
A SYNONYMOUS DICTIONARY BASED
APPROACH FOR PROTEIN SEQUENCE
ANALYSIS AND CLASSIFICATION
研 究 生:林信男
指導教授:許聞廉 教授
何信瑩 教授
一個基於同義字辭典的蛋白質序列分析與分類的方法
A SYNONYMOUS DICTIONARY BASED
APPROACH FOR PROTEIN SEQUENCE ANALYSIS
AND CLASSIFICATION
研 究 生:林信男 Student: Hsin-Nan Lin
指導教授:許 聞 廉 博士 Advisors: Dr. Wen-Lian Hsu 何 信 瑩 博士 Advisors: Dr. Shinn-Ying Ho
國 立 交 通 大 學
生 物 資 訊 及 系 統 生 物 研 究 所
博 士 論 文
A Dissertation
Submitted to Institute of Bioinformatics and Systems Biology College of Biological Science and Technology
National Chiao-Tung University in Partial Fulfillment of the Requirements
for the Degree of Ph.D. in
Bioinformatics November 2010
一個基於同義字辭典的蛋白質序列分析與分類
的方法
研究生:林信男 指導教授:許聞廉 博士 與 何信瑩 博士 國立交通大學生物資訊與系統生物研究所摘 要
由於蛋白質序列不斷地增加,蛋白質序列的分析與分類在生物資訊中是非常 重要的課題。許多的研究顯示蛋白質二級結構對於了解蛋白質的功能及三級結構 有很大的幫助,並且透過預測蛋白質在細胞中的定位,有助於分析蛋白質的功能 和藥物標靶的發現,此外找出同源蛋白質序列也是另外一個非常重要的課題。藉 由偵測同源蛋白質,可以更迅速地了解未知蛋白質可能的功能和屬性。因此在本 研究中,我們提出一個基於同義字辭典的蛋白質序列分析與分類的方法,用來預 測蛋白質二級結構、蛋白質細胞定位和同源蛋白質偵測等相關重要課題。 在蛋白質序列分析的方法上我們採用了自然語言處理的概念,提出以同義字 的方法來擷取一群同源蛋白質之間的區域相似性。一個同義字就是一個 n 字元的 胺基酸片段,一組同義字可顯示蛋白質在演化過程中可能發生的序列變化。我們 利用PSI-BLAST從一組蛋白質序列中產生了一個與蛋白質相依的同義字字典,以這 個字典當作蛋白質序列分析與分類的參考依據。 在 蛋 白 質 二 級 結 構 預 測 方面,基於同義字辭典我們發展了 SymPred 與 SymPsiPred 的方法。使用一組序列相似度在 25% 以下的蛋白質序列測試預測效 率,SymPred 和 SymPsiPred 平均的 Q3 分別為 81.0% 和 83.9%。使用兩組 EVA 公用測試資料,SymPred 平均的 Q3 分別是 78.8% 和 79.2%,預測準確率比現有方法
正相關,這個發現說明 SymPred 和 SymPsiPred 的預測準確率會隨著蛋白質序列的 增加而不斷地提高。 在蛋白質細胞定位預測中,基於同義字辭典我們發展了 KnowPredsite 的自動 預測方法。KnowPredsite 可同時預測單一胞器定位與多胞器定位。在一組公用的測 試資料中,包含了 取自1923個不同物種的 25887 單一胞器定位蛋白質與 2169 多胞 器定位蛋白質。實驗結果發現KnowPredsite 的預測準確率高於現有許多蛋白質細胞 定位預測方法。在單一胞器定位預測上,KnowPredsite 的準確率為 91.7%,高於
ngLOC 的 88.8%。在多胞器定位預測上,KnowPredsite 的準確率為 72.1%,高於
ngLOC 的 59.7%。此外KnowPredsite 的預測結果是可說明的,KnowPredsite 可呈列
預測結果的來源。實驗結果顯示即使序列相似度低,使用同義字辭典仍可以捕捉 到有意義的區域序列相似性用來幫助預測。
在同源蛋白質序列的偵測中,基於同義字辭典我們發展了 SymDetector 用來 偵測序列相似度很低的同源蛋白質。我們下載了一組公用測試資料,包含了2,476 條相似度極低的蛋白質序列。在允許一個 false positive pair 的條件下,SymDetector 可偵測到 5,308 組 true positive pair,然而現有的方法 ConSequenceS及PSI-BLAST 僅能偵測到低於1,000組的 true positive pairs。隨著 false positive pair的提高為100和 1000,SymDetector 可分別偵測到6,906及7,666組 true positive pairs,而相同條件下, 現有的方法ConSequenceS 僅能偵測到 2,000 及3,500,而 PSI-BLAST 則僅有 ConSequenceS 所偵測到的一半。
A SYNONYMOUS DICTIONARY BASED APPROACH
FOR PROTEIN SEQUENCE ANALYSIS AND
CLASSIFICATION
Student: Hsin-Nan Lin
Advisors: Dr. Wen-Lian Hsu and Dr. Shinn-Ying Ho
Institute of Bioinformatics and Systems Biology National Chiao-Tung University
Abstract
With the increasing number of protein sequences, the protein sequence analysis and classification is an important issue in Bioinformatics. Many researches show that protein secondary structure plays an important role in analyzing and modeling protein structures when characterizing the structural topology of proteins because protein secondary structure represents the local conformation of amino acids into regular structures.
The study of protein subcellular localization (PSL) is important for elucidating protein functions involved in various cellular processes. Most of the PSL prediction systems are established for single-localized proteins. However, a significant number of eukaryotic proteins are known to be localized into multiple subcellular organelles. Many studies have shown that proteins may simultaneously locate or move between different cellular compartments and be involved in different biological processes with different roles. The analysis of novel proteins usually starts from searching homologous proteins in annotated databases. Homologous proteins usually share a common ancestor, and thus often have similar functions and structures. Based on pairwise identities and some specific thresholds, sequence search tools retrieve annotated homologous sequences to infer annotations of the novel sequences. As the number of protein sequences grows, sensitive strategies of homology detection using simply sequence information are still
demanding and of great importance in post-genomic era. Sequence similarity is a frequently used simple metric for homology detection and other annotation transfers. However, sequence itself provides incomplete and noisy information about protein homology. Many improvements on homology searching and sequence comparisons have been developed to overcome the limitation of sequence similarity.
Based on above observation, we propose a general approach based on a synonymous dictionary for protein sequence analysis and classification. We apply it to the problems of protein secondary structure prediction, protein subcellular localization and remote homology detection. We adopt the techniques from natural language processing and use synonymous words to capture local sequence similarities in a group of similar proteins. A synonymous word is an n-gram pattern of amino acids that reflects the sequence variation in a protein’s evolution. We generate a protein-dependent synonym dictionary from a set of protein sequences.
Protein secondary structure prediction: On a large non-redundant dataset of 8,297 protein chains (DsspNr-25), the average Q3 of SymPred and SymPsiPred are 81.0% and 83.9%
respectively. On the two latest independent test sets (EVA_Set1 and EVA_Set2), the average Q3 of SymPred is 78.8% and 79.2% respectively. SymPred outperforms other
existing methods by 1.4% to 5.4%. We study two factors that may affect the performance of SymPred and find that it is very sensitive to the number of proteins of both known and unknown structures. This finding implies that SymPred and SymPsiPred have the potential to achieve higher accuracy as the number of protein sequences in the NCBInr and PDB databases increases.
Protein subcellular localization: We downloaded the dataset from ngLOC, which consisted of ten distinct subcellular organelles from 1923 species, and performed ten-fold cross validation experiments to evaluate KnowPredsite's performance. The experiment
results show that KnowPredsite achieves higher prediction accuracy than ngLOC and
in the dataset that cannot find any Blast hit sequence above a specified threshold can still be correctly predicted by KnowPredsite.
Remote homology detection: We propose a two-stage method called SymDetector for the problem of remote homology detection. We downloaded a benchmark dataset which contains 2,476 protein sequences with mutual sequence identity below 25%. When allowing only one false positive, SymDetector achieves 5,308 true positive pairs while ConSequenceS and PSI-BLAST report less than 1,000 true homologous ones. As the error rate grows, SymDetector can identify 6,906 along with 7,666 sequence pairs given 100 and 1000 false positives permitted separately. Under the same setting, ConSequenceS only reports about 2,000 and 3,500 pairs in the same Fold, which improve PSI-BLAST by 50% in average.
ACKNOWLEDGEMENT
在中研院擔任研究助理與攻讀博士學位的期間,我由衷感謝許聞廉老師與宋 定懿老師給予我許多的指導。無論是在研究上或生活上,許老師與宋老師總是如 嚴師與慈父、慈母般不吝惜地給予我最大的幫助和教誨。在中研院得有兩位老師 如此盡心盡力地指導,是我人生中最大的福氣。許老師與宋老師所展現的嚴謹與 認真的研究精神和態度,更是我學習的典範。我還要感謝交大何信瑩老師、黃鎮 剛老師、楊進木老師和盧錦隆老師在百忙當中擔任我的口試委員,並且針對我的 報告提出許多有待改進的地方,讓我體認到學術研究所需具備的條件,這都是我 未來繼續從事研究所要努力的目標。 此外,我還要感謝生物資訊實驗室的所有夥伴。巫坤品學長在我剛進中研院 的時候,總是像一個大哥般地照顧我,研究上也給予我許多相當寶貴的意見。與 張家銘、邱樺聲、陳鯨太、楊翊文和林晏禕共事期間得到許多的幫助。而林可軒 博士、顏義樺、周文奇、崔殷豪、蘇家玉博士、羅光倫博士(Dr. Allan Lo)、邱 一原和紀俊男等等這些實驗室好夥伴,不僅是在生活上和研究上給予我許多協 助,也讓枯燥的實驗室生活有了許多的歡樂。李政緯博士和戴敏育博士也教導我 許多程式上的技巧。 最後要感謝我的家人。我的父母、岳父母在生活上給予我很大的支持,感謝 他們對我的栽培,使我在博士求學期間無後顧之憂。還有愛妻永菁的陪伴,讓我 有一個堅強和溫軟的依靠。還有在天上的阿嬤,謝謝您一直都這麼疼我,支持我。 謝謝大家!CONTENTS
中文摘要 ...i Abstract... iii Acknowledgement ...vi Contents ... vii List of Figures...xList of Tables ... xii
Chapter 1 Introduction...1
1.1 PROTEIN SECONDARY STRUCTURE PREDICTION...1
1.2 PROTEIN SUBCELLULAR LOCALIZATION PREDICTION...5
1.3 REMOTE HOMOLOGY DETECTION...8
Chapter 2 Synonymous Words and a Protein-dependent Synonymous Dictionary ...13
2.1 SYNONYMOUS WORDS VERSUS SIMILAR WORDS...13
2.2 ADVANTAGES OF SYNONYMOUS WORDS...17
2.3 CONSTRUCTION OF A PROTEIN-DEPENDENT SYNONYMOUS DICTIONARY...20
Chapter 3 Protein Secondary Structure Prediction...24
3.1 METHODS...24
3.1.1 SymPred: a PSS predictor based on SynonymDict ...24
3.1.2 SymPsiPred: a secondary structure meta-predictor...28
3.2 RESULTS...30
3.2.1 Datasets used to develop SymPred...30
3.2.2 Performance evaluation of SymPred and SymPsiPred on the validation set DsspNr-25 ...30
3.2.3 Factor 1: the word length n and the matching criterion ...33
3.2.4 Factor 2: the effect of the dataset size used to compile a dictionary35 3.2.5 Evaluation of the confidence level ...37
3.2.6 Performance comparison with existing methods on EVA benchmark datasets.. ...38
3.3 DISCUSSIONS...41
3.3.1 Evaluation on similar proteins...41
3.3.2 Prediction accuracy affected by enlargement of synonymous words42 3.3.3 Essential Residues ...44
3.3.4 Sequence alignment by using synonymous words ...49
3.4 AVAILABILITY...53
3.5 SUMMARIES...55
Chapter 4 Protein Subcellular Localization Prediction ...58
4.1 METHODS...58
4.1.1 KnowPredsite: a localization prediction method based on SynonymDict ...58
4.1.2 Best BLAST prediction method ...60
4.1.3 Evaluation measure ...60
4.2 RESULTS...61
4.2.1 Determining window size w and similarity threshold k for KnowPredsite...63
4.2.2 Prediction performance of KnowPredsite...65
4.2.3 Site-specific prediction performance...68
4.2.4 Evaluation of the multi-localized confidence score (MLCS)...70
4.3 DISCUSSIONS...72
4.4 AVAILABILITY...81
4.5 SUMMARIES...83
Chapter 5 Remote Homology Detection ...85
5.1 METHODS...85
5.2 RESULTS...93
5.2.1 Datasets and evaluations...93
5.3.1 Sequence Classification: Different Annotations Capture Different Relations ...100 5.3.2 Remote homology detection in the real world ...101 5.3.3 SymDetector Assists to Overcome Difficulties Due to Low Sequence Identities ...104
5.4 SUMMARIES...108 Chapter 6 Concluding remarks and outlook ...109 References ...R-1
LIST OF FIGURES
Figure 1 – A local sequence alignment (or High-scoring Segment Pair, HSP) derived by
PSI-BLAST. ... 16
Figure 2 – Two different transitivity relationships... 19
Figure 3 – The procedure used to extract protein words and synonymous words for a query protein p... 21
Figure 4 – The prediction procedure of SymPred.. ... 24
Figure 5 – Relationships between Q3 accuracy and confidence level on SymPred and PSIPRED. ... 38
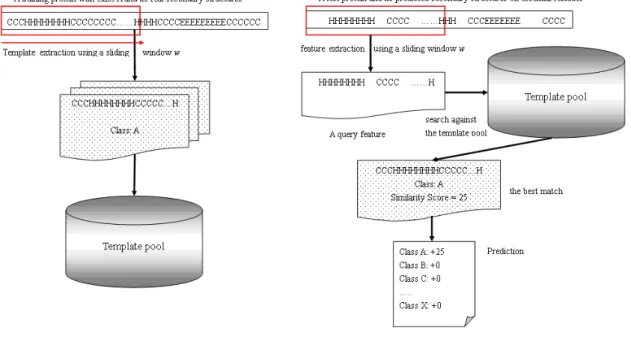
Figure 6 – The main algorithm of ProtoPred. (a) Template extraction (b) The prediction procedure. ... 45
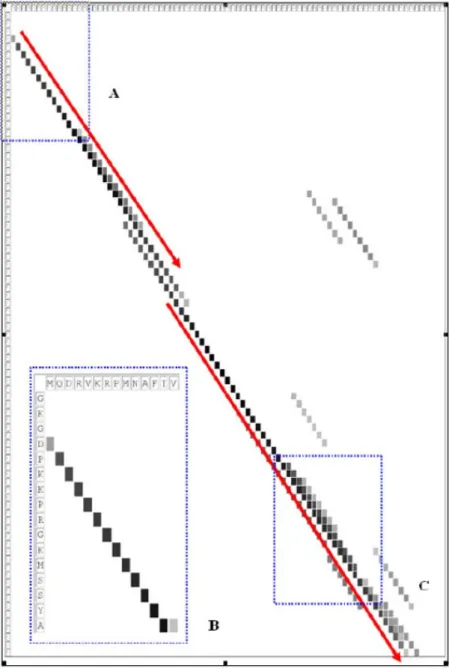
Figure 7 – The distribution of synonymous words shared by 1aab and 1j46_A. ... 51
Figure 8 – The SymPred and SymPsiPred web servers. ... 54
Figure 9 – The prediction procedure of KnowPredsite. ... 58
Figure 10 – The overall accuracies of KnowPredsite using different size of word length. 64 Figure 11 – Matthew’s correlation coefficient (MCC) and accuracy comparison between KnowPredsite and ngLOC... 70
Figure 12 – MLCS analysis.. ... 71
Figure 13 – The KnowPredsite web server. ... 82
Figure 14 – The main idea of SymDetector. ... 87
Figure 15 – The prediction procedure of SymDetector... 89
Figure 16 – Remote Homology Detection and SCOP Classifications: The major four-level hierarchy of SCOP classifications. ... 91
Figure 17 – Performances of our framework on remote homology detection... 95 Figure 18 – Performances of SymDetector on structurally remote homology detection and
Figure 21 – The experiment result of structurally remote homology detection in the real world... 104 Figure 22 –The relationship between sequence identities and confidence scores. ... 105 Figure 23 – The relationship between sequence identities and confidence scores ... 106
LIST OF TABLES
Table 1 – An example of a synonymous word entry in SynonymDict. . ... 23
Table 2 – Another example of a synonymous word entry in SynonymDict. ... 23
Table 3 – Performance comparison of SymPred, SymPsiPred, and PROSP on the DsspNr-25 dataset. . ... 33
Table 4 – The Q3 accuracies of SymPred using exact and inexact matching on different word lengths. ... 34
Table 5 – The Q3 accuracy comparison of SymPred using dictionaries compiled from different percentages of the template proteins. ... 36
Table 6 – Comparison of SymPred’s prediction performance on different-sized template pools. ... 37
Table 7 – The prediction performance of different methods on the EVA benchmark datasets. ... 40
Table 8 – The relationship between the number of distinct synonymous words and the prediction performance... 43
Table 9 – The accuracy (%) of function predictions using different structure sources and different window sizes... 48
Table 10 – The overall accuracies using different thresholds of similarity levels for window size 7 and 8. ... 65
Table 11 – Prediction performance of KnowPredsite, ngLOC, and Blast-hit... 67
Table 12 – Prediction performance of KnowPredsite for each site using precision, accuracy, and MCC. ... 69
Table 13 – Prediction result of EF1A2_RABIT... 74
Table 14 – Prediction result of RASH_HUMAN... 75
Chapter 1 Introduction
1.1
Protein Secondary Structure Prediction
Proteins can perform various functions when they fold into proper three-dimensional
structures. Because determining the structure of a protein through wet-lab experiments
can be time-consuming and labor-intensive, computational approaches are preferable. To
characterize the structural topology of proteins, Linderstrøm-Lang proposed the concept of a protein structure hierarchy with four levels: primary, secondary, tertiary, and
quaternary. The primary structure of a protein refers to its amino acid sequence. The
secondary structure consists of the coiling or bending of amino acids. The tertiary
structure is the folding of a molecule upon itself by disulfide bridges and hydrogen bonds.
The quaternary structure refers to the complex structure formed by the interaction of 2 or
more polypeptide chains. In the hierarchy, protein secondary structure (PSS) plays an
important role in analyzing and modeling protein structures because it represents the
local conformation of amino acids into regular structures.
There are three basic secondary structure elements (SSEs): α-helices (H), β-strands (E), and coils (C). Many researchers employ PSS as a feature to predict the tertiary structure
[1-4], function [5-8], or subcellular localization [9] of proteins. It is noteworthy that,
[10]. Moreover it has been suggested that secondary structure alone may be sufficient for accurate prediction of a protein’s tertiary structure [11].
Current PSS prediction methods can be classified into two categories: template-based
methods and sequence profile-based methods [12]. Template-based methods use protein
sequences of known secondary structures as templates, and predict PSS by finding
alignments between a query sequence and sequences in the template pool. The
nearest-neighbor method belongs to this category. It uses a database of proteins with
known structures to predict the structure of a query protein by finding nearest neighbors
in the database. By contrast, sequence profile-based methods (or machine learning
methods) generate learning models to classify sequence profiles into different patterns. In
this category, Artificial Neural Networks (ANNs), Support Vector Machines (SVMs) and
Hidden Markov Models (HMMs) are the most widely used machine learning algorithms
[13-19].
Template-based methods are highly accurate if there is a sequence similarity above a
predefined threshold between the query and some of the templates; otherwise, sequence
profile-based methods are more reliable. However, the latter may under-utilize the
structural information in the training set when the query protein has some sequence
similarity to a template in the training set [12]. An approach that combines the strengths
of both types of methods is required for generating reliable predictions irrespective of
To measure the accuracy of secondary structure prediction methods, researchers often use
the average three-state prediction accuracy (Q3) accuracy or the segment overlap (SOV)
measure [20-21]. The estimated theoretical limit of the accuracy of secondary structure
assignment from the experimentally determined 3D structure is 88% of the Q3 accuracy
[5, 22], which is deemed the upper bound for secondary structure prediction. However,
PSS prediction has been studied for decades and has reached a bottleneck, since the Q3
accuracy remains at approximately 80 % and further improvement is very difficult, as
demonstrated by the CASP competitions. Currently, the most effective PSS prediction
methods are based on machine learning algorithms, such as PSIPRED [15], SVMpsi [17],
PHDpsi [23], Porter [24] and SPINE [25], which employ ANN or SVM learning models.
The two most successful template-based methods are NNSSP [26-27] and PREDATOR
[28]. They use the structural information obtained from local alignments among query
proteins and template proteins, and their Q3 accuracy is approximately 70%. Thus, the
difference in the accuracy of the two categories is approximately 10%.
In a previous work on PSS prediction [29], we proposed a method called PROSP, which
utilizes a sequence-structure knowledge base to predict a query protein’s secondary structure. The knowledge base consists of sequence fragments, each of which is
associated with a corresponding structure profile. The profile is a position specific
scoring matrix that indicates the frequency of each SSE at each position. The average Q3
Dictionary-based approaches are widely used in the field of natural language processing
(NLP) [30-32]. We generate synonymous words from a protein sequence and its similar
sequences. The definition of a synonymous word is given in the Chapter Two. The major
differences between SymPred and PROSP are as follows. First, the constitutions of the
dictionary (SymPred) and the knowledge base (PROSP) are different. Second, the
scoring systems of SymPred and PROSP are different. Third, unlike PROSP, SymPred
allows inexact matching. Our experiment results show that SymPred can achieve 81.0%
Q3 accuracy on a non-redundant dataset, which represents a 5.9% performance
improvement over PROSP.
There are significant differences between SymPred and other methods in the two
categories described earlier. First, in contrast to template-based methods, SymPred does
not generate a sequence alignment between the query protein and the template proteins.
Instead, it finds templates by using local sequence similarities and their possible
variations. Second, SymPred is not a machine learning-based approach. Moreover, it
does not use a sequence profile, so it cannot be classified into the second category.
However, like machine learning-based approaches, SymPred could capture local
sequence similarities and generate reliable predictions. Therefore, SymPred could
combine the strengths of template-based and sequence profile-based methods. The
experiment results on the two latest independent test sets (EVA_Set1 and EVA_Set2)
show that, in terms of Q3 accuracy, SymPred outperforms other existing methods by 1.4%
1.2
Protein Subcellular Localization Prediction
Protein subcellular localization (PSL) is important to elucidate protein functions as
proteins cooperate towards a common function in the same subcellular compartment [33].
It is also essential to annotate genomes, to design proteomics experiments, and to identify
potential diagnostic, drug and vaccine targets [34]. Determining the localization sites of a
protein through experiments can be time-consuming and labor-intensive. With the large
number of sequences that continue to emerge from the genome sequencing projects,
computational methods for protein subcellular localization at a proteome scale become
increasingly important.
Most existing PSL predictors are based on machine learning algorithms. They can be
categorized by the feature sets used for building prediction models. A group of methods
use features derived from primary sequence [35-39]; some utilize various biological
features extracted from literature or public databases [9, 34, 40-44]. Other features are
also used in different methods, e.g., phylogenetic profiling [45], domain projection [46],
sequence homology [38], and compartment-specific features [47].
A simple and reliable way to predict localization site is to inherit subcellular localization
from homologous proteins. Therefore, in [38] a hybrid method was proposed, which
combined an SVM based method with a sequence comparison tool to find homology to
family (HMG-box) in the SCOP classification. For such cases, it is difficult to discover
the homologous relationship using sequence comparison methods. Profile-profile
alignment methods [48-52] are capable of identifying remote homology; nevertheless,
they are relatively slow.
Most of the PSL prediction systems are established particularly for single-localized
proteins. A significant number of eukaryotic proteins are, however, known to be localized
into multiple subcellular organelles [53-54]. In fact, proteins may simultaneously locate
or move between different cellular compartments and be involved in different biological
processes with different roles. This type of proteins may take a high proportion, even
more than 35% [53]. In addition, the majority of existing computational methods have the
following disadvantages [54]: 1) they only predict a limited number of locations; 2) they
are limited to subsets of proteomes which contain signal peptide sequences or with prior
structural/functional information; 3) the datasets used for training are for specific species,
which is not sufficiently robust to represent the entire proteomes. Thus, most of the
computational methods are not sufficient for proteome-wide prediction of PSL across
various species.
Thus in this study, we propose a synonymous dictionary based approach, called
KnowPredsite, using local sequence similarity to find useful proteins as templates for site
prediction of the query protein. It is designed to predict localization site(s) of single- and
multi-localized proteins and is applicable to proteome-wide prediction. Furthermore, it
only requires protein sequence information and no functional or structural information is
used to vote for the localization sites. The dictionary based prediction scheme has been
shown to be effective in predicting protein secondary structure [29, 38, 55] and local
structure [56]. To evaluate our prediction method, we used the ngLOC dataset [54] to
perform ten-fold cross validation to compare with existing methods. The dataset consists
of ten subcellular proteomes from 1923 species with single- and multi-localized proteins.
KnowPredsite achieved 91.7% accuracy for single-localized proteins and 72.1% accuracy
1.3
Remote Homology Detection
The analysis of novel biological sequences usually starts from searching homologous
sequences in annotated databases. Homologous sequences usually share a common
ancestor, and thus often have similar functions and structures. Based on pairwise
identities and some specific thresholds, sequence search tools retrieve similar annotated
sequences for homology inferences, which are crucial in advanced analysis, such as
protein structure modeling, function predictions, protein-protein interaction networks
analysis, and other property annotations. While structural information assists to increase
the understanding of some target proteins, in many situations one has to analyze a protein
based on its sequence information only. The advent of whole genome sequencing
generates large amounts of protein sequences with undetermined structures and
functions.
Many of these newly sequenced proteins, including those related to diseases, have few
closely related homologs in annotated databases. In addition, as the number of sequenced
genomes and proteins grows, many relationships between distantly related proteins are
observed and needed to be studied further for better understanding the complex structure
of protein universe. Sensitive strategies for analyzing proteins based on simply sequence
information are therefore still demanding and of great importance in genomic era.
Sequence similarity is a frequently used simple metric for homology detection and other
annotation transfers. However, sequence itself provides only incomplete and noisy
sequence [57], while some other homologous sequences might be lost in the search
results. For example, two sequences are usually identified as homologs if their pairwise
similarity is higher than 40%, but the problem becomes rather challenging for sequences
sharing similarity between 20% and 35%, i.e., sequences in the twilight zone. Studies
showed that even for protein pairs with sequence identity less than 25%, about slightly
less than 10% of them still homologous [58]. Thus pairwise sequence similarity has its
limit in detecting distant sequence relationships. Using a threshold of pairwise sequence
identity to determine homology relationship is arguable since it is hard to determine
whether protein pairs having sequence identities lower than this threshold are
homologous. Once pairwise similarity of a sequence pair is below a specified threshold,
we can hardly distinguish whether the pair of sequences is from homology or not.
Therefore many improvements on homology searching and sequence comparisons have
been developed to overcome the limitation of sequence similarity [59-60].
To improve sequence-based analysis strategies, we have to determine the strategies to
represent proteins and corresponding similarity metrics for such representations. Based
on these two issues, homology detection methods can be roughly divided into two
categories: generative models and discriminative models. Given a protein sequence,
generative models focus on describing a set of known proteins with a probabilistic model,
and propose a probabilistic measurement between the query protein and the model. On
devise probabilistic models to represent the protein sequences, such as PSSM [61] and
profiles [62] and profile Hidden Markov Models [63-65]. Some famous packages include
HMMER and HMMERHEAD [66] , COMPASS [67-69], COACH [70], HHSearch [71],
and profile comparison tools such as PRC [72]. While there might be concerns about the
statistical measurement about accuracies for these model-comparison tools [73-74], they
provide best available results among generative model methods. These tools, however,
are time-consuming. Therefore profile-sequence (sequence-profile) search tools that
strike balances between speed and accuracy are de facto standards for large-scale
database searching. PSI-BLAST [75] is definitely the Google for bioinformatics
community, while CS-BLAST/CSI-BLAST [76] provides more sensitive results based on
similar ideas. More detailed comparison could be found in [77].
Discriminative models mainly focus on designing kernel functions based on sequence
patterns to distinguish sequences from two different sets. Most of these methods are
based on support vector machines, and extract frequent patterns from sequences as their
features in the string kernel. The first string kernel might be Fisher’s kernel [78]. Some popular string kernels includes, but not limited to, Pairwise kernel[79], Spectrum and the
Mismatch kernels [80-81], Local Alignment method [82], and Word Correlation Matrices
[83]. Some methods integrate structural and motif information into the feature set, such as
I-Sites [84], eMOTIF-database search [85], Profile-Based Mismatch methods [86] and
Profile-based direct methods [87]. Readers can find more comprehensive information
While discriminative models, especially string kernels methods, achieve better
performance than generative models in some comparative studies [79, 81], these results
often lack of evidences for interpretations, such as HSPs in general alignment tools. In
addition, they may lead to over-fitting due to parameter setting and feature selections.
Therefore, many strategies attempt to improve homology detections based on results of
generative models, especially on results of PSI-BLAST. RankProt [90] attempts to
consider pairwise distances between all the query sequences to construct a relation
network, and increase homology detection results based on analyzing the network
information. Ku and Yona [91] propose a framework based on similar ideas. Since there
are already lots of annotated sequences in current databases, a natural thought is to
integrate information from external sequences to boost homology detection.
A simple attempt to integrate external sequence information in homology detection might
be intermediate sequence search (ISS) [92-93]. In short, if protein sequences A and B are
both homologous to the third sequence C, A and B may be detected as homologs although
they share low identities. Improved frameworks based on similar ideas consist of
SCOOP[94] and SIMPRO[95]. Moreover, some strategies tend to apply information from
the probabilistic models, instead of shared sequences only. Consensus-sequence-based
methods are representatives of these kinds of strategies. PHOG-BLAST [96] make
sequence profiles discrete, and generate consensus for a query sequence by substituting
against NCBInr to obtain its PSSM. Then the original sequence is transformed to a
consensus sequence based on this PSSM. They claim that, by using the informative
consensus sequence as the object in comparisons, homology search results would be
better than traditional PSI-BLAST searches.
Based on above observation, we aim to design a computational framework for detecting
distantly relationships between protein sequences in twilight zone (sequence identities
between 25% and 40%) or midnight zone (sequence identities below 25%) with several
properties. First, it should deal with sequence relationships among proteins with low
sequence identity. Second, the results of the framework should be explainable. That is,
we hope the result can provide evidence, and even high quality alignments to support its
identification, instead of some profiles or a set of dozens of features. Third, the
framework is computationally incremental, and we can easily add or delete sequences in
our training set. Besides, this framework should make best use of the power of current
homology search tools to make it simple to be implemented. As a result, we use
fixed-length protein words as possible homology indicator in this framework. For each
word in separate sequences, we use PSI-BLAST to generate its variations. These
variations would be integrated to estimate relations between novel sequences and
annotated sequences. We demonstrate that this framework achieves high sensitivity in
discovering protein homologs even though they share low sequence similarities with
Chapter 2 Synonymous Words and a
Protein-dependent Synonymous Dictionary
2.1
Synonymous Words versus Similar Words
It is well known that a protein structure is encoded and determined by its amino acid
sequence. Therefore, a protein sequence can be treated as a text written in an unknown
language whose alphabet comprises 20 distinct letters; and the protein’s structure is analogous to the semantic meaning of the text. Currently, we cannot decipher the “protein language” with existing biological experiments or natural language processing (NLP) techniques; thus, the translation from sequence to structure remains a mystery. However,
biologists have found that two proteins with a sequence identity above 40% may have a
similar structure and function. The high degree of robustness of the structure with respect
to the sequence variation shows that the structure is more conserved than the sequence.
In evolutionary biology, protein sequences that derive from a common ancestor can be
traced on the basis of sequence similarity. Such sequences are referred to as homologous
proteins. In terms of natural language, a group of homologous protein sequences can be
treated as texts whose semantic meaning is identical or similar. The homologous
e-value of 0.001. In the alignment, the identical residues are labelled with letters and
conserved substitutions are labelled with + symbols. The sequence identity between the
two sequence fragments in this example is 50% (=20/40).
The idea of treating n-gram patterns as words has been widely used in biological
sequence comparison methods; BLAST is probably the most well known method.
BLAST’s heuristic algorithm uses a sliding window to generate an initial word list from a query sequence. To further expand the word list, BLAST defines a similar word with
respect to a word on the list based on the score of the aligned word pair. A word whose
alignment score is well above a threshold is called a similar word and is added to the list
to recover the sensitivity lost by only matching identical words. However, in BLAST, the
length of a word is only 2 or 3 characters (the default size) for protein sequences and short
words are very likely to generate a large number of false hits of protein sequences that are
not actually semantically related.
In this study, we define synonymous words as follows. Given a protein sequence p, we
use PSI-BLAST to generate a number of significant sequence alignments, called
high-scoring segment pairs (HSPs), between p and its similar proteins sp. All words, i.e.,
n-grams, in p and sp are generated by a sliding window of size n. Given a word w in p, the
synonymous word of w is defined as the word sw in sp that is aligned with w. Please note
that no gap is allowed in either w or sw since there is no structural information in the gap
region. Thus, the major difference between synonymous words and similar words is that
synonymous words are based on sequence alignments (i.e., they are context-sensitive),
the sequence alignment (or High-scoring Segment Pair, HSP) in Figure 1 as an example.
The Sbjct sequence is a similar protein to the Query sequence; therefore, DFDM is
deemed synonymous to the word EWQL if the word length is 4, and FDMV is deemed
synonymous to the next word WQLV. Based on the observation of the high robustness of
structures, if the Query is of known structure and the Sbjct is of unknown structure, we
assume that each synonymous word sw adopts the same structure as its corresponding
word w; i.e., sw inherits the structure of w.
Moreover, different synonymous words sw for a word w should have different similarity
scores to w. To estimate the similarity between w and sw, we calculate the similarity level
according to the number of amino acid pairs that are interchangeable. If two amino acids
are aligned in a sequence alignment, they are said to be interchangeable if they have a
positive score in BLOSUM62. Since a protein word is an n-gram pattern, the range of the
similarity level between the components of a word pair is from 0 to n. For example, in
Figure 2, the similarity level between DFDM and EWQL is 3, and that between FDMV
Figure 1 – A local sequence alignment (or High-scoring Segment Pair, HSP) derived by PSI-BLAST. The identical residues are labelled with letters and conserved substitutions are labelled with + symbols. The alignment in this example shows that the sequence fragment from position 7 to position 46 of the query sequence is very similar to that from position 3 to position 42 in the subject sequence. It is assumed that the two sequences have a similar semantic relation because they form a significant sequence alignment.
2.2
Advantages of Synonymous Words
The major advantages of using synonymous words over similar words are as follows.
First, since the synonymous words are generated from a group of similar proteins, two
irrelevant proteins would use different groups of similar proteins to generate their own
synonymous words. Two irrelevant proteins would be unlikely to have common
synonymous words, even if their original sequences had contained identical words. This
observation implies that synonymous words probably tend to protein-dependent.
Second, two remote homologous proteins might be very likely to have common similar
proteins because of the transitivity of the homology relationship, so they probably share
some synonymous words. Transitivity refers to deducing a possible similarity between
protein A and protein C from the existence of a third protein B, such that A and B as well
as B and C are homologues if the sequence identity between A and B as well as that
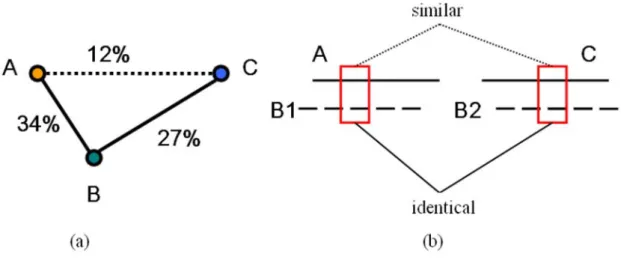
between B and C is above the predefined threshold. Figure 2(a) shows an example of
transitivity relationship among protein A, protein B, and protein C. Protein A and protein
B share sequence identity of 34%, and protein B and protein C share sequence identity of
27%, whereas protein A and protein C only share sequence identity of 12%. Using the
transitivity relationship, remote homologous relationship and local similarity between
protein A and protein C can be detected. In this study, we apply the transitivity concept to
peptide fragments instead of the protein sequences to obtain local similarities between
identical, homologous or non-homologous). If there is a protein word shared by both B1
and B2, the corresponding protein words in protein A and protein C are inferred as locally
similar between protein A and protein C. The shared synonymous word may represent a
possible sequence variation in evolution. Moreover, if protein A and protein C are
remotely homologous, there are likely more shared synonymous words in different
protein B’s to characterize their similarity.
Third, a synonymous word is given a similarity score (i.e., the similarity level) respective
to the word it is aligned with. Therefore, a synonymous word may have different
similarity scores depending on which word it is aligned with. Accordingly, a synonymous
word is a protein-dependent similar word that may also have a similar semantic meaning
Figure 2 – Two different transitivity relationships. (a) Protein A and protein B share sequence identity of 34%, and protein B and protein C share sequence identity of 27%, whereas protein A and protein C only share sequence identity of 12%. We infer the homologous relationship between A and protein C through protein B. (b) Protein A and protein C are aligned with protein B1 and protein B2. The peptide fragments of B1 and B2 besieged by the rectangles are identical, the two corresponding peptide fragments of A and C are considered to be similar.
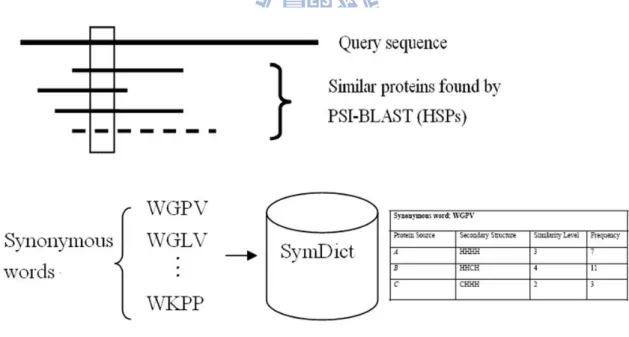
In this study, we construct a protein-dependent synonymous word dictionary that lists
possible synonyms for words of a protein sequence in a dataset. We use synonymous
words as features to infer structural information for the problems of protein secondary
structure prediction, protein subcellular localization prediction, and remote homology
2.3
Construction of a protein-dependent Synonymous
Dictionary
Given a query sequence, we use PSI-BLAST to generate a number of significant
alignments, from which we acquire possible sequence variations. In general, the similar
protein sequences (i.e., the Sbjct sequences) reported by PSI-BLAST share highly similar
sequence identities (between 25% and 100%) with the query, which implies that the
sequences may have similar structures. Therefore, we identify synonymous words in
those sequences.
Using a dataset of protein sequences with known secondary structures, we construct a
protein-dependent synonymous dictionary, called SynonymDict. For each protein p in the
dataset, we first extract protein words from its original sequence using a sliding window
of size n. Each protein word, as well as the corresponding SSEs of the successive n
residues, the protein source p, and the similarity level (here, the similarity level is n), are
stored as an entry in SynonymDict. A protein source p represents the structural
information provider. We then use PSI-BLAST to generate a number of similar protein
sequences. Specifically, to find similar sequences, we perform a PSI-BLAST search of
the NCBInr database with parameters j=3, b=500, and e=0.001 for each protein p in the
dataset. Since the NCBInr database only contains protein sequence information, each
synonymous word inherits the SSEs of its corresponding word in p. A PSI-BLAST search
for a specific query protein p generates a number of local pairwise sequence alignments
between p and its similar proteins. Statistically, an e-value of 0.001 generally produces a
its inherited structure, the protein source p, and the similarity level are stored as an entry
in SynonymDict.
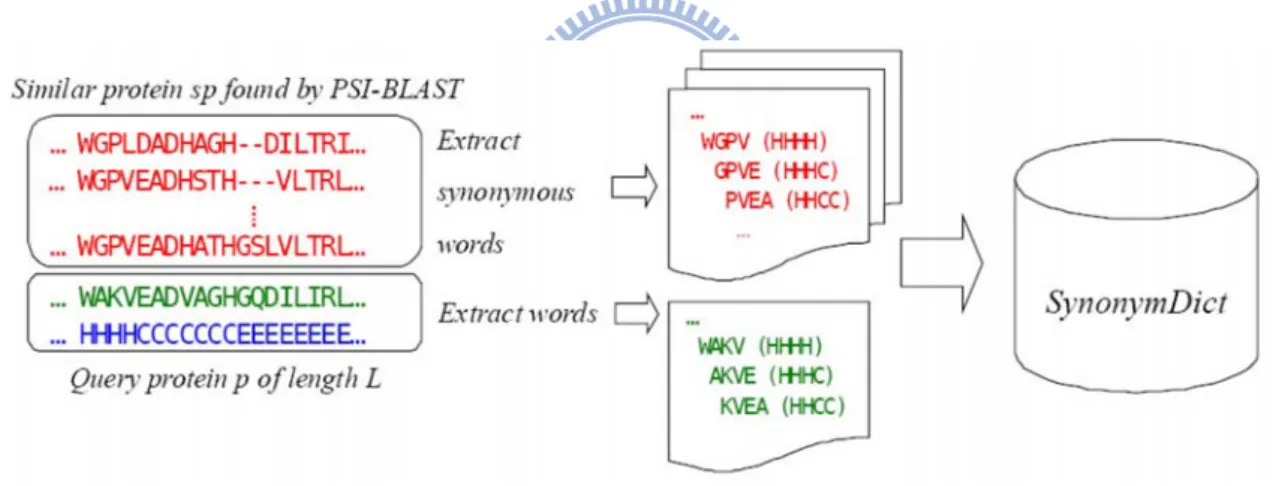
Figure 3 shows the procedure used to extract protein words and synonymous words for a
query protein p. We use a sliding window to screen the query sequence, as well as all the
similar protein sequences found by PSI-BLAST, and extract all words. The query protein
p is the protein source of all the extracted words. Each word is associated with a piece of
structural information of the region from which it is extracted. For example, WGPV is a
synonymous word of WAKV. Since it is from a similar protein of unknown structure, it is
associated with a piece of structural information of WAKV, which is HHHH.
Figure 3 – The procedure used to extract protein words and synonymous words for a query protein p. The procedure used to extract protein words and their synonymous words for a given query protein p (assuming the window size n is 4). We use a sliding window to screen the query sequence and all the similar protein sequences found by PSI-BLAST and extract all words. Each word is associated with a piece of structural information of the region from which it is extracted. The protein source of all the extracted words is the query protein p, since all the structural information is derived from p.
Note that a synonymous word may appear in more than one similar protein when all
similar protein sequences are screened. We cluster identical words together and store the
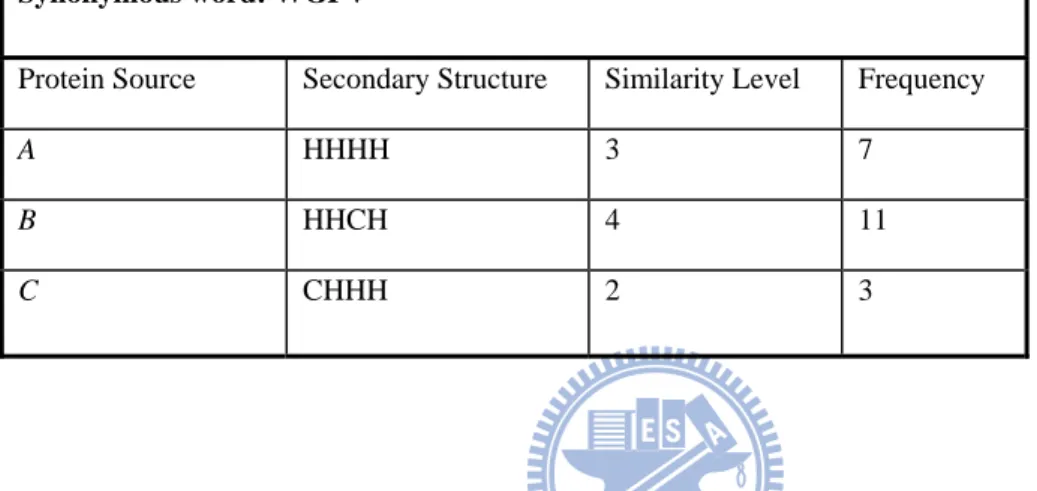
frequency in the synonymous word entry. Table 1 shows an example of a synonymous
word entry in SynonymDict. In the example, WGPV is a synonymous word of proteins A,
B and C, since it is extracted from the similar proteins of A, B and C. The synonymous
word inherits the corresponding structural information of its source, and we can derive
the corresponding similarity levels and frequencies via the extraction procedure. For
example, the similarity level of WGPV in terms of protein source A is 3 and the frequency
is 7. This implies that WGPV has 3 interchangeable amino acids with the corresponding
protein word of A and it appears 7 times among the similar proteins of A found in the
PSI-BLAST search result.
In Table 1, we store the inherited secondary structural information for the synonymous
word WGPV. We can use the structural information to predict the secondary structure for
a given protein sequence. In fact, we can store other protein related information in a
synonymous word entry, such as protein subcellular localization sites, protein function
labels, or structural classes, etc. In Table 2 we show another example of a synonymous
word entry which stores the protein subcellular localization sites. Using the stored
Table 1 – An example of a synonymous word entry in SynonymDict. An example of a synonymous word entry in SynonymDict (assuming the word length n = 4). WGPV is a synonymous word of proteins A, B and C, since it is extracted from the similar proteins of A, B and C. We record the structural information of protein sources to the corresponding synonymous words, and calculate the corresponding similarity levels and frequencies. For example, the similarity level of WGPV in terms of protein source A is 3 and the frequency is 7.
Synonymous word: WGPV
Protein Source Secondary Structure Similarity Level Frequency
A HHHH 3 7
B HHCH 4 11
C CHHH 2 3
Table 2 – Another example of a synonymous word entry in SynonymDict. Three protein sources with known localization sites contain protein words that are aligned to the word MYSKILL in the corresponding sequence alignments. We store the inherited subcellular localization sites for MYSKILL from the protein sources A, B, and C.
Synonymous word: MYSKILL
Protein Source Localization Sites Similarity Level Frequency
A Cytoplasm 5 21 B Nuclear 4 12 C Cytoplasm
Chapter 3 Protein Secondary Structure
Prediction
3.1
Methods
In this section, we present our synonymous dictionary based approach for protein
secondary structure prediction, called SymPred, and a meta-predictor, called
SymPsiPred.
3.1.1 SymPred: a PSS predictor based on SynonymDict
Figure 4 – The prediction procedure of SymPred. An HSP represents a high-scoring segment pair which is a significant sequence alignment reported by PSI-BLAST.
Preprocessing
Figure 4 shows the prediction procedure of SymPred. Given a target protein t, whose
secondary structure is unknown and to be predicted, we perform a PSI-BLAST search on
t to compile a word set containing its original protein words and synonymous words. The
procedure is similar to the construction of SynonymDict. We also calculate the frequency
and similarity level of each word in the word set.
Exact and inexact matching mechanisms for matching words to SynonymDict
Each word w in the word set is used to match against words in SynonymDict, and the
structural information of each protein source in the matched entry is used to vote for the
secondary structure of t. When matching a word to SynonymDict, we consider using
straightforward exact matching and a simple inexact matching. Exact matching is rather
strict, so we consider a possible relaxation of inexact matching to increase the sensitivity
to recover synonymous word matches so that SynonymDict can be utilized to more extent
than by using exact matching. Our inexact matching allows at most one mismatched
character, i.e., allowing a don’t-care character (not a gap) in the words. The matched entries are then evaluated by the following scoring function.
The Scoring Function
Since we use the structural information of protein sources in the matched entries for
structure prediction, we define the scoring function based on its similarity level and
frequency recorded in the dictionary for the following observation. The similarity level
represents the degree of similarity between a protein word and its synonymous word, and
the frequency represents the degree of sequence conservation in the protein’s evolution.
Intuitively, the greater the similarity between two words, the closer they are in terms of
evolution; likewise, the more frequently a word appears in a group of similar proteins, the
more conserved it is in terms of evolution.
To define the scoring function, we consider the similarity level and the frequency of the
word in the word set of t, denoted by Simt and freqt respectively, as well as those of a
protein source i in its matched entry, denoted by Simi and freqi respectively. Note that
Simt and freqt are obtained in the preprocessing stage. To measure the effectiveness of the
structural information of the protein source i, we define the voting score si as min(freqt,
freqi)×(1+min(Simt, Simi)). The structural information provided by i will be highly effective if: 1) w is very similar to the corresponding words of t and i; and 2) w is well
conserved among the similar proteins of t and i.
Take the synonymous word WGPV in Table 1 as an example. If WGPV is a synonymous
word of t (assuming freqt is 5 and Simt is 4), then the voting score of the structural information provided by protein source A is min(5, 7)×(1+min(4, 3)) = 5×(1+3) = 20. Similarly, the voting score provided by protein source B is min(5, 11)×(1+min(4, 4)) = 5×(1+4) = 25, and the score provided by protein source C is min(5, 3)×(1+min(4, 2)) =
3×(1+2) = 9. The structural information provided by protein source B has the highest score in this matched entry and therefore has the most effect on the prediction.
Structure determination
The final structure prediction of the target protein t is determined by summing the voting
scores of all the protein sources in the matched entries. Specifically, for each amino acid x
in a protein t, we associate three variables, H(x), E(x), and C(x), which correspond to the
total voting scores for the amino acid x that has structures H, E, and C, respectively. For
example, if we assume that the above synonymous word WGPV is aligned with the
residues of protein t starting at position 11, then protein A’s contribution to the voting score of H(11), H(12), H(13), and H(14) would be 20. Similarly, protein B would
contribute a voting score of 25 to H(11), H(12), C(13), and H(14); and protein C would
contribute a voting score of 9 to C(11), H(12), H(13), and H(14). The structure of x is
predicted to be H, E or C based on max(H(x), E(x), C(x)). When two or more variables
have the same highest voting score, C has a higher priority than H, and H has a higher
priority than E.
Confidence level
A confidence measure of a prediction for each residue is important to a PSS predictor
∑
⎭⎬⎫ ⎩ ⎨ ⎧ ⎥⎦ ⎤ ⎢⎣ ⎡ + × + + + × = t i i t it freq max Sim Sim
freq x C x E x H x ConLvl , 2 ) ( , 1 2 ) ( ) ( ) ( ) ( 10 ) (
The product in the denominator represents a normalization factor for the scoring function.
Therefore, the confidence level measures the ratio of the voting scores a residue x gets
over the summation of the normalization factors. The range of ConLvl(x) is constrained
between 0 and 9 by rounding down. In the Results section (Section 3.2), we analyze the
correlation coefficient between the confidence level and the average Q3 accuracy.
3.1.2 SymPsiPred: a secondary structure meta-predictor
SymPred is different from sequence profile-based methods, such as PSIPRED, which is
currently the most popular PSS prediction tool. PSIPRED achieved the top average Q3
accuracy of 80.6% in the 20 methods evaluated in the CASP4 competition [100].
SymPred and PSIPRED use totally different features and methodologies to predict the
secondary structure of a query protein. Specifically, SymPred relies on synonymous
words, which represent local similarities among protein sequences and their homologies;
however, PSIPRED relies on a position specific scoring matrix (PSSM) generated by
PSI-BLAST, which is a condensed representation of a group of aligned sequences.
Furthermore, SymPred constructs a protein-dependent synonymous dictionary for
inquiries about structural information. In contrast, PSIPRED builds a learning model
based on a two-stage neural network to classify sequence profiles into a vector space;
It has been shown that combining the prediction results derived by various methods, often
referred to as a meta-predictor approach, is a good way to generate better predictions.
JPred [101] was the first meta-predictor developed for PSS prediction. After examining
the predictions generated by six methods it, JPred returned the consensus prediction
result and achieved a 1% improvement over PHD, which was the best single method
among the six methods. Similar to the concept of the meta-predictor, we have developed
an integrated method called SymPsiPred, which combines the strengths of SymPred and
PSIPRED.
To combine the results derived by the two methods, we compare the prediction
confidence level of each residue from each method and return the structure with the
higher confidence. Since SymPred and PSIPRED use different measures for the
confidence levels, we transform their confidence levels into Q3 accuracies. For each
method, we generate an accuracy table showing the average Q3 accuracy for each
confidence level, i.e., we use the average Q3 accuracy of an SSE to reflect the prediction
confidence.
For example, suppose SymPred predicts that a residue in a target sequence has structure
H with a confidence level of 6, PSIPRED predicts that the residue has structure E with a
confidence level of 6, and the corresponding Q3 accuracies in the accuracy tables are
3.2
Results
In this section, we first reported performance evaluation of SymPred and SymPsiPred on
a validation dataset, and then compared our methods with existing methods on EVA
benchmark datasets.
3.2.1 Datasets used to develop SymPred
We downloaded all the protein files in the DSSP database [102] and generated three
datasets, i.e., DsspNr-25, DsspNr-60, and DsspNr-90, based on different levels of
sequence identity using the PSI-CD-HIT program [103] following its guidelines. In other
words, DsspNr-25, DsspNr-60 and DsspNr-90 denote the subset of protein chains in
DSSP with mutual sequence identity below 25%, 60% and 90%, respectively, and
contain 8297, 12975 and 16391 protein chains, respectively.
3.2.2 Performance evaluation of SymPred and SymPsiPred on the
validation set DsspNr-25
We used all the protein chains in DsspNr-25, DsspNr-60 and DsspNr-90 as template
pools to construct the synonymous dictionaries SynonymDict-25, SynonymDict-60 and
SynonymDict-90, respectively. Furthermore, we used DsspNr-25 as the validation set to
determine the parameters of SymPred by leave-one-out cross validation (LOOCV) since
LOOCV (also known as full jack-knife) has been shown to provide an almost unbiased
estimate of the generalization error [104] and makes the most use the data. (SymPred
does not need to rebuild model unlike most machine learning methods when using
dictionary, were determined, we also used the validation set DsspNr-25 to evaluate the
performance of SymPred and SymPsiPred by 10-fold cross validation and LOOCV. To avoid over-estimation of SymPred’s performance, when testing each target protein in the
DsspNr-25, we discarded all the structural information of proteins t in the template pool if
t and the target protein share at least 25% sequence identity.
Choosing the word length 8 with inexact matching criterion and using SynonymDict-60,
we evaluated the performance of SymPred and SymPsiPred on the validation set
DsspNr-25 by LOOCV and 10-fold cross validation as shown in Table 3. SymPred
achieved the Q3 of 80.5% and the SOV of 75.6% in 10-fold cross validation and the Q3 of
81.0% and the SOV of 76.0% in LOOCV, outperforming PROSP by at least 5.4% in Q3
and 6.9% in SOV.
PSIPRED achieved the Q3 of 80.1% and the SOV of 76.9% on the same test set.
However, the prediction performance of PSIPRED might be over-estimated using our
dataset because PSIPRED was trained separately. Some protein sequences in our dataset
might be in the training set of PSIPRED. Therefore, to have a fair comparison with
PSIPRED, we use EVA benchmark datasets. We show the prediction performance with
existing methods in the sub-section of 3.2.6.
The meta-predictor, SymPsiPred which integrates the prediction power of SymPred and
It is noteworthy that SymPred can predict helical structure more accurately than others.
The Q3Ho is 84.3% which is much better that Q3Eo and Q3Co. Among the three
secondary structure elements, strands (beta sheets) are the most difficult ones to be
predicted. Because strands are formed by the pairing of multiple strands held together
with hydrogen bonds, they involve interactions between linearly distant residues [105].
Using local sequence or structural information could not predict strands very well. This is
one of major challenges and limitations of our method. The Q3Eo of SymPred on
DsspNr-25 is 71.6%, which is lower than Q3Ho by 12.7%, and lower than Q3Co by
6.1%. However SymPsiPred can improve Q3Eo to 75.8% by combining the strength of
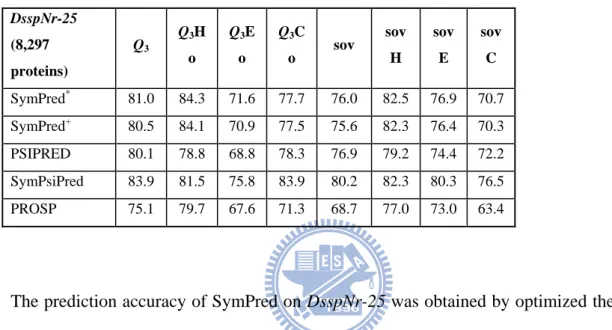
Table 3 – Performance comparison of SymPred, SymPsiPred, and PROSP on the DsspNr-25 dataset. Q3Ho (Q3Eo and Q3Co, respectively) represents correctly predicted helix (strand
and coil, respectively) residues (percentage of helix observed). sovH/E/C values are the specific SOV accuracies of the predicted helix, strand and coil, respectively. SymPred* represents the experiment result using leave-one-out cross validation and SymPred+ represents the experiment result using 10-fold cross validation.
DsspNr-25 (8,297 proteins) Q3 Q3H o Q3E o Q3C o sov sov H sov E sov C SymPred* 81.0 84.3 71.6 77.7 76.0 82.5 76.9 70.7 SymPred+ 80.5 84.1 70.9 77.5 75.6 82.3 76.4 70.3 PSIPRED 80.1 78.8 68.8 78.3 76.9 79.2 74.4 72.2 SymPsiPred 83.9 81.5 75.8 83.9 80.2 82.3 80.3 76.5 PROSP 75.1 79.7 67.6 71.3 68.7 77.0 73.0 63.4
The prediction accuracy of SymPred on DsspNr-25 was obtained by optimized the two
factors: (1) the length of protein words and the matching criterion used for searching the
synonymous dictionary and (2) the size of the template pool, as mentioned earlier.
Below, we analyze the two factors in more detail and the reported accuracies were
obtained by LOOCV.
3.2.3 Factor 1: the word length n and the matching criterion
The choice of word length n is a trade-off between specificity and sensitivity, i.e., long
exact matching criterion is rather strict in terms of matching efficiency, we also compared
the performance of SymPred using exact matching against using inexact matching, which
allows at most one mismatched character.
We evaluated the performance of SymPred using the smallest SynonymDict-25
dictionary. Table 4 shows the Q3 accuracy of SymPred with exact and inexact matching
on different word lengths. The results reveal that the Q3 accuracy is not always increasing
along the increasing word length in both matching mechanisms. The best Q3 accuracies
are reported at n=7 for exact matching and n=8 for inexact matching. That is, 7 identical
residues yield high specificity for the structural features and a single don’t-care character increases the sensitivity to recover sequence matches. In summary, we can improve the
prediction performance by using the inexact matching criterion when searching a
synonymous dictionary and choosing the word length 8.
Table 4 – The Q3 accuracies of SymPred using exact and inexact matching on different word
lengths.
Word length n 6 7 8 9
Q3 (exact matching) 78.2 80.1 78.1 76.2
3.2.4 Factor 2: the effect of the dataset size used to compile a
dictionary
Although the estimated theoretical limit of the accuracy of secondary structure
assignment is 88%, current state-of-the-art PSS prediction methods achieve around 80%
accuracy; there is an 8% accuracy gap. What is the major obstacle to achieving 88%
accuracy? Rost [22] raised this question, and Zhou et al. [106] suggested that the size of
an experimental database is crucial to the performance. However, Rost found that
PHDpsi trained on only 200 proteins was almost as accurate as PSIPRED trained on 2000
proteins, i.e., the performance is insensitive to the size of the training dataset. This is both
the strength and the weakness of machine learning-based approaches. Machine
learning-based approaches can generate satisfactory prediction models using a limited
dataset. On the other hand, the benefit of using more instances is also limited. Though
SymPred is not a machine-learning approach, we still concern the relationship between
its performance and the size of a template pool.
We fist studied the sensitivity of the data set size by compiling the SynonymDict-25 using
different percentages of the protein sequences in DsspNr-25. (The following analysis is
based on word length of 8 and using inexact matching in SymPred.) Table 5 summarizes
the prediction performance of SymPred using different percentages of proteins in the
template pool. The performance improves as the number of template proteins increases.
protein sequences in the template pool, the synonymous dictionary can learn more
synonymous words from those sequences and their similar protein sequences.
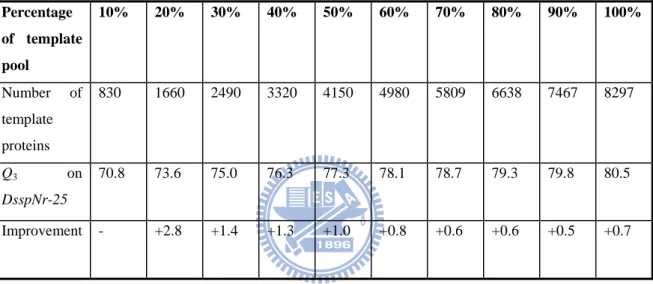
Table 5 – The Q3 accuracy comparison of SymPred using dictionaries compiled from
different percentages of the template proteins. The performance improves as the number of template proteins increases. SymPred’s performance improves between 0.5% and 2.8% each time the number of template proteins is increased by 10%.
Percentage of template pool 10% 20% 30% 40% 50% 60% 70% 80% 90% 100% Number of template proteins 830 1660 2490 3320 4150 4980 5809 6638 7467 8297 Q3 on DsspNr-25 70.8 73.6 75.0 76.3 77.3 78.1 78.7 79.3 79.8 80.5 Improvement - +2.8 +1.4 +1.3 +1.0 +0.8 +0.6 +0.6 +0.5 +0.7
Since SymPred is sensitive to the size of the template pool, we next evaluated its
performance on SynonymDict-60 and SynonymDict-90, which were compiled from much
larger template pools. Table 6 shows SymPred’s prediction performance using different-sized template pools. Its prediction accuracy reaches 81.0% on
SynonymDict-60, a 0.5% improvement over using SynonymDict-25. We can learn more
useful synonymous words from the additional template proteins. The implication is that if
protein A and protein B are similar, say the two share 50% of sequence identity, then
PSI-BLAST can find more similar protein sequences by analyzing A and B together,
protein B. In such a case, if A is the query sequence, PSI-BLAST would not report protein
C due to the low sequence identity. However, the advantage decreases when a larger
number of similar proteins are involved in the template pool, as shown by the result for
SynonymDict-90, which is comprised of proteins whose sequence identities are below
90%. The sequence conservation rate contracts to highly similar sequences, and this leads
to a bias in the weighted scores of the scoring system. Therefore, we adopt
SynonymDict-60 as the primary synonymous dictionary for making predictions.
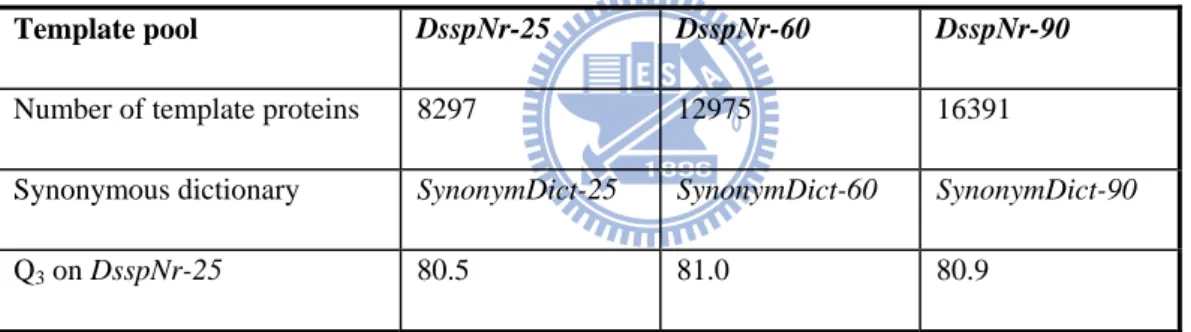
Table 6 – Comparison of SymPred’s prediction performance on different-sized template pools.
Template pool DsspNr-25 DsspNr-60 DsspNr-90
Number of template proteins 8297 12975 16391
Synonymous dictionary SynonymDict-25 SynonymDict-60 SynonymDict-90
Q3 on DsspNr-25 80.5 81.0 80.9
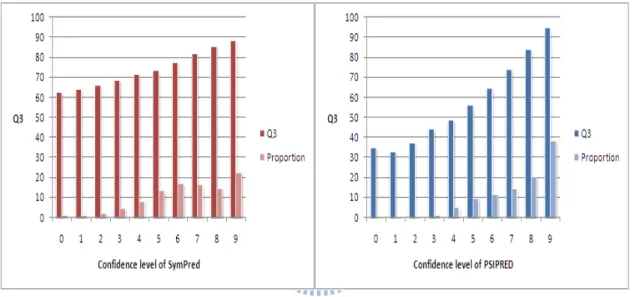
3.2.5 Evaluation of the confidence level
Figure 5 shows the utility of our confidence level and PSIPRED’s confidence level in judging the prediction accuracy of each residue in the test set. The statistics are based on
more than 2 million residues. The correlation coefficient between the confidence levels