國
立
交
通
大
學
資訊科學與工程研究所
碩
士
論
文
細線化前之區塊深度值測試與其對系統設計之
影響
Pre-rasterization blocked-Z test and its impact on
system design
研 究 生:陳 浤 偉
指導教授:鍾 崇 斌 博士
細線化前之區塊深度值測試與其對系統設計之
影響
Pre-rasterization blocked-Z test and how it impacts
system design
研 究 生:陳 浤 偉
Student:
Hong-Wei Chen指導教授:鍾 崇 斌 博士 Advisor:Dr. Chung-Ping Chung
國 立 交 通 大 學
資 訊 科 學 與 工 程 研 究 所
碩 士 論 文
A Thesis
Submitted to Institute of Computer Science and Engineering
College of Computer Science
National Chiao Tung University
in Partial Fulfillment of the Requirements
for the Degree of
Master
In
Computer Science
Sep. 2009
Hsinchu, Taiwan, Republic of China
中華民國 九十八 年 九 月
細線化前之區塊深度值測試與其對系統設計之
影響
學生:陳浤偉 指導教授:鍾崇斌 博士 國立交通大學資訊科學與工程研究所 碩士班摘 要
本論文提出一個區塊式深度值測試方法來有效的減少在細線化之前的資料 量。在繪圖管線中,不管是否存在其他深度值測試方法,區塊式深度值測試都可 以和既有的繪圖管線完美的結合,而且區塊式深度值測試的效果比起以物件為單 位的深度值測試好許多。在本論文中,會在細線化前將物件切分成許多適當大小 的區塊且透過區塊式深度值的測試來過濾掉大部分被擋住的區塊,以此來減少繪 圖管線後續的工作量和儲存空間。有主要兩個優點:一來是可以透過單次的深度 值測試過濾掉許多網格(一個區塊內的所有網格);二來是可以減少細線化不必要 的運算量。而為了實現本論文,需要額外的一塊區塊深度值儲存器和切分區塊及 區塊深度測試的電路。 雖然本論文會加深整個繪圖管線的深度,但不會影響整體繪圖管線的總處理 量,甚至可能提高。其原因是對網格作運算是整體繪圖管線的瓶頸處,而本論文 可以有效得減輕這些瓶頸處。ii
Pre-rasterization blocked-Z test and how it impacts
system design
Student:Hong-Wei Chen Advisor:Dr, Chung-Ping Chung
Institute of Computer Science and Engineering National Chiao-Tung University
Abstract
We propose a blocked-Z test to effectively eliminate unnecessary data traffic
between triangle setup and rasterization. This method works seamlessly with the
existing rendering pipeline, with or without those existing fragment-based hierarchical
Z/early Z/Z tests. And it performs much better than primitive-based Z test, in terms of
data structuring and coverage. In this method, primitives are blocked into proper sizes
and blocked-Z tested to filter out the most of hidden blocks, easing the storage and
workloads of subsequent rendering tasks. Advantage of this method comes from
two features: the blocked test, in which only one test may be sufficient to filter out a
group (of the block size) of fragments; and the place of the test saving even
unnecessary rasterization. Block sizes are determined statically without hardware nor
runtime overhead, and an additional blocked-Z buffer, of the size of [Z buffer/(#
fragments in block)], plus blocking and Z-test circuitry, are required. This design
lengthens the rendering pipeline, but will not affect the throughput; in fact, it may
even increase throughput, since a common wisdom is that the fragment-based pipeline
stages are graphics rendering bottlenecks, and our proposal effectively relieves these
bottlenecks. Experimental results using Doom3 and Quake4 with various screen sizes
iii
誌謝
這兩年來的碩士研究生涯中,首先,我要感謝我的指導教授 鍾崇斌老師。 感謝他嚴謹與耐心的指導,使我在我的碩士研究中,獲得許多寶貴的建議與方 向,並且學習到如何以不同的角度去看待研究事物,並對各種可能性加以討論並 提出質疑,而得以完成此碩士論文及順利通過畢業口試。此外,感謝我的畢業口 試委員 單智君教授、謝萬雲教授、謝錫堃教授,由於他們的建議,使得此論文 研究更加完整。 同時,我也要感謝實驗室的學長姐、同學及學弟們在各方面,給我很大的幫 助。特別感謝惠親學姐辛苦地帶領與指導、喬偉豪學長及翁綜禧學長的建議與幫 忙,以及;感謝同樣在GPU計劃中的秀青、東霖及之傑彼此的討論、相互打氣與支 持。沒有你們的幫助,我也無法如此順利地完成此碩士論文。還有實驗室的學弟 CPR跟阿Sa,如果實驗室少了你們,我們每天的歡笑也會少了很多。 此外,感謝我的家人在背後默默的支持我,即使你們對於研究上沒辦法給予 我太多意見,但有你們在一旁關心我,也讓我能更堅定與堅毅地繼續我的研究之 路。最後,女友妤珍在背後的支持更是我前進的動力,沒有妤珍的體諒、包容, 相信這兩年的生活將是很不一樣的光景。 陳浤偉 2009.9iv
Contents
摘 要... i Abstract ...ii 誌謝 ... iii List of Figures ... viList of Tables ... vii
Chapter 1 Introduction ... - 1 -
1.1 Motivation ... - 2 -
1.2 Objective ... - 2 -
1.3 Organization about this thesis ... - 2 -
Chapter 2 Background and related works ... - 3 -
2.1 Programmable GPU pipeline ... - 3 -
2.2 Per-fragment early-Z test ... - 6 -
2.3 Hierarchical Z test ... - 7 -
2.4 Related works ... - 9 -
2.4.1 Tile-based early-Z test ... - 9 -
2.4.2 Coarse Z filtering ... - 10 -
Chapter 3 Design ... - 14 -
3.1 Design overview ... - 14 -
3.2 Primitive blocking ... - 15 -
3.2.1 Block-based edge walk ... - 18 -
3.2.1.1 Intersection generator ... - 18 -
3.2.1.2 Edge-block generator... - 20 -
3.2.1.3 Z strides and full cover bound blocks ... - 21 -
3.2.2 Blocked row-span iterator... - 22 -
3.3 Blocked-Z test ... - 23 -
3.4 Block-based rasterization ... - 25 -
3.5 Data flow of our proposed method ... - 28 -
3.6 The rendering pipeline with blocked-Z test ... - 28 -
Chapter 4 Experiment and results ... - 30 -
4.1 Experiment goal and environment ... - 30 -
4.2 Experiment results ... - 31 -
4.2.1 Filtering ratio of blocked-Z test ... - 31 -
4.2.2 Extra overhead of blocked-Z test ... - 33 -
4.2.2.1 Extra workload of blocked-Z test ... - 33 -
4.2.2.2 Extra storage requirement and hardware ... - 34 -
v
4.3 Performance compare with tile-based early-Z test [6] ... - 39 - Chapter 5 Conclusion ... - 41 - References ... - 42 -
vi
List of Figures
Figure 2-1-1 Programmable GPU pipeline ... - 4 -
Figure 2-1-2 Horizontal scan line on the primitive ... - 5 -
Figure 2-3-1 The rendering pipeline with Hierarchical Z test ... - 7 -
Figure 2-3-2 2x2 Hierarchical Z buffer Concept ... - 8 -
Figure 2-4-1-1 The flow chart of tile-based early-Z test ... - 10 -
Figure 2-4-2-1 The rendering pipeline with coarse Z filtering ... - 11 -
Figure 2-4-2-2 Two different method of scan conversion ... - 12 -
Figure 2-4-2-3 The example of tile mask. ... - 12 -
Figure 2-4-2-4 The pseudo code of coarse Z filtering ... - 13 -
Figure 3-1-1 The rendering pipeline with proposed method ... - 14 -
Figure 3-2-1 A sketch of primitive blocking. ... - 16 -
Figure 3-2-2 Flowchart of primitive blocking hardware ... - 17 -
Figure3-2-1-1-1 Example of primitive blocking... - 18 -
Figure 3-2-1-1-2 Generation of Y value representing a given blocked-row ... - 20 -
Figure 3-2-1-2-1 The example of edge-block generator ... - 21 -
Figure 3-2-1-3-1The sketch of calculating Z strides and full cover bound blocks ... - 22 -
Figure 3-3-1 The configuration of block-Z buffer ... - 24 -
Figure 3-3-2 The flow chart of blocked-Z test ... - 25 -
Figure 3-4-1 The sketch of block-based rasterization ... - 26 -
Figure 3-4-2 The edge-fragment buffer for a blocked-row ... - 27 -
Figure 3-4-2 The flow chart of block-based rasterization ... - 27 -
Figure 3-5-1 the data flow of our proposed method, blocked-Z test... - 28 -
Figure3-6-1 The rendering pipeline with blocked-Z test ... - 29 -
Figure 4-2-1-1 The filtering ratio of Doom3 with various block sizes ... - 32 -
Figure 4-2-1-2 Filtering ratio of Qauke4 with various block sizes ... - 32 -
Figure 4-2-2-1-1 Extra workload of blocked-Z test with various block sizes ... - 34 -
Figure 4-2-2-1-2 Extra workload of blocked-Z test with various block sizes ... - 34 -
Figure 4-2-3-1 The total reduced workload of blocked-Z test with various screen resolutions. (a) 320x240 pixels (b) 640x480 pixels (c) 1280x1024 pixels (d) 1600x1200 pixels ... - 38 -
Figure 4-3-1 Filtering ratio of blocked-Z test versus tile-based early-Z test for Doom3 - 39 - Figure 4-3-2 Filtering ratio of blocked-Z test versus tile-based early-Z test for Quake4 - 39 - Figure 4-3-3 workload reduction of blocked-Z and tile-Z test ... - 40 -
vii
List of Tables
Table 3-2-1-1-1 Direction table for determining edge-block ... - 20 -
Table 4-2-2-2-1 Extra storage requirement ... - 35 -
Table 4-2-2-2-2 Extra hardware of primitive blocking and blocked-Z test ... - 35 -
Chapter 1 Introduction
Nowadays, 3-D scenes have greatly number of objects and high depth
complexity due to emphasizing more and more visual realism. When
three-dimensional (3-D) computer graphics process such these scenes, the workloads
of each unit are extremely high, especially the pixel shader. It is because the pixel
shader needs to process texture mapping, shadow, or some complex computation to
get final color for every fragment. For example, the complex scenes may have several
hundred thousand objects in one frame and may generate several hundred million
fragments to be processed in pixel shader.
In order to reduce the workload of pixel shader, 3-D computer graphics do the
per-fragment early-Z test before pixel shader to filter out some invisible fragments. It
can alleviate the workload of pixel shader significantly. However, the per-fragment
early-Z test has large workload since it has to test the Z value for every fragment. So
there is another approach, generally called primitive-level early-Z test, to reduce the
workload of per-fragment early-Z test. Primitive-level early-Z test processes the Z test
based on primitive before rasterization, opposed to the fragment, it can filter out many
invisible fragments which compose of primitive in one time. It even can reduce the
workload of rasterization. But the effect of primitive-level early-Z test cannot
guarantee since the primitive can be filter out when the primitive is totally occluded
by another primitives.
In this thesis, we are going to design a low computation early-Z test before
rasterization to reduce the workloads of per-fragment early-Z test and rasterization.
And it can perform better than primitive-level early-Z test, in terms of data structuring
- 2 -
1.1 Motivation
As we can know, the per-fragment early-Z test has the highest filtering ratio. It
can filter out the most occluded fragments than other coarse early-Z test since
fragment is the smallest granularity in rendering pipeline. However, per-fragment
early-Z test has serious workloads. It needs to perform the depth test for all fragments
in one frame, and the fragment count in one frame is very high.
Primitive-level early-Z test can alleviate the workload of per-fragment early-Z
test since it would filter out some totally occluded primitives before rasterization.
However, primitive-level early-Z test only can filter out totally occluded primitives.
The partial occluded primitives would still perform the subsequent rendering stage. It
may cause some redundant operation.
1.2 Objective
We are going to propose a low computation early-Z test before rasterization for
achieving the high filtering ratio as possible. It can filter out the partial occluded
primitives before rasterization. Hence, the proposed method can reduce more
workloads of rasterization and per-fragment early-Z test.
1.3 Organization about this thesis
The origination of follow sections in this thesis is: Chapter 2 introduces
background of programmable GPU pipeline, two well-known early-Z test approaches
and related works. Chapter 3 introduces our proposed method, blocked-Z test. We will
introduce how to generate blocks, how to perform depth test based on block, and how
to perform rasterization for blocks. Experiment results are shown in chapter 4.
- 3 -
Chapter 2 Background and related
works
In section 2.1, we will give a brief concept of programmable rendering pipeline
in Graphic Processing Unit (GPU). In section 2.2, we will introduce the per-fragment
early-Z test briefly. In section 2.3, we will introduce the Hierarchical Z test which is
one of well-known primitive-level early-Z test. Finally, some related works will be
study.
2.1 Programmable GPU pipeline
Graphic processing unit (GPU) is a kind of application specific processor. It
targets on graphics rendering, which display the two-dimensional image (2D) of
three-dimensional (3D) space. The modern GPU become more and more complex due
to the demand for 3D scene visual realism are increasing.
Nowadays, programmable GPU pipeline is the popular solution for the
requirement of performance and flexibility in computer graphics. Different from the
fixed function GPU pipeline, programmable GPU pipeline has two new units: vertex
shader and pixel shader. These two new units can provide the flexibility to deal with
any kind of operation requirement, like the 3D games, virtual realities …etc.
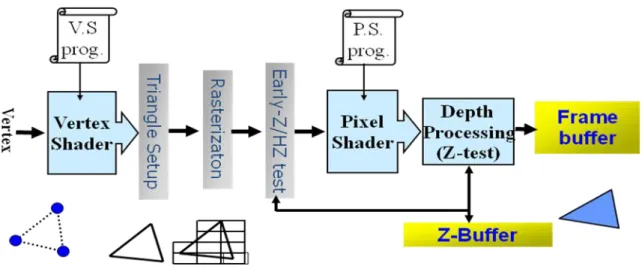
The programmable GPU pipeline is shown in Figure 2-1-1. There are several
stages in this pipeline, which are vertex shader, triangle setup, rasterization,
- 4 -
Figure 2-1-1 Programmable GPU pipeline
The first stage, vertex shader, majorly performs vertex’s coordinate translations.
It also can perform some complex mathematics operations on the vertex data by
vertex shader program. The translations are a serial of coordinate translations from
vertex’s local coordinate to world space coordinate and finally translate to screen
coordinate. After coordinate translations, vertex shader performs the Clipping to clip
some objects which are not in the view volume.
After vertex processing, it sends the translated vertex data to triangle setup stage.
Triangle setup is responsible for assembling the primitive according to their screen
coordinate. It is finding three vertices which are belong to the same primitive and
assemble these three vertices into primitive. Moreover, triangle setup calculates the
edge slope and some primitive information after assembling the primitive. Based on
the primitive information and edge slope, the later stage, rasterization, performs the
interpolation of primitive. On the other words, rasterization interpolates each
primitive into many fragments. The difference between fragment and pixel is that
fragment has the depth information. When the fragments output to the frame buffer, it
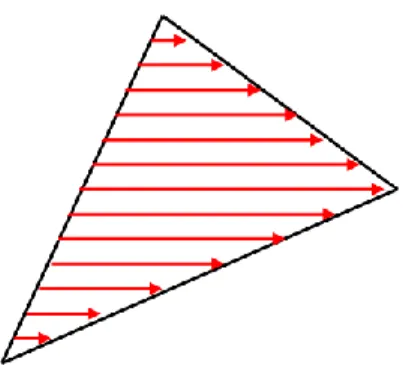
- 5 -
line on the primitive to generate fragments, which is shown in Figure 2-1-2.
Figure 2-1-2 Horizontal scan line on the primitive
After rasterization, early-Z test performs the depth test to filter out some
invisible fragments. The brief concept and operation will be introduced in later
section. The passing early-Z test fragments will be sent to pixel shader. The major
work of pixel shader is coloring the fragments. It may directly perform some
computation to get the color or perform the texture mapping to get the color. It also
can perform some complex computation to get the special effect like multi-texturing
by pixel shader program. After pixel shader, the fragment with final color will be sent
to depth processing stage.
Since there are many fragments located on the same screen coordinate, it needs
to perform the depth test to find out which fragments will display on the screen and
filter out those invisible fragments. The invisible fragments mean that they are
occluded by the smallest depth value of fragment. The main operation is that depth
processing compares the Z value of the executing fragment with the corresponding Z
value on the Z buffer. If Z value of the executing fragment is smaller, then write this
fragment to the frame buffer and update the Z buffer. Otherwise, filter out this
fragment. Finally, having the smallest Z value’s fragments will on the frame buffer for
- 6 -
2.2 Per-fragment early-Z test
In the previous section mentions, the depth processing filters out all fragments
which are occluded by previously drawn fragments according to a comparison of their
depth value. The depth processing is performed after pixel shader. However, the pixel
shader usually has the most complex computation in the rendering pipeline. Executing
one fragment in pixel shader needs to spend much time. It might be inefficient to
perform all fragments in pixel shader since many fragments will be filtered out
afterwards.
In consequence, modern GPUs will perform depth test before pixel shader. Since
the depth test is performed before pixel shader and based on the fragment, it is called
the per-fragment early-Z test. Instead of traditional GPUs, only the passing
per-fragment early-Z test fragments need to perform in pixel shader. The operation of
per-fragment early-Z test is comparing the Z value of executing fragment with the
corresponding Z value on the Z buffer or extra early-Z buffer. The extra early-Z buffer
needs to be updated by the Z value on Z buffer. Since the order of fragment is not
according to the depth order, the performance of this method depends on the
executing order of fragments. The best case is where the primitives are fully sorted
front-to-back, it almost can filter out all invisible fragments.
Although per-fragment early-Z test can filter out many invisible fragments to
alleviate the workload of pixel shader, it has two problems. One is the workload of
per-fragment early-Z test is serious. Since the fragment count in one frame is very
enormous. For example, the fragment counts in high resolution screen even above
hundred millions. Per-fragment early-Z test would compare the depth value hundred
millions times. Another one is the data consistency problem. When the fragment
- 7 -
pixel processing in pixel shader. After pixel processing, the newest Z value will
update to the Z buffer. During this period, per-fragment early-Z test will not get the
newest Z value even the fragment which has newest Z value passing the depth test.
Therefore, it may miss some invisible fragments owing to data consistency problem.
2.3 Hierarchical Z test
In order to quickly filter out invisible primitives, some primitive-level early-Z
test for filter out entire or part of primitives in front of rasterization are usually
adopted. Hierarchical Z test is one of the famous approaches. Hierarchical Z test uses
two level depth tests before pixel shader. One of the depth tests is between
rasterization and pixel shader, the same place with per-fragment early-Z test. Another
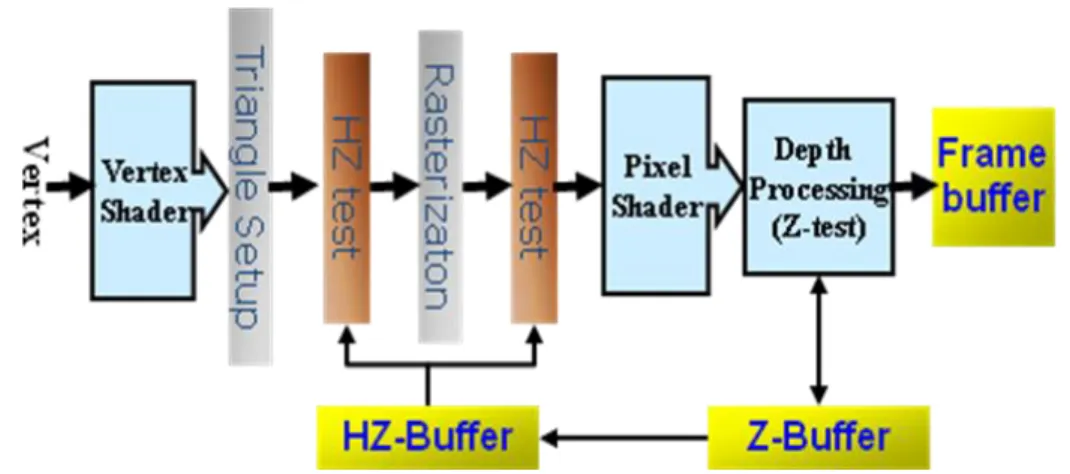
one is extra added before the rasterization. Figure 2-3-1 shows the rendering pipeline
with hierarchical Z test. It can filter out the entire primitive in one depth comparison.
So, hierarchical Z test can improve the utilization of rasterization and per-fragment
early-Z test.
- 8 -
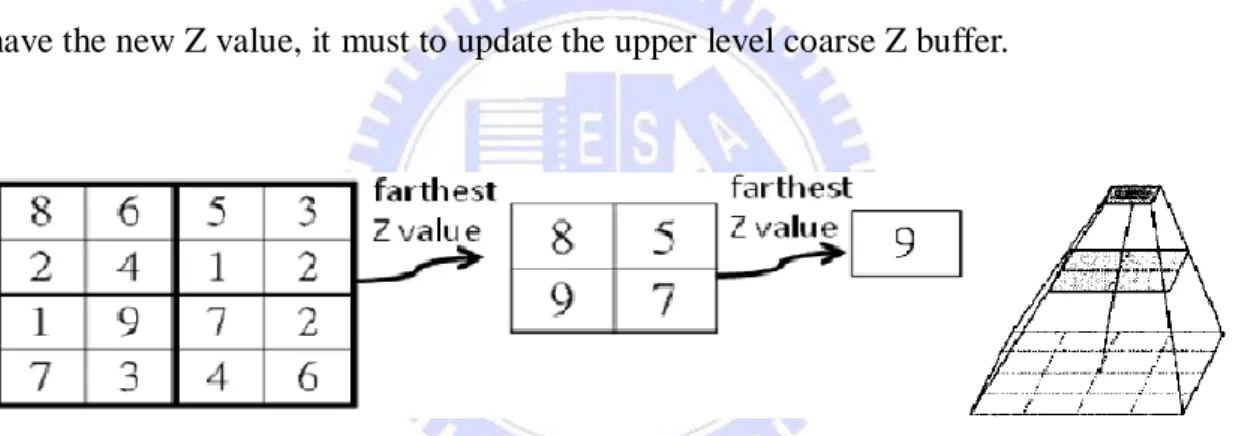
Now we will introduce the detail operation of hierarchical Z test. Hierarchical Z
test majorly uses the Z pyramid to perform depth test. The Z pyramid is shown as in
Figure 2-3-2. The first level in the Z pyramid is the original Z buffer. And from first
level Z buffer, it combines four Z values at each level into one Z value to the next
upper level coarse Z buffer by choosing the farthest Z value. Each entry in the Z
pyramid, except the first level Z buffer, represents the farthest Z value for a square
area of the Z buffer. At the most upper level of the Z pyramid is a single Z value
which is the farthest Z value in the whole frame. When every time the original Z
buffer has the new Z value to be write in, it has to check if needing to update the
upper level coarse Z buffer. If the Z values in the square area of original Z buffer all
have the new Z value, it must to update the upper level coarse Z buffer.
Figure 2-3-2 2x2 Hierarchical Z buffer Concept
In order to use the Z pyramid to perform the depth test for primitives, first it will
find the most suitable level Z buffer which the corresponding area in the frame cover
the bounding box of the primitive. If the nearest Z value of primitive is farther than
choosing the most suitable level Z buffer, it represents this primitive is hidden by
other primitives and can be filtered out. And the primitive which passing this stage
depth test will perform depth test again after rasterization.
Although hierarchical Z test can filter out entire primitive to improve the
- 9 -
is that updating the Z pyramid needs to take lots of times. And Z pyramid also has the
data consistency problem, as same with per-fragment early-Z test. Another problem is
the efficiency of hierarchical. We can know obviously that filtering out one primitive
is harder than one fragment. If the primitive has large area in the screen, it is hard to
be totally occluded by other primitives. Or the primitives intersect each other
physically, we cannot decide which primitive can be filtered out. These two kinds of
primitives would affect the performance of hierarchical Z test.
2.4 Related works
2.4.1 Tile-based early-Z test
Tile-based early-Z test [6] performs the early-Z test before rasterization. The
main concept of tile-based early-Z test is that the primitives are divided into many
tiles and perform the early-Z test based on the tile. Differently with hierarchical Z test,
tile-based early-Z test can filter out entire or part of primitives. The problem which
the primitives are partial covered by another primitives or intersect physically will
improve.
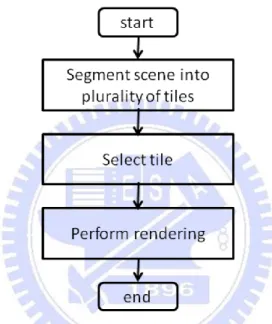
Figure 2-4-1-1 shows the flow chart of tile-based early-Z test. First, the scene is
segmented into plurality of tiles for performing a rendering with respect to a primitive.
Select tile stage is finding the tiles which the primitive are covered and perform the
depth test for every tiles. The tile Z value is the nearest Z value of primitive. If the tile
Z value is larger than corresponding Z value on tile-Z buffer, this tile can be filtered
out. Otherwise, this tile needs to update the tile Z buffer and performs the rendering.
The premise of updating the tile Z buffer is the tile which is completely included in
- 10 -
buffer, another primitives which is not covered by this tile may be filter out. So only
the tile which is completely included in the primitive has the authority to check if
needing to update the tile Z buffer. The rule of updating the tile Z buffer is that the
farthest tile Z value, which is represented by the farthest Z value of primitive, is
smaller than corresponding Z value on tile Z buffer. Then using farthest Z value of
primitive updates the tile Z buffer.
Figure 2-4-1-1 The flow chart of tile-based early-Z test
Since the tile-based early-Z test can filter out entire or part of invisible primitives
before rasterization, the workload reduction of rasterization and per-fragment early-Z
test will higher than hierarchical Z test. However, the tile Z value is representing the
nearest Z value of primitive. It’s not a precise Z value for tiles. If we can calculate the
more precise tile Z value, the performance will improve more.
2.4.2 Coarse Z filtering
- 11 -
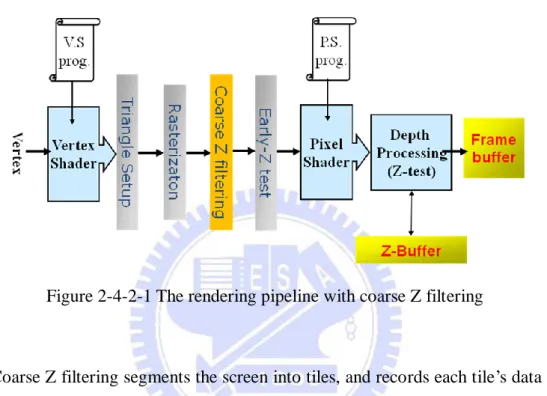
per-fragment early-Z test. Figure 2-4-2-1 shows the rendering pipeline with coarse Z
filtering. As we can see, coarse Z filtering performs the tile-level early-Z test prior to
per-fragment early-Z test. It can reduce the workload of per-fragment early-Z test and
reduce the memory bandwidth of Z buffer.
Figure 2-4-2-1 The rendering pipeline with coarse Z filtering
Coarse Z filtering segments the screen into tiles, and records each tile’s data (tile
mask and Z values) for tile-level depth test when performing the rasterization. In
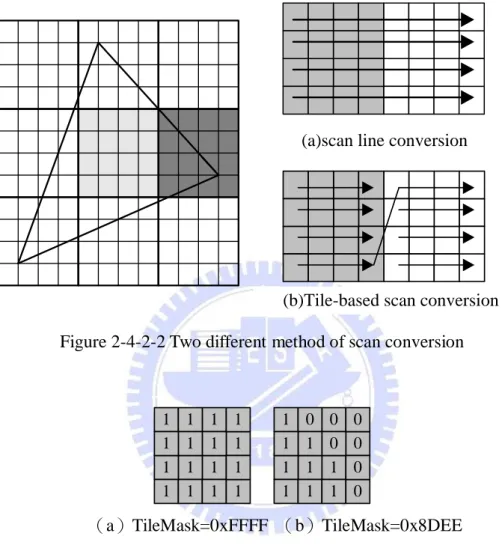
order to record each tile’s data, the method of scan conversion in rasterization will
follow the tile-based conversion, not scan line anymore. Figure 2-4-2-2(b) shows the
tile-based scan conversion. The tile mask records which position in the tile having the
fragment data. Figure 2-4-2-3 shows the example of the tile mask. And extra filtering
buffer are needed to record the Z values in the tile.
After generating one tile data, coarse Z filtering performs the tile-level depth test.
If the minimum Z value in the tile is larger than corresponding Z value in filtering
buffer, this tile is occluded by another primitives and can filter out this tile. If the tile
passes the coarse Z filtering, this tile has to check if needing to update the filtering
- 12 -
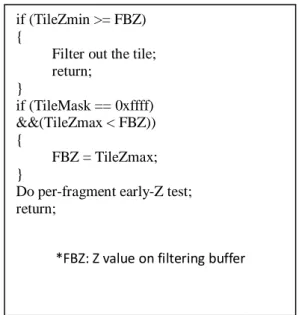
early-Z test [6]. Here will not introduce the method again. Figure 2-4-2-4 shows the
pseudo code of coarse Z filtering.
(a)scan line conversion
(b)Tile-based scan conversion
Figure 2-4-2-2 Two different method of scan conversion
1 1 1 1 1 1 1 1 1 1 1 1 1 1 1 1 1 0 0 1 1 1 0 0 1 1 0 1 1 1 0 0 (a)TileMask=0xFFFF (b)TileMask=0x8DEE
Figure 2-4-2-3 The example of tile mask. (a) represents the tile which is totally
- 13 -
Figure 2-4-2-4 The pseudo code of coarse Z filtering
The coarse Z filtering has the more precise tile Z value than tile-based early-Z
test [6], so it can filter out more invisible tiles. However, coarse Z filtering cannot
reduce the workload of rasterization since coarse Z filtering perform depth test after
the rasterization.
if (TileZmin >= FBZ) {
Filter out the tile; return; } if (TileMask == 0xffff) &&(TileZmax < FBZ)) { FBZ = TileZmax; }
Do per-fragment early-Z test; return;
- 14 -
Chapter 3 Design
3.1 Design overview
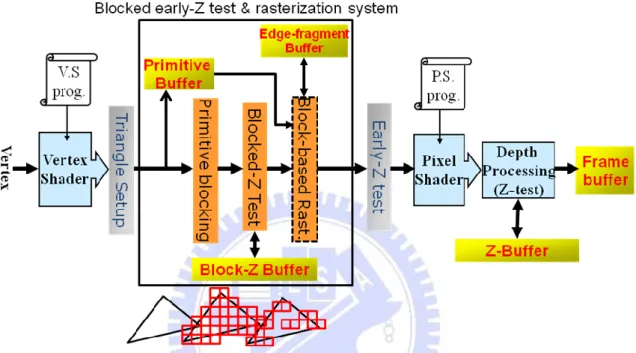
Figure 3-1-1 The rendering pipeline with proposed method, blocked-Z test, included. Note that rasterization is now replaced by block-based rasterization
Figure3-1-1 shows the rendering pipeline with the proposed method, blocked-Z
test. The indicated range is the extra components that our method added. The original
rasterization is now replaced by block-based rasterization. The main concept is
processing early-Z test by using block, which has its own depth value, to be a test unit
before rasterization. Blocked-Z test can filter entire or part of primitives. It can reduce
the workloads of rasterization and per-fragment early-Z test since fragments within a
block can be filtered in one operation. The data consistency problem can be solved by
using extra blocked-Z buffer to record the newest depth value in time.
The following section will introduce the function of every extra added
- 15 -
the primitive and calculates the nearest and farthest Z values of each block. The
primitive buffer needs to store the current processing primitives for generating
fragments in block-based rasterization. Blocked-Z test compares the nearest Z value
of blocks with corresponding Z value in blocked-Z buffer to decide whether the
blocks can be filtered or not. The blocked-Z buffer always has the newest depth value,
not wait updating from Z buffer. Block-based rasterization interpolates fragments for
blocks which pass the blocked-Z test, and then passes fragments to per-fragment
early-Z test. The edge-fragment buffer stores the edge-fragments data in every
block-row. It can reduce the redundant computation in block-based rasterization.
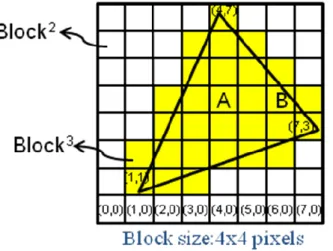
3.2 Primitive blocking
First of all, the screen will be blocked, like the Figure 3-2-1. Every grid is one
block, and every block has its own block coordinate. The origin of the coordinates is
the left-bottom block. For example, the top vertex of primitive locates on the (4,7)
block coordinate. Since every block on the screen is a two-dimensional block, which
we note this kind of block as block2. Then primitive blocking calculates all blocks
which are covered by the primitive. The blocks which generate from primitive
blocking have Z values. They are three-dimensional blocks, which we note this kind
of blocks as block3. The shaded blocks in figure 3-2-1 all are block3s.
The attributes of one block3 are the following:
1. Block3 coordinate: (X, Y, Znearest, Zfarthest)
The (X,Y) is the location of block coordinate on the screen. Znearest is the nearest
Z value in this block3. It can decide whether this block3 is completely occluded
by other block3 or not. Zfarthest is the farthest Z value in this block3. It can decide
- 16 -
2. Full or partial cover block3
The full cover block3 means that all fragments in this block3 have primitive data.
On the other word, full cover block3 is the block which is totally in the primitive.
Otherwise, this block3 is partial cover block3. In figure 3-2-1, the block A is a full
cover block3 and block B is a partial cover block3.The purpose of discriminating
full or partial cover block3 is for updating the blocked-Z buffer. The operation of
updating block-Z buffer will perform in later stage, blocked-Z test. Only the full
cover block3 have authority to check if needing to update the block-Z buffer. It is
because only full cover block3 can guarantee to completely occlude other block3.
3. Primitive ID
When we perform the rasterization, it needs the primitive information to
interpolate fragments. However, the block3 don’t have any primitive information,
it cannot perform the block-based rasterization to interpolate fragments. So it
needs to record the primitive ID which the block3 originally belong to. When this
block3 has to perform block-based rasterization, it can get the primitive
information to generate all fragments in this block3.
Figure 3-2-1 A sketch of primitive blocking. The yellow blocks are the blocks which
- 17 -
Figure 3-2-2 Flowchart of primitive blocking hardware
The primitive blocking contains two stages, block-based edge walk and blocked
row-span iterator, as shown in Figure3-2-2. The block-based edge walk calculates two
edge-blocks, Z strides, and full cover bound blocks for every blocked-row.
Edge-block is the block3 on the primitive edge. Full cover bound blocks can indicate
which blocks in one blocked-row are full cover block3. The block row-span iterator
generates all blocks between two edge-blocks in the same blocked-row. Since these
two stages have different execution latency, we need to add an edge-block buffer to
store edge-blocks, Z strides, and full cover bound blocks. Then, the two stages can
parallel execute. If without the edge-block buffer, block-based edge walk may be
- 18 -
3.2.1 Block-based edge walk
In this section, we will introduce how to calculate the edge-blocks, Z strides, and
full cover bound blocks.
3.2.1.1 Intersection generator
The purpose of the first stage of block-based edge walk, intersection generator, is
to find the two edge-blocks for every blocked-row. Since the edge-block in one
primitive edge may not be only one, we have to find the most outside edge-block in
blocked-row. In figure 3-2-1-1-1, edge-block A and edge-block B both are edge-block.
In this case, we must choose the edge-block A since that cannot miss some blocks to
rendering.
In order to find the most outside edge-block, we will find the correct
intersections to indicate which edge-block is the most outside edge-block. There are
two kind of intersections, ceiling or floor intersection. The intersection means the
intersection of primitive and ceiling or floor scan-line of one blocked-row. In figure
3-2-1-1-1, the four points on primitive edge are ceiling or floor intersections.
- 19 -
For finding the correct ceiling or floor intersection, first we use table lookup
to decide the direction of Y coordinate of intersection. The direction table is shown in
Table 3-2-1-1-1. In the beginning, we have to know the primitive is major left or
major right primitive. Major edge is the edge which has maximum y value vertex and
minimum y value vertex, like the edge ac in Figure3-2-1-1-1. We can see edge ac
is on the left of this primitive, so this primitive is a major left primitive. And the
information of major edge can be known in triangle setup stage, so we don’t have to
spend extra computation to get this information. When deciding what kind of
primitive, we use the slopes of major and minor edge to look up table to get the
direction of Y coordinate of intersection in blocked-row. The direction of Y coordinate
may be floor or ceiling in blocked-row. After looking up table, we can know the Y
coordinate value of intersection. Then using edge function and Y coordinate value of
intersection can get the X coordinate value of intersection. After these steps, we can
know the correct intersection is ceiling intersection or floor intersection.
For example, we know the slope of edge ac is positive in figure 3-2-1-1-1.
After looking up table, the Y coordinate of representative point has take the floor
direction of blocked-row. And using Y coordinate vale and edge function can get the
red point in block A. This red point is the representative point of block A. If we take
ceiling minus direction on major edge in indicated block-scan line, it would find the
green point in block B. It will miss block A.
We perform the same process on minor edge, then we can calculate two
representative point of edge-block in every blocked-row. Figure 3-2-1-1-2 shows the
configuration of how to take the Y coordinate of edge-block with floor or ceiling
minus direction. Actully it is very simple. If the direction is floor, we use zero to
replace last few bits. If direction is ceiling minus, we use one to replace last few bits.
- 20 -
Table 3-2-1-1-1 Direction table for determining edge-block
Figure 3-2-1-1-2 Generation of Y value representing a given blocked-row
3.2.1.2 Edge-block generator
After finding the representative points of edge-block, edge-block genereator can
translate repredentative points of edge-block to block coordinate of edge-block by
using equation (1). Equation (1) means that block coordinate of edge-block can
generate by ignoring last few bits of representative point because block width and
height are both 2 to the power of N.
R.P. of edge-block(X,Y) block coordinate of edge-block(
BW X , BH Y ) ---Equation (1) BW: block width, BH: block height
- 21 -
There is an example in figure 3-2-1-2-1. The red point is the representative point
of edge-block A. It locates on screen coordinate (11,16). Since the block width and
height both are four pixels, we can use equation (1) to get the block coordinate of
edge-block A, (3, 4). In the hardware design, it is easy to implement. It just ignores
the last few bits of screen coordinate of representative points. And how many last few
bits we need to ignore, it depends on the block width and block height.
Figure 3-2-1-2-1 The example of edge-block generator
3.2.1.3 Z strides and full cover bound blocks
In previous section, we calculate two edge-blocks in every blocked-row for
generating all block3s’ block coordinate between two edge-blocks in later stage,
blocked row-span iterator. Moreover, we also need to calculate the nearest and
farthest Z value of block3 and decide the full cover bit of block3. For this reason, we
have to calculate Z strides and full cover bound blocks in every blocked-row.
In every blocked-row, we have to calculate two Z strides. One is the Z stride of
bottom scan-line and another one is the Z stride of top scan-line, as shown in figure
3-2-1-3-1. First we find the edge-points (X_LT, X_RT, X_LB, and X_RB) on the top
- 22 -
bottom scan-line. Then we calculate the Z values of these four edge-points by using
three vertices’ Z values. Finally, using each two edge-points which are on the same
scan-line and their Z value calculate Z strides of top and bottom scan-line. For
example, the Z stride of top scan-line can be known by the following formula:
Z stride of top scan-line = (Z value of X_LT – Z value of X_RT) / (X_LT – X_RT)
Figure 3-2-1-3-1The sketch of calculating Z strides and full cover bound blocks
The full cover bound blocks can indicate which block3s in one blocked-row are
full cover. How do we find the full cover bound blocks? First we need to find the
block2s, which the edge-points of top and bottom scan-line in blocked-row, are
belonged to. In figure 3-2-1-3-1, we will find the four colored blocks. Then we
compare these blocks and find the two inside blocks. The two inside blocks are the
full cover bound blocks. The block A and block B in figure 3-2-1-3-1 are the full
cover bound blocks. And the blocks only between the full cover bound blocks will be
full cover block3.
3.2.2 Blocked row-span iterator
In blocked row-span iterator, it will calculate all block3s between two
- 23 -
find the block coordinate which the block3 is belonged to. Since all block3s are in the
same blocked-row, the Y block coordinate of all block3s are the same. And since the
block3s are the consecutive block3s, we can calculate X block coordinate by just plus
one to X coordinate of previous block3.
Second, we need to calculate nearest and farthest Z values of block3. Since the
block3 is a 3-D plane, the nearest and farthest Z value must be on the vertices. We
directly calculate the Z values of block’s four vertices and compare these four Z
values to get the nearest and farthest Z values. The full and partial cover block3 both
use this method to calculate nearest and farthest Z values. Although partial cover
block3’s four vertices aren’t all in the primitive, we also use four vertices’ Z values to
decide the nearest and farthest Z value. It can simplify the computation. Since the
intersection points of primitive and block3 may have many different conditions, it is
time wasting to calculate all Z values of intersection points of primitive and block3.
And using four vertices’ Z values to get the nearest and farthest Z value don’t have a
large error with the precise nearest and farthest Z values.
Finally, we need to decide the block3 is full or partial cover block3. Since full
cover bound blocks already know in previous stage, we only determine the block3 if
between the full cover bound blocks. If the block3 is between full cover bound blocks,
this block3 is a full cover block3. Otherwise, this block3 is a partial cover block3.
When one block3 are generated, this block3 will be transferred to blocked-Z test
stage for testing the Z value. It can decide this block3 are occluded or not.
3.3 Blocked-Z test
Blocked-Z test can filter out block3s which are surely occluded by other block3
- 24 -
of later stages, like rasterization, per-fragment early-Z test. Because blocked-Z test is
performed based on a block, as opposed to a fragment, it can filter out many
fragments within a block in one compare operation. To achieve this goal, it needs to
add a two-dimensional blocked-Z buffer to record the current nearest Z value of each
block coordinate, as shown in figure 3-3-1. The width of block-Z buffer is that the
width of screen coordinate divides block width. And height of block-Z buffer is that
the height of screen coordinate divides block height. The size of each entry on
block-Z buffer is 4 bytes, the common size of Z value.
Figure 3-3-1 The configuration of block-Z buffer
Figure 3-3-2 shows the flow chart of blocked-Z test. After primitive blocking
generate block3s, using the nearest Z value of block3 compares with corresponding
block-Z value on blocked-Z buffer. If the nearest Z value of block3 is larger than
corresponding block-Z value, it can filter out this block3. Otherwise, this block3 will
pass to the block-based rasterization. And when any block3 passes the blocked-Z test,
it has to check if needing to update the block-Z buffer. When the block3 is full cover
and the farthest Z value of block3 is smaller than corresponding block-Z value on
block-Z buffer, it must update the corresponding block-Z value with farthest Z value
- 25 -
update block-Z buffer. It is because only the full cover block3s can guarantee to
occlude other block3s when other block3s are behind the full cover block3. If updating
the block-Z value with partial cover block3, another block3s may not be totally
occluded by this partial cover block. It may filter out some block3s which should
display on the screen. So, only full cover block has authority to check if needing to
update block-Z value.
Figure 3-3-2 The flow chart of blocked-Z test
3.4 Block-based rasterization
Block-based rasterization generates fragments to those passing blocked-Z test
block3s. It can parallel processing with updating the block-Z buffer when the blocks
pass blocked-Z test. Since the data of updating the block-Z buffer and block-based
rasteriztion are different. To update the block-Z buffer needs the farthest Z value and
full cover bit. And block-based rasterization needs the block coordinate of block3 and
- 26 -
The operation of block-based rasterization is similar to general rasterization.
The only difference is block-based rasterization needs to find the block3 range and
generates all fragments in the block3. First, it needs to calculate two edge-fragments
on primitive’s edge in every scan-line of blocked-row. If block size is 8x8, like figure
3-4-1, we need to calculate these sixteen edge-fragments, the red squares, on
primitive’s edge. Then, using two edge-fragments on same scan-line calculates all
attribute strides of every scan line, like RGBA, Z, texture coordinate. Finally, using
attribute strides of every scan-line interpolates all fragments in block3 range.
Figure 3-4-1 The sketch of block-based rasterization
Here is a problem that consecutive blocked-Z tested block3s in same
blocked-row like figure 3-4-1, it has to calculate the same edge-fragments on
primitive edge and calculate the same attribute strides. So, we use an edge-fragment
buffer to record edge-fragments which are on major edge and attribute strides in same
blocked-row. Moreover, edge-fragment buffer must record primitive ID and row
number to indicate which blocked-row’s edge-fragment data is now on the
edge-fragment buffer. Figure 3-4-2 shows the configuration of edge-fragment buffer.
When passing blocked-Z test block3 comes, it will check this block3 whether is on the
same blocked-row with the edge-fragment data on the edge-fragment buffer. If the
- 27 -
then we use edge-fragment data on edge-fragment buffer to generate fragments rather
than calculate same edge-fragments and attribute strides again. Figure 3-4-3 shows the
flow chart of block-based rasterization. The blocked-row number of Z-tested block3 is
the y coordinate value of Block3. The block-ranged edge walk is to calculate the
edge-fragments and Z strides in block height. Block range generator calculate which
range in one scan-line needs to interpolate fragments. And the fragment generator is to
interpolate all fragments in block range by using edge-fragments an attribute strides.
Figure 3-4-2 The edge-fragment buffer for a blocked-row
- 28 -
3.5 Data flow of our proposed method
In this section, we will briefly introduce the data flow of our proposed method,
blocked-Z test. Figure 3-5-1 shows the data flow of our proposed method. The
triangle setup will assemble the vertices into primitive and also calculate the edge
slopes of three primitive edges. Then primitive blocking will generate all block3 data
and deliver block3 data to blocked-Z test stage. After blocked-Z test, the Znearest,
Zfarthest, and full cover flag wouldn’t use anymore. Only the block coordinate and
primitive ID of block3 will deliver to block-based rasterization. After block-based
rasterization, it will become fragment data and deliver these fragment data to
per-fragment early-Z test.
Figure 3-5-1 the data flow of our proposed method, blocked-Z test
3.6 The rendering pipeline with blocked-Z test
- 29 -
deliver from triangle setup to primitive blocking, the primitive blocking divides the
primitive into block3s and triangle setup can generate another primitive. The block3s
will deliver to blocked-Z test unit as soon as the primitive blocking generates one
block3. Primitive blocking doesn’t wait all block3s in one primitive be generated and
then deliver all block3s to blocked-Z test unit. If do so, the blocked-Z test unit will
often be idle by waiting the primitive blocking. In the same principle, the block-based
rasterization can get the block3 data immediately when the block3 passes blocked-Z
test. Since the block-based rasterization has longer processing time than blocked-Z
test, it would always stay in busy time, wouldn’t in idle time. So, the extra added
pipeline components of our proposed method can operate smoothly.
Moreover, the rendering pipeline with blocked-Z test becomes deeper than general
graphic pipeline since we add two new pipeline units, primitive blocking and
blocked-Z test. The computation time may become longer and may not render thirty
frames in one second. However, since it can parallel process different frames, only the
first frame will take longer time to process. Figure 3-6-1 shows the pipeline operation
of multiple frames. Although the pipeline stage becomes deeper, the total throughput
can seem identical than traditional graphic pipeline, even increase throughput since
our method can relieves some bottlenecks.
V.S. T.S. P.B. Block-Z T. B.B. R. E.Z T. P.S V.S. T.S. P.B. Block-Z T. B.B. R. E.Z T. P.S V.S. T.S. P.B. Block-Z T. B.B. R. E.Z T. P.S V.S. T.S. P.B. Block-Z T. B.B. R. E.Z T. P.S frame N frame N+1 frame N+2 frame N+3
V.S. : vertex shader T.S. : triangle setup P.B. : primitive blocking Block-Z T. : block-Z testing B.B. R. : block-based rasterization E.Z. T. : early-Z test P.S. : pixel shader
...
- 30 -
Chapter 4 Experiment and results
4.1 Experiment goal and environment
We are going to know how many percentages of occluded fragments can be
filtered out in our blocked-Z test. And we also want to know how many extra
workloads bring with the blocked-Z test. Finally, we will consider with the reduced
workloads and extra workloads which produce from our blocked-Z test to evaluate
how many total workloads blocked-Z test can reduce. Moreover, we will compare our
blocked-Z test with the tile-based early-Z test [6] which the related work mentioned.
We trace the Atila simulator and dump the primitive data from Atila to be the
input data for our experiment. The Atila simulator is proposed in [7]. The simulator
architecture is based on the design of ATI GPU’s architecture and support OpenGL
based benchmarks, like Doom3 [8], Quake4 [9], or the 3-D based computer games.
The primitive data which we dump from Atila simulator are the benchmarks of
Doom3 and Quake4 with 320*240, 640*480, 1280*1024, and 1600*1200 screen
resolutions.
After we have the input data, we also implement the simulator of our blocked-Z
test method. Then we can get the filtering ratio of blocked-Z test from the simulator
which we implement. And we also can evaluate the workload reduction by the
information from our blocked-Z test simulator. The filtering ratio means the
percentage of fragments can be filtered out by any kind of early-Z test. The equation
of filtering ratio is: filtering ratio = filtered out occluded fragments / original
- 31 -
4.2 Experiment results
In section 4.2.1, we will show the filtering ratio of blocked-Z test with various
block sizes, which are 4x4, 8x8, 16x16, 32x32, and 6x64 pixels. In section 4.2.2, we
will show the extra overhead of blocked-Z test, included extra hardware requirements
and extra workloads. And we will evaluate the workload reduction of rasterization and
per-fragment early-Z test with our blocked-Z test.
4.2.1 Filtering ratio of blocked-Z test
The figure 4-2-1-1 and figure 4-2-1-2 show the filtering ratio of blocked-Z test
with various block sizes. The filtering ratio of blocked-Z test means how many
percentages of fragments can be filtered out in blocked-Z test. It can reflect the effect
of blocked-Z test. The last bar chart of each set is the filtering ratio of per-fragment
early-Z test. It can be a comparison with the blocked-Z test of various block sizes.
Obviously, we can see that the filtering ratio is higher with the block size is smaller.
And we can see that the filtering ratio with various block sizes in low screen
resolution has larger variation. With the block size increase in low screen resolution,
the filtering ratio decreases more than in high screen resolution. It is because the
difference of block size in the low resolution has larger variation of covered range in
the screen than in the high screen resolution. So, in the high screen resolution like
1600*1200, the filtering ratio with various block sizes has less variation. In figure
4-2-1-1, the average filtering ratio with various block sizes is about 80%. And In
- 32 -
Figure 4-2-1-1 The filtering ratio of Doom3 with various block sizes
- 33 -
4.2.2 Extra overhead of blocked-Z test
In this section, we will show the extra overhead which produce from blocked-Z test. In section 4.2.2.1, we show the extra workload of blocked-Z test. The extra
workload is reflected by the block count. In section 4.2.2.2, we show the extra storage
requirement and hardware that blocked-Z test need to use. With different block sizes,
the storage requirement has a large variation.
4.2.2.1 Extra workload of blocked-Z test
Although blocked-Z test can reduce the workloads of the rasterization and
per-fragment early-Z test, it has the extra workloads of the primitive blocking and
blocked-Z test. In this section, we will discuss the extra workload of primitive
blocking and blocked-Z test with various block sizes. Figure 4-2-2-1-1 and figure
4-2-2-1-2 shows the extra workload of primitive blocking and blocked-Z test with
various block sizes in Doom3 and Quake4. We use the block count to evaluate the
extra workload. The reason is primitive blocking needs to generate all blocks and
blocked-Z test needs to perform depth test for every block. Obviously we can see,
when the block size is smaller, the extra workload will higher. In these two figures,
we can see that the workload will increase about three times when the block size
- 34 -
Figure 4-2-2-1-1 Extra workload of blocked-Z test with various block sizes
Figure 4-2-2-1-2 Extra workload of blocked-Z test with various block sizes
4.2.2.2 Extra storage requirement and hardware
In our method, we have three extra storage buffers, primitive buffer,
edge-fragment buffer, and block-Z buffer. With the block size and screen resolution
vary, the storage will have the different requirement. Table 4-2-2-2-1 shows the
storage requirement in different block size and screen resolution. The major extra
storage requirement is block-Z buffer since it needs to store all current nearest Z value
for every block coordinate. The block-Z buffer size can calculate by (screen width *
- 35 -
is small, the block-Z buffer size may greater than 100 Kbytes. We can see that when
block size is 4x4 and screen resolution is 1600x1200, the block-Z buffer size is even
above 400 Kbytes. The edge-fragment buffer size depends on the block size only. It
needs to store the edge-fragment data two times of block height. The edge-fragment
buffer size can calculate by ( block height * 2)*20 bytes. And the primitive buffer size
is a fixed size. It depends on how many primitives need to store in primitive buffer. In
this table, we set the ten primitives needed to store in primitive buffer and each entry
is 60 bytes. The maxumun of total extra storage is about 470 Kbytes. And the
minimum of total extra storage is only aobut 2 Kbytes.
Table 4-2-2-2-1 Extra storage requirement with various block sizes and resolutions
block size: 4x4 block size: 8x8 block size: 16x16 block size: 32x32 block size: 64x64 screen resolution320*2 40 640*4 80 1280* 1024 1600* 1200 320*2 40 640*4 80 1280* 1024 1600* 1200 320*2 40 640*4 80 1280* 1024 1600* 1200 320*2 40 640*4 80 1280*1 024 1600* 1200 320*2 40 640*4 80 1280* 1024 1600* 1200 bock-Z buffer size(KB) 18.75 75.00 320.00468.75 4.69 18.75 80.00 117.19 1.17 4.69 20.00 29.30 0.29 1.17 5.00 7.32 0.07 0.29 1.25 1.83 Edge-fragment buffer size(KB) 0.16 0.16 0.16 0.16 0.31 0.31 0.31 0.31 0.63 0.63 0.63 0.63 1.25 1.25 1.25 1.25 2.50 2.50 2.50 2.50 primitive buffer size(KB) 0.60 0.60 0.60 0.60 0.60 0.60 0.60 0.60 0.60 0.60 0.60 0.60 0.60 0.60 0.60 0.60 0.60 0.60 0.60 0.60 total extra buffer
size(KB) 19.51 75.76 320.76469.51 5.60 19.66 80.91 118.10 2.40 5.91 21.23 30.52 2.14 3.02 6.85 9.17 3.17 3.39 4.35 4.93
In our method, the primitive blocking and blocked-Z test unit is the extra hardware. Table 4-2-2-2-2 shows the extra hardware of primitive blocking and blocked-Z test unit.
- 36 -
4.2.3 Total workload reduction with blocked-Z test
Although our method can reduce the workloads of rasterization and
per-fragment early-Z test, the primitive blocking and blocked-Z test would produce
the extra workloads. In this section, we evaluate the total workload reduction with
considering the reduced and extra workloads.
The primitive blocking and rasterization are similar with their operation.
Primitive blocking can consider a large granularity rasterization. It just spends much
time to calculate the nearest and farthest Z value of block. And the blocked-Z test and
per-fragment early-Z test both perform the depth test. The execution time of these two
execution units can consider the same. Table 4-2-3-1 shows the time complexity of
these four execution units, primitive blocking, general rasterization, blocked-Z test,
and per-fragment early-Z test. The latency of each computation unit, like adder or
multiplier, shows in the most left column. The cycle time of each computation unit is
our hypothesis. And how many computation units that each execution unit is need to
perform also show in the table. Then we can calculate each execution unit’s latency by
computation unit’s latency multiply by the number of computation unit and it shows
on last row in table 4-2-3-1.
- 37 -
When we know the latency of these execution units, we can derive the equation (2) from these execution units’ latency. The equation (2) can calculate the total change workload of our blocked-Z test method. It means that how many workload of rasterization and per-fragment early-Z test can be reduced.
Using the equation (2), we can get the total reduced workload of blocked-Z test. Figure 4-2-3-1 shows the total reduced workload with various screen resolutions.
(a)
- 38 -
(c)
(d)
Figure 4-2-3-1 The total reduced workload of blocked-Z test with various screen
resolutions. (a) 320x240 pixels (b) 640x480 pixels (c) 1280x1024 pixels (d)
1600x1200 pixels
We can see that 4x4 block size has the best performance only in 320x240 resolution. In the higher resolutions, 8x8 block size has the best performance. Although 4x4 block size has the highest filtering ratio than other block sizes, it has the more serious extra overhead than other block sizes, especially in the high screen resolution. So, in high resolution, 4x4 block size cannot get the highest workload reduction than other block size.
- 39 -
4.3 Performance compare with tile-based early-Z test [6]
Figure 4-3-1 and figure 4-3-2 show the filtering ratio of our proposed methodand tile-based early-Z test [6] in Doom3 and Quake4. Each bar chart is the average
value of filtering ratio in four screen resolution. In Doom3, our method can filter out
more about 3% fragments averagely. It’s about one million fragments. And in Quake4,
our method can filter out more about 13% fragments averagely. It’s about
twenty-seven million fragments. Since Quake4 is higher complex scenes than Doom3,
blocked-Z test has the better performance in Quake4.
Figure 4-3-1 Filtering ratio of blocked-Z test versus tile-based early-Z test for Doom3
- 40 -
Since blocked-Z test has more precise depth value than tile-Z test, the filtering
ratio of blocked-Z test is obviously better than tile-Z test. However, the computation
of blocked-Z test is more complex than tile-Z test. We have to consider the extra
overhead into evaluation. So we compare the total reduced workload with these two
methods to see which method can get the better performance.
The total changed workload equation of blocked-Z test is already shown in
section 4-2-3. The Equation (3) shows the total changed workload of tile-Z test. We
can see that the latency of primitive tiling is shorter than primitive blocking in
blocked-Z test method. It is because the computation of depth value in tile-Z test is
simpler than blocked-Z test. Using equation (3), we can get the total reduced
workload of tile-Z test. Figure 4-3-3 shows the total workload reduction of these two
methods. Blocked-Z test averagely can reduce more about 5% total workload than
tile-Z test.
- 41 -
Chapter 5 Conclusion
As more complex models become commonplace in today’s 3D computer
graphics. How to reduce the unnecessary operations is the critical issue. In this paper,
we proposed a low computational blocked-Z test to reduce workload of rasterization
and per-fragment early-Z test. Blocked-Z test process the depth test by larger range,
block, before rasterization and can achieve about 70% workload reduction. Moreover,
when per-fragment early-Z test has less data to processing, it also can alleviate Z
buffer access loading. Blocked-Z test can pay a little extra overhead to achieve a large
amount of workload reduction. It can be a useful approach to reduce the workload in
- 42 -
References
[1] N. Greene, M. Kass, and G. Miller, “Hierarchical Z-Buffer visibility,” in Proc. Of ACM SIGGRAPH 1993, 1993, PP.231 – 238.
[2] S. Morein, “ATI radeon HyperZ technology,” in Workshop on Graphics Hardware, Hot3D Proceedings, ACM SIGGRAPH/Eurographics, Aug. 2000. [3] T. Aila, V. Miettinen, and P. Nordlund, “Delay streams for graphics hardware,”
ACM Trans. Graphics, Vol. 22, No. 3, pp.792-800, July 2003.
[4] J.-S. Yoon, C.-H. Yu, D. Kim, and L.-S. Kim, “Triangle-Level Depth Filter method for Bandwidth Reduction in 3D Graphics Hardware,” in Proc. IEEE International Symposium on Circuits and Systems(ISCAS’07), May 2007, pp. 765-768.
[5] Ke Yang, Ke Gao, J. Shi, X. Jiang, and H. Xiong, “CoarseZ Buffer Bandwidth
Model in 3D Rendering Pipeline,” in Proc. IEEE International
Multi-Symposiums on Computer and Computational Sciences(IMSCC’06), Volume 01, pp. 737-742.
[6] K.J. Min, J.M. Kim, H.S. Kim, J.W. Kim, and S.J. Min, “METHOD AND SYSTEM FOR EARLY Z TEST IN TILE-BASED THREE-DIMENSIONAL RENDERING,” U.S Patent 2008/0068375 A1, Mar. 20, 2008
[7] Victor Moya del Barrio, Carlos González, Jordi Roca, Agustín Fernández, “ATTILA: a cycle-level execution-driven simulator for modern GPU architectures”, 2006 IEEE International Symposium on Performance Analysis of Systems and Software.
[8] Benchmark, Doom3, http://www.doom3.com/ [9] Benchmark, Quake4, http://www.quake4game.com/
[10] Víctor Moya, Carlos González, Jordi Roca, Agustín Fernández and Roger Espasa. ATTILA: A Cycle-Level Execution-Driven Simulator for Modern GPU Architectures. IEEE International Symposium on Performance Analysis of Systems and Software (ISPASS-2006), March 2006
[11] Alan Watt. 3D Computer Graphics. 3rd edition. Pearson Addison-Wesley publishing. 2000