行政院國家科學委員會補助專題研究計畫 ■成果報告
□期中進度報告
選制變遷之效應:
分析方法的探討及對我國立委選制變遷影響之研究
計畫類別:
■
個別型計畫
□
整合型計畫
計畫編號:NSC 96-2414-H-004 -042 -SS3
執行期間:96年8月1日至99年7月31日
執行機構及系所: 國立政治大學政治系
計畫主持人: 黃紀
共同主持人:
計畫參與人員: 專任助理 – 施奕任(第一年)、歐陽睿(第二、三年)
擴增專任助理 – 林怡君(第三年)
兼任助理 – 林怡君(第一、二年)、陳妤諳(第二年)、
王帥涵
(第二年)、
周詩茜
(第三年)、
莊怡忻
(第三年)、
孔翎蓁
(第三年)
成果報告類型(依經費核定清單規定繳交):
□
精簡報告
■
完整報告
本計畫除繳交成果報告外,另須繳交以下出國心得報告:
□
赴國外出差或研習心得報告
□
赴大陸地區出差或研習心得報告
■
出席國際學術會議心得報告
□
國際合作研究計畫國外研究報告
處理方式:
除列管計畫及下列情形者外,得立即公開查詢
□涉及專利或其他智慧財產權,□一年□二年後可公開查詢
中 華 民 國 99 年 10 月 22 日
I 目錄 中文摘要及關鍵詞...II 英文摘要及關鍵詞...III 報告內容...1 參考文獻...19 附圖及附表...23 計畫成果自評...34 附錄...35
II 選制變遷之效應: 分析方法的探討及對我國立委選制變遷影響之研究 摘要 2005年6月國民大會完成複決修憲,其內容最引人矚目的莫過於立委席次減 半、任期改為四年,以及立委選舉由目前之「單記不可讓渡制」(SNTV)改為 「單一選區兩票制」(MMM),這不僅對我國之立委選舉制度是一大變革,而且 對於政黨消長、競選策略、選民之投票行為等都勢必影響深遠。2008年1月的第 七屆立委選舉將首次適用新選制,因此堪稱是台灣民主發展過程中舉足輕重的一 次關鍵選舉,值得深入研究。 本計畫定位為制度之「下游」研究,亦即聚焦於評估選制之影響與效應。其 成果展現於方法與實質兩方面: 一、從方法論的角度,針對評估型因果推論採跨時間之研究研究,並以定群資料 (longitudinal panel data)比較制度變化前後之持續與變遷。方法上,考量 新選制之單一選區兩票特性,故建構能兼顧「選票-選民-選區」之多層分析 勝算對數模型(multilevel logit model)。
二、研究結果發現,新MMM選制因較偏重單一選區(SMD),如Duverger法則所 論,選前即促使各黨合縱聯盟,比較2004與2008年立委選舉之定群資料,亦 發覺選票流動多發生在小黨支持者之策略投票。但在政黨比例代表(PR) 選票上,小黨支持者卻沒有如Duverger法則預期之忠誠投票。與日本之案例 比較分析後,本計畫認為:看似細微之制度差異(如是否允許雙重提名、PR 之門檻高低等),仍可能造成相當之影響。 關鍵詞:選舉制度,選制效應,因果推論,立委選舉、分裂投票、策略投票
III
Consequences of Electoral System Change: Methodology and Its Application to the Study of Taiwan's Shift to the Mixed-Member Majoritarian System
Abstract
In May of 2005, an election was held to select the National Assembly delegates, who will vote on constitutional amendments proposed by the Legislative Yuan in August 2004. In the following month, the National Assembly overwhelmingly passed the constitutional amendments which, among other things, reduce the seats of the Legislative Yuan from 225 to 113, and change its electoral system from the single nontransferable vote (SNTV) into the mixed-member majoritarian (MMM) system. This change has significant effects not only on the current multi-party system, their interrelationship, and campaign strategies, but also on the electorate’s voting behavior and choices. This project assesses the political consequences of Taiwan’s electoral system change of the Legislative Yuan election in 2008.
By focusing on evaluating the effect of electoral system change, the research project emphasizes methodology and data analysis.
1. We adopt a longitudinal research design in order to compare the respondents in both 2004 and 2008 post-election surveys. We also argue that multilevel model is most suitable for analyzing the ballot-voter-district structure of the new MMM electoral system.
2. The main finding of this project is that Duverger’s law correctly predicts the strategic voting for small party supporters in the SMD ballot. Interestingly, however, small party supporters in 2008 Legislative election deviate form Duverger’s law by also strategically vote for major parties. By comparing with the case of Japan, we conclude that even seemingly minor differences in electoral system, such as no dual candidacy allowed and the relatively high 5% threshold in Taiwan, can make a difference.
Keywords: electoral systems, consequences of electoral system change, causal
1
Consequences of Electroal System Change: Methodology and Its Application to Taiwan's Shift from SNTV to the Mixed-Member Majoritarian System
Political scientists generally agreed that electoral systems matter. As electoral systems convert votes into seats in the legislature, and thus to a large extent determine who wins and who loses in the political arena, their changes and consequences always attract wide attention.
In January 1994, Japan abolished the SNTV system and introduced the mixed-member majoritarian (MMM) system. And in June 2005, Taiwan changed the rules of legislative elections by cutting the number of legislative seats from 225 to 113, extending legislators’ terms of office from three years to four, and adopting the MMM system to replace the SNTV system. The election of the 7th Legislative Yuan held on January 12 of 2008 marked the beginning of a new era of Taiwan’s legislative politics since it was the first ever election in Taiwan under the mixed-member majoritarian (MMM) electoral system1
This research project explores the continuity and change of voting behavior in Taiwan by comparing two Legislative Yuan elections immediately before and after the electoral system shift in 2005. We call attention to strategic voting under the MMM system, and we employ panel data to examine individual-level vote choices under the previous single nontransferable vote (SNTV) system and the new MMM electoral systems. Besides assessing the influence of electoral reform on voter behavior in Taiwan, this paper also briefly discusses the major differences and consequences in electoral rules between Japan and Taiwan.
. It is intriguing to examine what consequences on voters’ vote choices this new electoral system brings about.
This report is organized as follows. The next section describes the differences between the SNTV and the MMM electoral systems as well as some possible impacts of the new system on Taiwan’s politics. The third section reviews literature on voting behavior in general and strategic voting and the potential interactions between two tiers of MMM. The fourth section discusses our research data and hypotheses. The fifth section explores data and explains our model and the sixth presents empirical findings. The seventh section discusses the differences in the MMM System between Japan and Taiwan, and their political consequences.
1 Here we adopt the classification of two subtypes of mixed-member systems by Shugart and
Wattenberg (2001, 13-14). They call the mixed-member system “majoritarian” when there is no linkage between nominal and list tiers in the allocation of seats to parties. On the other hand, mixed-member proportional (MMP) systems prioritize the list tier, i.e., the second ballot.
2
Legislative Electoral Systems in Taiwan
Since the softening of the Kuomintang (KMT, or “Nationalist Party”) authoritarian regime in the late 1980s, Taiwan has experienced full-speed democratization in the 1990s with the first transfer of power in March 2000. The Democratic Progressive Party (DPP) candidate Chen Shui-bian won the 2000 presidential election, ending the KMT’s half-century rule. With the re-election of President Chen in March 2004, the DPP maintained its control over the executive branch for eight years until March 2008 when the KMT presidential candidate Ma Yin-jeou won a landslide victory against DPP’s Frank Hsieh. However, the DPP and its allied party, the Taiwan Solidarity Union (TSU), which together are often referred to as the pan-green camp, have never won a majority in the Legislature during Chen’s administration. Since the legislative election of 2001, the KMT has continued to dominate the Legislative Yuan by a narrow margin, with the help of the People First Party (PFP) and New Party (NP), which together are often referred to as the pan-blue. In December 2004’s legislative election, for example, then opposition pan-blue alliance secured 114 out of the 225 seats of the 6th Legislative Yuan, while the pan-green coalition captured 101 seats. Although the then ruling DPP remained the biggest party in the Legislature, the pan-blue camp retained its majority of the legislative seats. The frustration due to the deadlock and stalemates caused by the divided government stimulated DPP’s lead in electoral system reform. The KMT, though somewhat reluctant in the beginning, soon made use of the opportunity to gain its own end. The two major parties, KMT and DPP, thus became strange bed fellows in bringing to birth the new MMM electoral system in Taiwan.
On August 23, 2004, the Legislative Yuan in Taiwan passed constitutional amendment proposals to cut the number of legislative seats from 225 to 113, to extend legislators’ terms of office from three years to four, and to adopt a new mixed-member majoritarian electoral system to replace the previous single nontransferable vote system for legislative elections. On May 14, 2005, an election was held to select the National Assembly delegates who would vote on constitutional amendments. Three weeks later on June 7, the amendment was ratified by a resolution of 83.6 percent of the delegates present at the meeting.
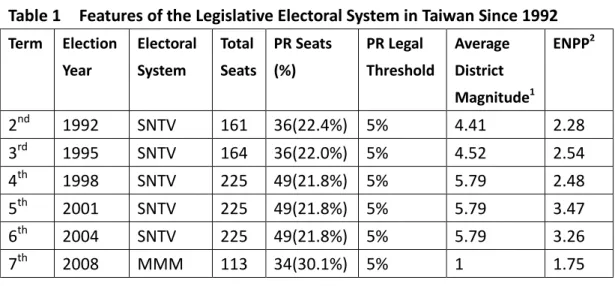
Before evaluating potential effects of shifting from the SNTV to MMM system, we need to examine changes in legislative electoral rules in Taiwan. Rae (1967) identified three key elements of electoral systems: ballot structure, district magnitude, and electoral formula. Lijphart (1994) added assembly size to Rae’s list. For the purpose of comparison, Table 1 traces the changes since 1992 when all the seats in the
3
Legislative Yuan were first subject to re-election.
[Table 1 about here]
I. Assembly Size. According to the 2005 constitutional amendment, the total
number of seats was cut into half from 225 to 113. Among them, 73 seats are elected based on the single-member districts (SMD), 34 seats based on the proportional representational (PR) in a nationwide district, and 6 seats for the aboriginals based on the SNTV constituencies.
II. Ballot Structure. Ballot remained nominal, although instead of casting one vote
(V=1) in the former single nontransferable vote system, each voter now can cast two votes (V=2): one for the SMD candidate, and the other for the political party.
III. District Magnitude. In the former SNTV system, multi-member district
magnitude (M) ranged from 1 to 13, with an average of 5.79, between 1998 and 2004.2
IV. Electoral Formula. Under the new parallel mixed-member system, the SMD
tier is based on the plurality rule. The PR seats remained allocated based on the largest remainder Hare formula with a 5% legal threshold.
Under the new mixed-member system, the SMD tier is limited to M=1. This of course also means that the whole nation is redistricted into 73 districts.
In sum, starting from 2008 voters in Taiwan receive two ballots on the election day of the Legislative Yuan. They can still vote for one candidate on the now single-member districts they resides in, but have the additional vote to express their preference for political parties.
Months before the 2008 Legislative election, KMT negotiated successfully with the PFP to nominate 6 former PFP legislators in 6 districts and also allowed PFP to share three seats on KMT’s party list. KMT also coordinated with the Non-partisan Solidarity Union (NPSU) to stand off 3 seats in SMD, and KMT promised not nominate candidate in the first district in Pingtung to allow independent candidate Tsai Hau, also affiliated with NPSU, to compete against the DPP candidate.
2
In the 1992 and 1995 Legislative Yuan elections, Taipei County as a whole was the largest SNTV district with 16 and 17 seats respectively. It was divided into three districts since 1998, so Taoyuan County with 12 seats in 1998 and then increased to 13seats in 2001 as well as 2004 elections became the SNTV district with the highest magnitude. (see Huang 2008b, 133)
4
Apparently, the KMT, after losing the 2000 and 2004 presidential elections, was anxious to form a grand coalition aiming at the presidential election in the March of 2008 and thus was more willing to make compromises with its allies. In contrast to the coordination in the pan-blue camp, the DPP and the TSU squabbled with each other and eventually failed to reach any substantive agreement. The DPP seemed to believe that the TSU would simply back down and follow its lead. Yet the TSU eventually fielded 13 candidates in districts to fight its survival battle. It is interesting to note that the new electoral system facilitates the tacit merge of the KMT and PFP in the pan-blue camp and yet fuels tension between the DPP and TSU in the pan-green camp. These somewhat opposite effects on both camps are further magnified by the new system since the SMD tier tends to favor the party capturing majority of popular votes.
As mentioned earlier, the reform of legislative electoral system might be one hope for the DPP to win the absolute majority in the Legislative Yuan. However, the 2008 legislative election results fell far short from the expectation of the ruling DPP. As Table 2 shows, DPP received 38.0% of total district votes but only 13 (16.5%) out of 79 SMD/SNTV seats. For the second ballot, DPP received 36.9% of total votes and 14 (41.2%) of 34 party seats. On the other hand, the KMT garnered 53.5% of total district votes and 61 (77.2%) out of the 79 SMD/SNTV seats, as well as 51.2% of total at-large votes and 20 (58.8%) out of the 34 party seats. If we count in the 3 seats won by the NPSU, the KMT’s close ally, the pan-blue indeed secured an overwhelming victory over the DPP in the 2008 legislative election. It is interesting to examine how voters in Taiwan made their choices under the single-ballot SNTV system in 2004 and the new two-ballot system in 2008.
[Table 2 about here]
Electoral Systems and Voting Choices
Researchers of strategic voting often return to Duverger’s classic arguments on electoral systems and their political consequences. According to Duverger (1959, 217): “the simple-majority single ballot system favors the two-party system.” He provides two factors to explain why third party can not survive in this electoral system. Duverger (1959, 224) argues that “the mechanical factor consist in the “under-representation” of the third, i.e. the weakest party, its percentage of seats being inferior to its percentage of the poll.” The second factor is more ambiguous one. Because supporters of third party do not want to waste their votes, Duverger (1959,
5
226) argues that “their natural tendency to transfer their vote to the less evil of its two adversaries in order to prevent the success of the greater evil.”
Following the lead of Duverger (1959), many studies focus on the macro level (or systemic level) consequences, especially on the (dis)proportionality profiles of different electoral systems and on party systems (for example, Rae 1967; Taagepera and Shugart 1989; Lijphart 1994; etc.). More recent works, however, indicate a growing interest in the micro level effects of electoral systems, including both how electoral rules shape voters and elites’ incentives as well as how political parties are affected by them (for example, Cox 1997). This shift of attention should not be too surprising since most macro effects result from the micro level incentive structure shaped by the electoral rules (Grofman 2006).
The effect of the mixed-member electoral system on party system serves a good example of this trend. As we mentioned above, Duverger (1959, 205) asserted that single-member district plurality would tend to generate two-party competition, and he also proposed that PR systems would encourage multiparty competition. Mixed-member electoral system is characterized by the hybrid of both SMD and PR tiers. That is, mixed-member systems typically involve electing part of a legislature through single-member districts, and another part through PR from party lists. It is certainly interesting to speculate the effects of such mixed systems on the party system.
Since the primary feature of the MMM system adopted by Taiwan is the lack of linkage between SMD and PR tiers, “the typical majoritarian boost received by a large party in the nominal tier is not likely to be wiped away by proportional allocation from the list tier.” (Shugart and Wattenberg 2001, 13) Furthermore, the PR portion in Taiwan accounts for only 30.1% of the total 113 seats. It seems logical to argue that the gravity force of Duverger’s law will exert pressure on small parties and thus push down the number of parties (see Reed 2005 on Japan’s case; Wang 2006, 108 on Taiwan’s case).
However, a small number of studies criticized the failure of taking account the potential for interaction effect or contamination effect across the two ballots under mixed rule (Cox and Schoppa 2002; Herron and Nishikawa 2001; Moser and Scheiner 2004). “Contamination is…when the behavior of voter, a party, a candidate, or a legislator in one tier of the election is demonstrably affected by the institutional riles employed in the other tier” (Ferrara, Herron, and Nishikawa 2005, 8). That is, the contamination effects also generate what Cox (1990) called a “centripetal” force that pull up the number of electoral parties. In order to lift the PR votes, party elites may
6
have strong incentive to field candidates in single-member districts to give the party label a human face, regardless of the chance of winning the district seat. In other words, electoral incentives in one tier “contaminate” those in the other tier, complicating the insights from Duvergerian laws.
Both views seem to be sound on purely theoretical ground. The real test of these two competing hypotheses rests on how voters use the two ballots under the MMM system, that is, the pattern of straight- and split-ticket voting (Huang 2001; Huang, Wang, and Kuo 2005). The “mainstream” view implies that strategic voting on the SMD side will produce split-ticketing. That is, small party supporters are not likely to waste their votes on their most preferred party’s candidates and will instead vote strategically for a large party candidate they dislike least. And yet they will choose to vote sincerely for their preferred small party on the PR lists. The “interaction effects” view, on the other hand, implies that small party supporters are more likely to vote straightly and sincerely in those districts where their preferred small party also fields a candidate.
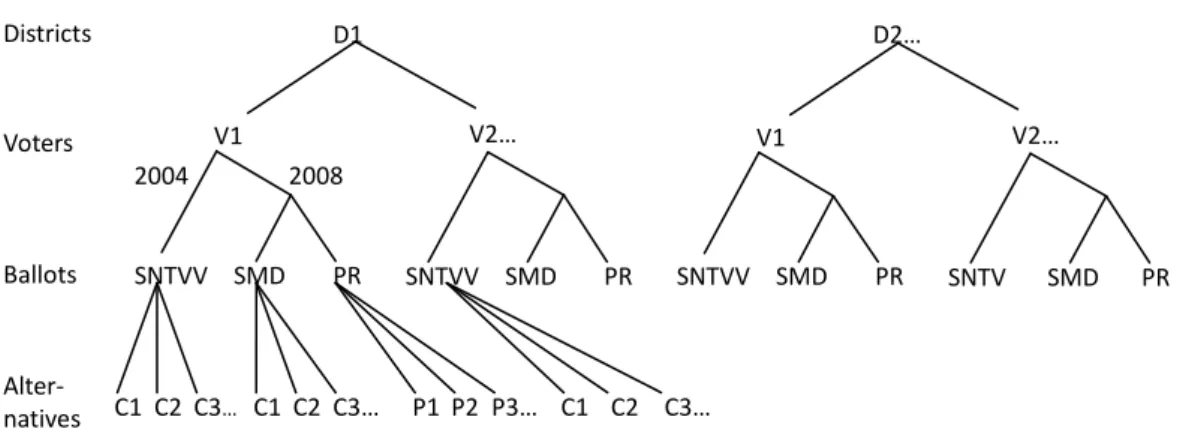
An important methodological implication of this debate is that while comparing electoral behavior across time we should conceive voters’ vote choices in a multilevel framework, as illustrated in Figure 1. Since the same voter cast a single ballot in the 2004 election and then two ballots (SMD and PR) in the 2008 election, ballots are nested within voters and thus tend to be highly correlated. This hierarchical framework constitutes the basis of our two-level logit model in the fifth section.
Panel Data and Research Hypotheses
In this study, we employ panel survey data to examine individual-level vote choices
under the SNTV system in 2004 and the MMM system in 2008 Legislative elections to see whether people tend to cast strategic votes in SMD tier comparing with the previous semi-proportional SNTV system as well as the new PR tier under the MMM system. The data set used in this study consists of 1,380 valid cases in the panel data section of two nation-wide surveys: “Taiwan’s Election and Democratization Study, 2004: Legislative Election” (abbreviated as TEDS 2004L) and “Taiwan’s Election and Democratization Study, 2008: Legislative Election” (TEDS 2008L)3
3
Data analyzed in this paper were from “Taiwan's Election and Democratization Study, 2004: Legislative Election (TEDS 2004L) (NSC 93-2420-H004-005-SSS) and “Taiwan's Election and
7
people’s vote choices over two elections through cross-tabulations. Then, we construct a two-level logit model to examine if SMD ballot still favors the greater coalition, i.e., the blue-camp in the 2008 election, after taking into account other major factors that might affect people’s vote choices on their SNTV ballot in 2004 as well as SMD and PR ballots in 2008.
As Abramson (1983, 71) argues, "[p]arty identification is an attitudinal variable that measures an individual’s sense of attachment to a political reference group." It is one of the most important variables in the political attitude and voting behavior research. Party identification "is a psychological identification, which can persist without legal recognition or evidence of formal membership and even without a consistent record of party support" (Campbell et al. 1960, 121). Previous researches of voting behavior find that party identification has been playing an important role since the 1950s (Campbell, Converse, Stokes, and Miller 1960). It anchors people’s political attitudes and predicts voting behavior well (Converse 1966). So too is party identification critical to voting behavior in Taiwan (Shyu 1991). We expect that people who identify with a given party tend to vote for its nominee.4
The other important factor is people’s stance on “Taiwan independence” vs. “Unification with China” issue. Because KMT is a pro-unification party and DPP supports Taiwan independence, we can expect people with “pro-unification” preference are more likely to support KMT but people with “pro-independence” are more likely to support DPP.
Besides obvious demographic variables such as sex, age, level of education and ethnicity origin, we also include evaluation of President Chen’s performance as controls. The reason why we add this variable to our model is not only because the previous literature indicates presidential performance affects congressional elections (Tsai 2008; Wu and Lee 2003) but also because President Chen was not a lamb duck during the 2008 election campaign period despite the fact that his second term would end in May 2008. Instead, President Chen took over the chairmanship of the DDP in October, 2007, and dominated the nomination and campaign strategies of the party.
Democratization Study, 2008: Legislative Election (TEDS 2008L) (NSC 96-2420-H004-002-025). The coordinator of the multi-year project TEDS is Professor Chi Huang (National Chengchi University). TEDS 2004L and TEDS2008L are yearly projects on the Legislative Yuan election in 2004 and 2008, respectively. The principal investigator is Professor I-Chou Liu for TEDS 2004L and is Professor Yun-han Chu for TEDS 2008L. More information is on TEDS website (http://www.tedsnet.org). The authors appreciate the assistance in providing data by the institute and individuals aforementioned. The authors are alone responsible for views expressed herein.
4 For SMD, we consider three NPSU candidates in Taichung county, Tainan county, and Penghu
county as KMT nominees because KMT cooperates with NPSU in Legislative Yuan so KMT stands off from these three districts. Another independent candidate, Tsai Hau in Pengtung county, is also considered as KMT for the same reason.
8
And yet meanwhile he had been plagued by a series of corruption charges against him and other first family members. We therefore argue that evaluation toward President Chen’s performance is important for voter choice in both the 2004 and 2008 Legislative Yuan elections.
Exploratory Data Analysis
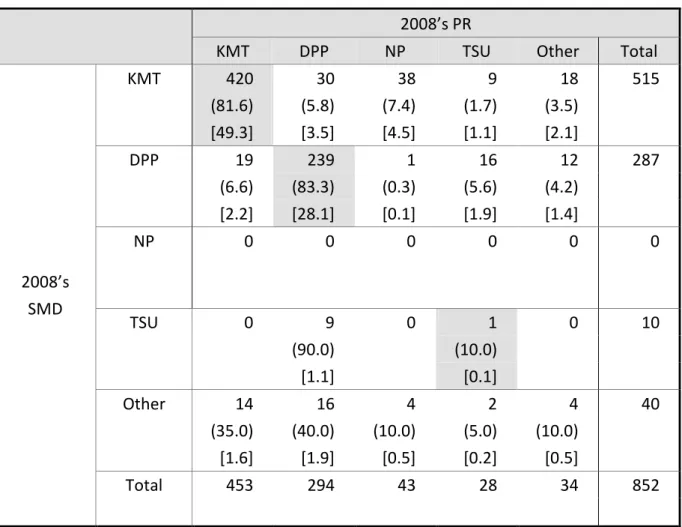
Table 3 cross-tabulates the voting choices of voters in terms of the two ballots,
SMD and PR, in 2008.5 It indicates that, among the two major parties and other smaller parties, not only an overwhelming majority (77.4%) of respondents adopted straight-ticket voting but almost all the straight-tickets went to the two major parties, KMT and DPP. Smaller parties such as the TSU suffers under the MMM system since only one respondent cast straight-ticket. Although the NP did not field any candidate in SMD districts it still obtained 7.4% of PR votes from those who voted for the KMT candidates on SMD ballot. This type of ticket splitting is often called “non-opportunity” (Ferrara, Herron, and Nishikawa 2005, 87) since NP supporters do not even have the option of casting straight tickets. Yet the pattern of ticket-splitting among the TSU supporters seems to worth particular attention. TSU nominated 13 candidates in a total of 73 districts, its supporters in these 13 districts did have chance to cast straight tickets. Yet in fact among the 10 respondents who voted for TSU candidates, only one voted straight-ticket for the TSU and all others swung to the DPP. Instead, 45.0% of them voted for the DPP candidates, 35.0% voted for the KMT candidates, and none voted for the TSU candidates on the SMD ballot. This seems to be a clear indication of how the gravity force of Duverger’s law operated in Taiwan’s new mixed electoral system. Obviously, straight-ticket voting is dominant among the two major party identifiers. For them, to vote sincerely seems to be an easy choice. If there is small proportion of ticket-splitting among party followers, it mainly occurs inside its coalition camp instead of across its camp. To a large extent the new MMM electoral systems further consolidate the blue vs. green confrontation in Taiwan.
[Table 3 about here]
Our focus is the continuity and change of voting choices before and after the
5
The following analyses do not include those who failed to turnout to vote and who refused to reveal their vote choices.
9
electoral system shift. Although Table 2 compares the vote and seat shares of parties in the 2004 legislative election under the SNTV and 2008 election under the MMM systems, it tells us only the net (or aggregate-level) changes. The most striking feature of the panel data is that it offers the possibilities to analyze gross changes at the individual level (Huang 2005). With a panel study, it is possible to identify the individuals who have changed their choices from one wave to another. Hagenaars (1990, 148-151) points out that the turnover table, which shows clearly how an individual’s score at time t1 differs from the score at time t2, forms the nucleus of the
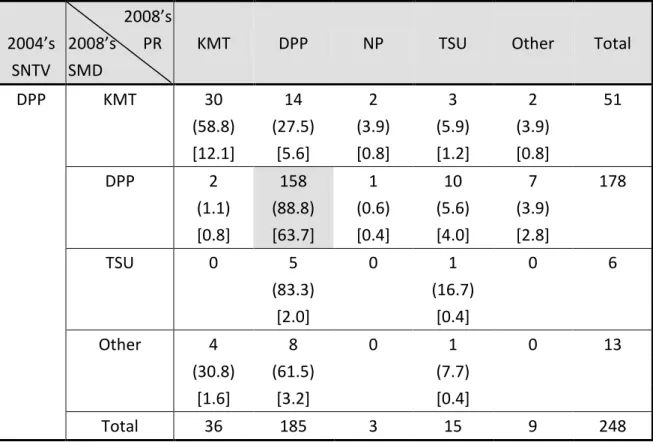
panel analysis of discrete data. We therefore decompose Table 3 into four partial tables (Tables 4-1 to Table 4-4) according to respondents’ vote choices in the 2004 legislative election under the SNTV system. Here again we find that major party supporters tend to be quite stable in their vote choices over time. Among those who voted for the KMT in 2004, 80.6% remained loyal to the KMT and cast straight-ticket in 2008. If we count in those ticket-splitters who either voted for the KMT on the SMD or voted for the NP on the PR ballot, the percentage of loyalists further raised to 90.3%. As to those who voted for the DPP in 2004, 63.7% remained loyal to the DPP. If we count in those who voted for the TSU on either the SMD or the PR ballot, the percentage increased to 80.6%. The most obvious difference between DPP and KMT supporters in 2004 is the relatively high swing rate of the former in 2008, especially the 51/248=20.6% on the SMD tier which is almost three times as high as the KMT swing rate.
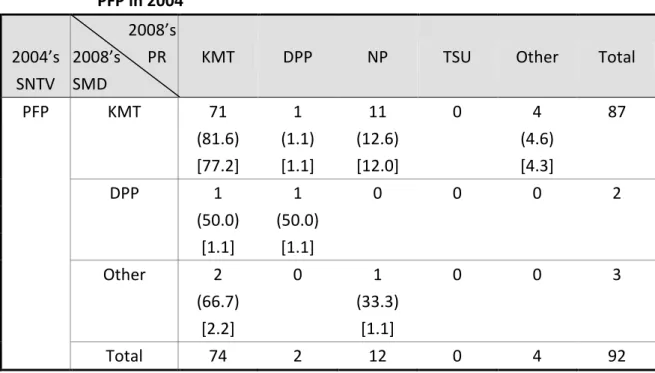
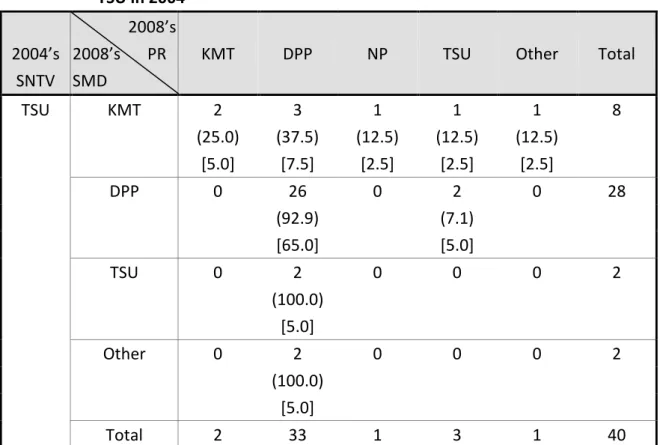
It should surprise no one that 77.2% of those PFT supporters in 2004 became the KMT straight-ticket voters. If we also count in those who voted for the NP on the party list ballot, the percentage shots up to 90.3%. On the other hand, although the TSU nominated 13 candidates in 73 districts, none of its supporters in 2004 voted straightly for TSU in 2008. In contrast, 70% of them voted strategically for the DPP candidates and 20% of them voted for the KMT candidates on the SMD tier. Furthermore, 82.5% of them voted for the DPP on the PR ballot. Indeed, although in 2008 the NP and TSU did receive 3.95% and 3.53% for the PR votes respectively nation-wide, neither of them managed to reach the 5% threshold required for parties to be allocated PR seats. We suspect that the relatively high 5% threshold of the PR tier might have induced some small party supporters also to vote “strategically” for the major party in each camp and thus make futile the minor parties’ campaigns. The MMM electoral system in Taiwan seems to squeeze small parties from both ends and facilitates the process toward a two-party system on the island, as Duverger’s law predicts.
10
A Two-Level Logit Model
Huang (2008a) argues that the most promising way of studying voting behavior is
to embed the micro-level motives in the macro-level institutional structures. Given that comparing the SNTV and MMM electoral systems forms a hierarchical structure with three ballots nested within voters and voters within districts, as illustrated in Figure 1, students of vote choices under this system had better adopt a model flexible enough to incorporate its key structural features while general enough to take account key players’ characteristics. Recent development of the multilevel logit model (Baltagi 2008; Cameron and Trivedi 2009; Rabe-Hesketh and Skrondal 2008; Raudenbush and Bryk 2002; Train 2003) fits this research objective well. Multilevel logit’s generality, despite its ostensible complexity, lies in its ability to model choices (i.e., each voter casts three ballots in two legislative elections) while accommodating possible unobserved heterogeneity due to taste variation or substitution pattern among alternatives. Indeed in our study, each voter casts two ballots in 2008 while they may face the trade-off between strategically voting for the major parties and sincerely voting for the most preferred smaller parties. We specify our model as a special case of generalized linear mixed models (GLMM) according the following steps.
[Figure 1 about here]
I. Random component. The dependent variable of our study is voter’s choice
between pan-blue and pan-green candidates/parties. By treating the pan-green as the base category, the dependent variable is a Bernoulli
distributed binary variable with the probability π of voting for the pan-blue. ij
(
)
(
)
1| yij 1 yij, 0,1; 0 1
ij ij ij ij ij ij f y π =π −π − y = <π <
II. Link function. We specify the logit link between the probability π and ij
the linear systematic component η . ij
( )
exp( ) log it ln 1 1 exp( ) ij ij ij ij ij ij ij or π η π η π π η = = = − + 11
legislative elections are nested in voters. We thus specify ballots in 2004 and 2008 elections as level one i and voters as level two j. Since our target of inference is the conditional association between a set of independent variables and the dependent variable holding constant the unobserved random effect, we should use the subject-specific model (Raudenbush 2009, 171-172).
(
)
(
)
0 1 1 7 0 00 0 0 0 00 1 1 10 1 1 11 Level 1 Level 2 , ~ 0, , ~ 0, ij j j ij j s sj j j s j j j W X u u N u u N η γ γ γ β β τ γ β τ = = + = + + = +∑
As explained in the section on data and hypotheses, we include eight
independent variables, one of them at level 1 and the rest at level 2. They are listed as follows.
Level 1: W1ij=SMD ballot (dummy variable) in the MMM system
Level 2: voter-specific variables
A. Demographic Variables: X1ij=sex (male=1, female=0)
X2ij=age
X3ij=education (high, median, and low, with low=0)
X4ij=ethnicity (Minnan, Hakka, Mainlander, and Aboriginal, with
Minnan=0)
B. Party Identification
X5ij=KMT, DPP, NP, PFP, and TSU, with independents & others=0
C. Political Attitudes
X6ij=attitude toward Taiwan’s independence/Unification with China, a 0-10
scale with independence=0 and unification=10
X7ij=evaluation of President Chen Shui-bian’s performance, a 0-10 scale
with very unsatisfied=0 and very satisfied=10
In words, we specify a random coefficient logistic model with not only the
subject-specific random intercept u0 j but also the random slope of the SMD ballot
with mean effect β10 and variance τ . That is, we hypothesize that the effect of 11 the new SMD ballot in 2008 tends to differ from voter to voter.
12
By combining both levels, we obtain the following mixed-effects model with fixed effects inside the brackets and random-effects outside the bracket:
7 00 10 1 0 0 1 1 1 ij ij s sij j j ij s W X u u W η β β β = = + + + +
∑
The covariance matrix of the two random terms becomes 0 00 01
1 10 11 j j u V u τ τ τ τ = . The
simple version of this random slope model is achieved by assuming the two random effects are independent and thus τ =01 τ =0. However, this assumption is often not 10 realistic in practice and should be tested by likelihood ratio (LR) test.
Estimation
In panel studies, it is often said that subjects serve as their controls when considering the effects of time-varying independent variables (Baltagi 2008, 6-7). However, this is not always true since we still need to worry omitted subject-level
variables, say Zj, which may correlate with random intercept u0 j and hence be
confounded with the time-varying variables of interest, such as the two variables of political attitudes X6 and X7. According to Mundlak (1978) and Neuhaus and
Kalbfleisch (1998), we can avoid omitted subject-level variable bias by subject-mean centering X6 and X7, that is, by subtracting the subject means from the original
variables. The regression coefficient of the subject-mean centered variable β can W be interpreted as a purely within-subject (or longitudinal effect). Rabe-Hesketh and Skrondal (2008, 115) show that the subject mean itself should also be included and its coefficient βBcan be interpreted as between-subject (or cross-sectional) effect. A test of the null hypothesis βW =βBcan be used to assess the exogeneity of X6 and X7,
which is equivalent to the Hausman test. A significant test result means that we should keep both the subject-mean centered and the subject mean in the equation. An insignificant test result means that βW =βBand the original variable suffices.
We estimate our two-level random-coefficient logit model in the following steps.
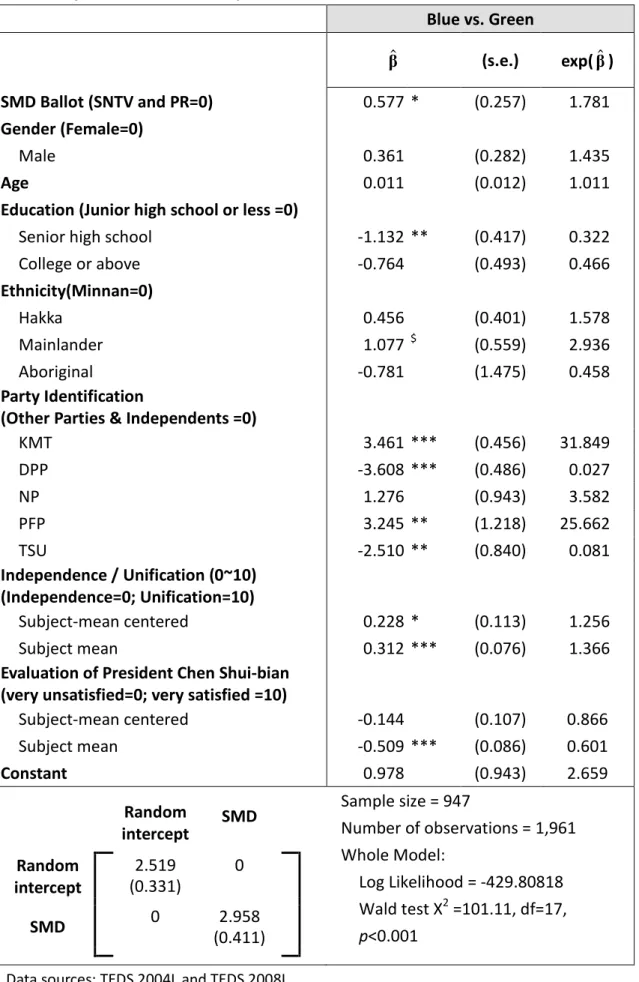
1. We first estimate a simple random-coefficient logit model (assuming τ =01 τ =0) 10 by including both the subject-mean centered and the subject mean of political attitudes in the equation, as shown in Table 5, and then test the null hypothesis
13
W B
β =β . The test on attitude toward independence/unification variable results in z=0.70 (p=0.486) and we do not reject the null hypothesis. We simply return to the original variable in the next step of analysis. In contrast, the test on the evaluation of President Chen Shui-bian’s performance results in z=-3.06 (p=0.002) which is significant. We therefore keep both the subject-mean centered and the subject mean of X7 in the equation and re-run the model. The estimates are
presented at the left column (Model 1) of Table 6.
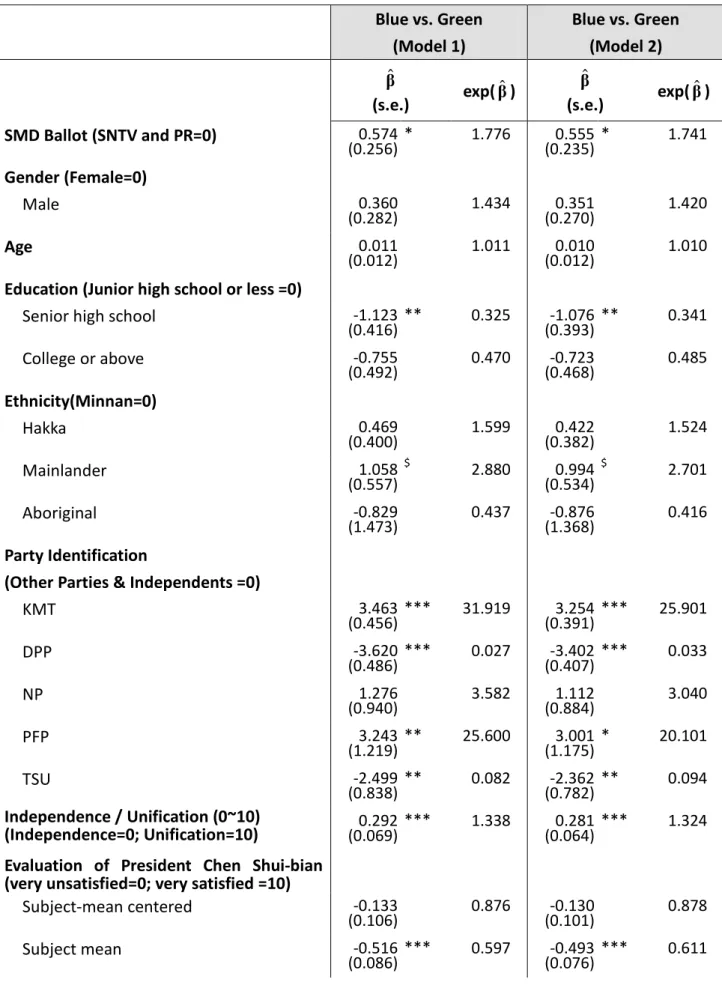
2. We then relax the independence-between-random-effects assumption and re-estimate the two-level logit model. Since Model 1 is nested in Model 2, likelihood ratio test is appropriate for model selection. A test result of LR X2=6.24 with df=1(p=0.0125) is statistically significant at 0.05 level. We therefore select the Model 2 on Table 6 as our final model.
[Tables 5 and 6 about here]
Interpretation
In terms of the central focus of this paper, the effect of the SMD ballot in the new
MMM electoral system, we find that on average voters tend to be exp(0.555)=1.741 times as likely to vote for the blue camp then vote for the green camp. This finding confirms our impression from reading partial turnover tables in the previous section. However, the regression estimate is more robust since it is the conditional effect holding constant all other variables and random effects. Furthermore, there is some indication that the effect of the SMD ballot varies substantially from voter to voter.
The confidence interval ofexp
( )
β ranges from 1.405 to 18.302 based on a 95% ˆ10 confidence level. Any assessment of the electoral system effect should take this substantial heterogeneity into account.As to those subject-specific variables, three out of the seven explanatory variables play significant roles in affecting voter choices. Demographic variables such as sex and age make little difference. Citizens with middle-level education (senior high school) are less likely to vote for the pan-blue than those with lower level of education. Mainlanders are more likely to vote for the pan-blue, albeit significant
14
only at the 0.1 level.
Not surprisingly, partisan voting is dominant. Comparing with non-partisans, those who identify themselves with the KMT/PFP are much more likely to vote for the pan-blue camp. Likewise, those who identify with the DPP/TSU are very unlikely to vote for pan-blue candidates as well as party list. This coincides with the dominant pattern of straight-ticket voting among the two major party identifiers.
Very much like all the previous studies have found, attitude toward Taiwan-independence vs. unification with China remains to be an important factor that influences voter choices. As indicated in Table 5, this variable is relatively stable during our study period and its longitudinal and cross-sectional effects are equivalent. Our final model estimate shows that, other things being equal, on average each point increase on the independence/unification scale leads to 32.4% increase in the odds of voting for the pan-blue camp.
Finally, evaluation of President Chen Shui-bian’s performance affects vote choices even after controlling for all the above-mentioned variables. As discussed earlier, a test of endogeneity rejects the null hypothesis of βW =βB. Both Model 1 and Model 2 indicate that its between-subject (or cross-sectional) effect is significant. On average for each one-point increase in the 0-10 evaluation scale favoring President Chen, the odds of voting for the pan-blue camp declined by about 38.9%. Staunch supporters of Chen are obviously also those “dark greens.” However, with a series of outbreaks of financial scandals involving Chen himself, his family, and officials in his administration since 2006, Chen’s popularity declined substantially. This fact alone certainly does not contribute to the overwhelming victory of the pan-blue camp in the 2008 legislative election. However, we do suspect that this negative effect of Chen’s poor image might have been magnified by the single-member district component of the MMM system which is known to favor disproportionally the single party which garnered nearly half of the total votes.
Differences in the MMM System between Japan and Taiwan
Despite the apparent similarities of the MMM systems between Japan and Taiwan, there are some subtle differences whose political consequences deserve closer examination.
1. Dual candidacy and the best loser provision.
15
prove to be the “best losers” in the nominal-tier single-member districts (SMD) in which they are nominated. Best-loser lists provide candidates with the incentive to campaign hard within their districts so as to be elected in the list tier even if defeated in their districts. Japanese parties may nominate candidates to compete for a PR seat by running hard in a losing SMD. However, no dual candidacy of the kind is permitted in Taiwan and therefore it is strictly closed party list in the PR tier.
2. PR constituencies
The 180 PR list seats (37.5% of the total 480 seats since year 2000 House election) are further distributed in 11 PR constituencies in Japan. Such institutional rule may be favorable to some smaller parties whose supporters tend to concentrate within certain PR constituencies. By contrast, the 34 list seats (30.1% of the total 113 seats) in Taiwan are elected in the whole nation as a single PR constituency.
3. Electoral threshold
In Japan, there is no formal electoral threshold for political parties on the second ballot to be eligible to the allocation of list seats. In Taiwan, however, parties competing for party-list seats must attain at least 5% of the vote nation wide—a provision which discriminates against small parties.As a result, only two major parties, Kuomintang (KMT) and the Democratic Progressive Party (DPP), met this threshold requirement in the 2008 Legislative Yuan election.Although two small parties, the New Party (NP) and the Taiwan Solidarity Union (TSU), did receive 3.95% and 3.53% for the PR votes respectively, neither of them managed to reach the 5% threshold.
Similarities and Differences in the Political Consequences
The above-mentioned differences in electoral rules might have divergent political consequences in Taiwan and Japan. I believe that it takes some careful and detailed comparative analyses to answer the following research questions.
1.Party System: Toward a Two-Party System but at a Different Pace?
Duverger (1959, 205) asserted that single-member district plurality would tend to generate two-party competition, and he also proposed that PR systems would
16
encourage multiparty competition.Since the MMM systems in Japan and Taiwan lack linkage between SMD and PR tiers, “the typical majoritarian boost received by a large party in the nominal tier is not likely to be wiped away by proportional allocation from the list tier.” (Shugart and Wattenberg 2001, 13) The PR portion in Japan accounts for only 37.5% of the total 480 seats and in Taiwan accounts for only 30.1% of the total 113 seats. It seems logical to argue that the gravity force of Duverger’s law will exert pressure on small parties and thus push down the number of parties.Indeed macro-level data seem to confirm Duverger’s law and indicate that the impact of electoral reforms on party systems in the two countries is a movement toward two-camp competition.
Why does it take Japan almost one and a half decades to gradually evolve toward a two-party system while in Taiwan the impact of the new electoral system on the party system is immediate and obvious? To what extent does this different pace contributed by the differences in electoral rules? For example, I suspect that the relatively high 5% threshold of the PR tier might have induced some small party supporters also to vote “strategically” for the major party.
The MMM electoral system in Taiwan seems to squeeze small parties from both SMD and PR ends and thus accelerates the process toward a two-party system on the island.
2. “Contamination Effect”: Are SMD and PR Ballots “Mixed” or Not?
A small number of studies criticized the failure of the mainstream literature taking account the potential for interaction effect or contamination effect across the two ballots under mixed rule (Cox and Schoppa 2002; Herron and Nishikawa 2001; Moser and Scheiner 2004). In order to lift the PR votes, party elites may have strong incentive to field candidates in single-member districts to give the party label a human face, regardless of the chance of winning the district seat. In other words, electoral incentives in one tier “contaminate” those in the other tier, complicating the insights from Duvergerian laws. Are voters in the two countries equally motivated to react to the maneuvers of political elites to maximize their parties’ seats and votes in both SMD and PR tiers? My speculation is probably not.
17
Despite some negative evidence (Maeda 2008), I suspect that in Japan with best loser provision, candidates who ‘died’ gloriously in their SMD can be ‘revived’ in PR ‘zombie Diet members’ and thus have strong incentive to run hard in their SMD, the interaction mechanism is more likely to take effect. Also, in Japan with 11 PR constituencies, smaller parties with supporters concentrated in an area are more likely to trade SMD votes in exchange of PR votes. Both theories and empirical evidence indicate that the higher the district magnitude, the greater the proportionality between vote shares and seat shares among parties. So Taiwan’s new electoral system should be more proportional since the whole country is treated as a PR constituency. However, the combination of single PR constituency and 5% threshold turns out to be less favorable to small parties. In Taiwan, therefore, there is little mechanism exists for interactions between SMD and PR ballots to take effect. Small party supporters might well vote strategically for major-party candidates and sincerely for PR lists, as Duverger’s law predicts, or even turn to major party list in the PR tier due to the seemingly formidable 5% electoral threshold.
Conclusions
This research project examines the continuity and change of voting behavior in Taiwan by comparing two Legislative Yuan elections immediately before and after the electoral system shift in 2005. We pay particular attention to strategic voting under the MMM system, and we employ the TEDS panel data to examine individual-level vote choices under the previous SNTV system and the new MMM electoral systems.
Both our exploratory analyses of turnover tables and two-level logit model estimation confirm that the SMD ballot in the new MMM electoral system tends to favor the party that successfully forms a coalition, i.e., the pan-blue camp in 2008. Besides the effect of electoral system change, partisan voting remains to be dominant in both 2004 and 2008 legislative elections. Comparing with non-partisans, those who identify themselves with the KMT/PFP are much more likely to vote for the pan-blue candidates in districts as well as the pan-blue parties on the PR ballot. Likewise, those who identify with the DPP are very unlikely to vote for pan-blue candidates and parties. Supporters of the smaller parties such as PFP and TSU in 2004 election, on the other hand, tend to vote strategically for the major party candidates of their own camp in 2008. Although the NP and TSU did receive 3.95% and 3.53% for the PR votes respectively in 2008, neither of them managed to reach the 5% threshold required for parties to be allocated PR seats. We suspect that the
18
relatively high 5% threshold of the PR tier might have induced some small party supporters also to vote “strategically” for the major party in each camp and thus make futile the minor parties’ campaigns.
Institutions do matter. The MMM electoral system in Taiwan seems to squeeze small parties from both ends and facilitates the process toward a two-party system on the island, as Duverger’s law predicts. This may be even true for seemingly “minor” differences among apparent similarities between two electoral rules in Japan and Taiwan. Their potential divergent consequences call for careful comparative studies and causal analyses in the future.
19
References
Abramson, Paul R. 1983. Political Attitudes in America: Formation and Change. San Francisco: W. H. Freeman and Company Press.
Baltagi, Badi H. 2008. Econometric Analysis of Panel Data, 4th edition. Chichester: Wiley.
Bauer, Monica, and John R. Hibbing. 1989. "Which Incumbents Lose in House Elections: A Reply to Jacobson's The Marginals Never Vanished." American
Journal of Political Science 33:262-271.
Cameron, A. Colin, and Pravin K. Trivedi. 2009. Microeconometrics Using Stata. College Station: Stata Press.
Campbell, Angus, Philip E. Converse, Warren E. Miller, and Donald E. Stokes. 1960.
The American Voter. Chicago: The University of Chicago Press.
Converse, Philip E., 1966. “The Concept of the Normal Vote.” In Angus Campbell, Philip E. Converse, Warren E. Miller, and Donald E. Stokes, Elections and the
Political Order, pp. 9-39. New York: Wiley.
Cover, Albert D., and David R. Mayhew. 1981. "Congressional Dynamics and the Decline of Competitive Congressional Elections." In Congressional
Reconsidered. 2nd ed., eds. Lawrence C. Dodd and Bruce I. Oppenheimer.
Washington, DC: Congressional Quarterly Press.
Cox, Gary W. 1990. “Centripetal and Centrifugal Incentives in Electoral System.”
American Journal of Political Science 34(4): 903-935.
---. 1997. Making Votes Count. New York: Cambridge University Press.
Cox, Karen, and Leonard J. Schoppa. 2002. “Interaction Effects in Mixed-Member Electoral Systems: Theory and Evidence from Germany, Japan, and Italy.”
Comparative Political Studies 35(9): 1027-1053.
Duverger, Maurice. 1959. Political Parties, 2nd English Edition, Revised. New York: Wiley.
Erikson, Robert S. 1972. "Malapportionment, Gerrymandering, and Party Fortunes in Congressional Elections." American Political Science Review 66:1234-1245. Ferrara, Federico, Erik S. Herron, and Misa Nishikawa. 2005. Mixed Electoral
Systems: Contamination and Its Consequences. New York: Palgrave Macmillan.
Grofman, Bernard. 2006. “The Impact of Electoral Laws on Political Parties.” In
Oxford Handbook of Political Economy, ed. Barry Weigast and Donald A.
Witten. Oxford: Oxford University Press.
Hagenaars, Jacques A. 1990. Categorical Longitudinal Data: Log-Linear Panel,
Trend, and Cohort Analysis. Newbury Park: Sage.
20
Model.” Econometrica 52(5): 1219-1240.
Hawang, Shiow-duan 1996. “The Importance of Candidate Images and Capabilities in Presidential Elections.” (in Chinese) Journal of Electoral Studies《選舉研究》, 3(1): 103-135.
---. 2005. “Candidate Image, Feeling Thermometer, and Presidential Voting Behavior.” (in Chinese) Taiwan Democracy Quarterly《台灣民主季刊》, 2(4): 1-30.
Herron, Erik S., and Misa Nishikawa. 2000. “Contamination Effects and the Number of Parties in Mixed-Superposition Electoral Systems.” Electoral Studies 20: 63-86.
Huang, Chi. 2001. “Straight- and Split-ticket Voting: Methodological Reflections.” (in Chinese) Journal of Social Sciences and Philosophy《人文及社會科學集刊》, 13(5): 541-574.
---. 2005. “Analyzing Electoral Stability and Change: Markov Chain Models for Longitudinal Categorical Data.” (in Chinese) Journal of Electoral Studies《選舉 研究》, 12(1): 1-37.
---. 2007. “Assessing the Impact of Mixed Electoral System in Taiwan: Methodological Challenges of Testing Interaction Effects.” at the International Symposium on Mixed Electoral Systems in East Asia, National Chengchi University, Taipei, May 26, 2007.
---. 2008a. “Contexts and Consequences of Electoral Systems.” (in Chinese) In The
Consequences of Electoral System Change: Methodological Perspectives《如何
評估選制變遷:方法論的探討》, ed. Chi Huang and Chin-hsing Yu. Taipei: Wunan Press
---. 2008b. “How to Study Voter Choice under the Mixed-Member Majoritarian Systems: A Multilevel Mixed Logit Model.” (in Chinese) In The Consequences
of Electoral System Change: Methodological Perspectives《如何評估選制變遷:
方法論的探討》, ed. Chi Huang and Chin-hsing Yu. Taipei: Wunan Press. Huang, Chi, Lu-huei Chen, and Ying-lung Chou. 2008. “Taiwan’s New Mixed
Electoral System and Its Effects on 2008 Legislative Election.” Paper presented at the 2008 Annual Meeting of the Japanese Electoral Studies Association, Tokyo, May 17-18, 2008.
Huang, Chi, Ding-ming Wang, and Ming-feng Kuo. 2005. “The Flow of the Vote in Japan between 1993 and 1996 House Elections.” (in Chinese) Journal of Social
Sciences and Philosophy《人文及社會科學集刊》, 17(4): 853-883.
Huang, Chi, Ding-ming Wang, and Ming-feng Kuo. 2008. “Straight- and Split-Ticket Voting in a Mixed-Member Majoritarin System: An Analysis of the 1996 House Election in Japan.” (in Chinese) Journal of Electoral Studies《選舉研究》, 15(2):
21
1-35.
Jacobson, Gary C. 1987. "The Marginals Never Vanished: Incumbency and Competition in Elections to the U. S. House of Representative, 1952-1982." American Journal of Political Science 31:126-141.
Lijphart, Arend.1994. Electoral System and Party Systems: A Study of Twenty-Seven
Democracies, 1945-1990. Oxford: Oxford University Press.
Lin, Chiung-chu. 2008. “Issues, Candidate Evaluations, and Partisanship: Competing Characterizations of the 2006 Taipei Mayoral Election.” (in Chinese) Taiwan
Democracy Quarterly《台灣民主季刊》, 5(2): 59-87.
Long, J. Scott and Jeremy Freese. 2006. Regression Models for Categorical
Dependent Variables Using Stata, 2nd edition. College Station, TX: Stata Press. Maeda, Ko. 2008. “Re-examining the Contamination Effect of Japan’s Mixed
Electoral System Using Treatment-Effect Model.” Electoral Studies, 27(4): 723-731.
Mayhew, David R. 1974. "Congressional Elections: The Case of the Vanishing Marginals." Polity 6:295-317.
McFadden, Daniel. 1974. “Conditional Logit Analysis of Qualitative Choice Behavior.” In Frontiers of Econometrics, ed. P. Zarembka. New York: Academic Press.
Moser, Robert G., and Ethan Scheiner. 2004. “Mixed Electoral Systems and Electoral System Effects: Controlled Comparison and Cross-National Analysis.” Electoral
Studies 23(4): 575-599.
Mundlak, Yair. 1978. “On the Pooling of Time Series and Cross Section Data.”
Econometrica 46(1): 69-85.
Neuhaus, J. M., and J. D. Kalbfleisch. 1998. “Between- and Within-Cluster Covariate Effects in the Analysis of Clustered Data.” Biometrics 54(2): 638-645.
Rabe-Hesketh, Sophia, and Anders Skrondal. 2008. Multilevel and Longitudinal
Modeling Using Stata, 2nd edition. College Station: Stata Press.
Rae, Douglas. 1967. The Political Consequences of Electoral Laws. New Haven: Yale University Press.
Raudenbush, Stephen W. 2009. “Targets of Inference in Hierarchical Models for Longitudinal Data.” In Longitudinal Data Analysis, ed. Garrett Fitzmaurice, Marie Davidian, Geert Verbeke, and Geert Molenberghs. Boca Raton: CRC Press.
Raudenbush, Stephen W., and Anthony S. Bryk. 2002. Hierarchical Linear Models:
Applications and Data Analysis Methods, 2nd edition. Thousand Oaks: Sage. Reed, Steven R. 2005. “Japan: Haltingly Toward a Two-Party System.” In The
22
Oxford University Press.
Shugart, Matthew Soberg and Martin P. Wattenberg. 2001. “Mixed-Member Electoral Systems: A Definition and Typology.” In Mixed-Member Electoral Systems: The
Best of Both Worlds? ed. Matthew Soberg Shugart and Martin P. Wattenberg.
Oxford: Oxford University Press.
Shyu, Huo-yan. 1991. “Party Identification and the Vote Choice: An Analysis of Electorate’s Party Images, Partisan Preferences and Voting Behavior in Taiwan.” (in Chinese) Journal of Social Science and Philosophy《人文及社會科學集刊》, 4(1):1-57.
StataCorp. 2009. Stata Release 11: Longitudinal Data/Panel Data [XT]. College Station: StataCorp LP.
Taagepera, Rein, and Matthew Soberg Shugart. 1989. Seats and Votes: The Effects
and Determinants of Electoral Systems. New Haven: Yale University Press.
Train, Kenneth. 2003. Discrete Choice Methods with Simulation. Cambridge: Cambridge University Press.
Tsai, Chia-hung. 2008. “Making Sense of Issue Position, Party Image, Party Preference, and Voting Choice: A Case Study of Taiwan’s 2004 Legislative Election.” Journal of Social Science and Philosophy《人文及社會科學集刊》, 20(1): 1-24.
Wang, Yeh-li. 2006. Comparative Electoral Systems《比較選舉制度》(in Chinese). Taipei: Wunan Press.
Wattenberg, Martin P. 1991. The Rise of Candidate-Centered Politics: Presidential
Elections of the 1980s. Cambridge: Harvard University Press.
Wu, Chung-li and Shih-Hung Lee. 2003. “The Pilot Study on the Effects of Presidential Performance upon Congressional Election: The Case of the Legislative Yuan Election 2001.” (in Chinese) Theory and Policy 《理論與政策》 17(1): 27-52
23
Table 1 Features of the Legislative Electoral System in Taiwan Since 1992
Term Election Year Electoral System Total Seats PR Seats (%) PR Legal Threshold Average District Magnitude1 ENPP2 2nd 1992 SNTV 161 36(22.4%) 5% 4.41 2.28 3rd 1995 SNTV 164 36(22.0%) 5% 4.52 2.54 4th 1998 SNTV 225 49(21.8%) 5% 5.79 2.48 5th 2001 SNTV 225 49(21.8%) 5% 5.79 3.47 6th 2004 SNTV 225 49(21.8%) 5% 5.79 3.26 7th 2008 MMM 113 34(30.1%) 5% 1 1.75 Source: Huang 2008b, 132.
Notes: 1. (Total number of seats elected from districts)/(Total number of districts).
2. Effective number of parliamentary parties (ENPP) between 1992 and 2004, see Wang, (2006, 97). ENPP of 2008 is computed by the first author.
Table 2 Vote/Seat Shares of Major Parties1 in 2004 and 2008 Legislative Elections
2004 2008
SNTV2 SMD2 PR Seat Total
Vote% Seats Seats% Vote% Seats Vote% Seats Seats# Seats%
KMT 32.83 79 35.11 53.50 61 51.23 20 81 71.68 DPP 35.72 89 39.56 38.17 13 36.91 14 27 23.89 NP 0.12 1 0.44 --- --- 3.95 0 0 0.00 PFP3 13.90 34 15.11 0.29 1 --- --- 1 0.89 TSU 7.79 12 5.33 0.95 0 3.53 0 0 0.00 NPSU 3.63 6 2.67 2.42 3 0.70 0 3 2.66 Other 6.00 4 1.78 4.68 1 3.68 0 1 0.89 Total 100.0 225 100.0 100.0 79 100.0 34 113 100.0
Sources: Huang, Chen, and Chou (2008). Data on vote/seat share for each party are from the Central Election Commission of the Ministry of the Interior, Republic of China.
Notes: 1. Parties: KMT, Kuomintang; DPP, Democratic Progressive Party; NP, New Party; PFP, People First Party; TSU, Taiwan Solidarity Union; NPSU, Non-Partisan Solidarity Union.
2. Vote statistics includes 2 aboriginal SNTV constituencies.
24
Table 3 Straight- and Split-Ticket Voting in 2008
2008’s PR
KMT DPP NP TSU Other Total
2008’s SMD KMT 420 30 38 9 18 515 (81.6) (5.8) (7.4) (1.7) (3.5) [49.3] [3.5] [4.5] [1.1] [2.1] DPP 19 239 1 16 12 287 (6.6) (83.3) (0.3) (5.6) (4.2) [2.2] [28.1] [0.1] [1.9] [1.4] NP 0 0 0 0 0 0 TSU 0 9 0 1 0 10 (90.0) (10.0) [1.1] [0.1] Other 14 16 4 2 4 40 (35.0) (40.0) (10.0) (5.0) (10.0) [1.6] [1.9] [0.5] [0.2] [0.5] Total 453 294 43 28 34 852
Data resource: TEDS2008L
Notes: 1. Figures in ( ) are row percentages. 2. Figures in [ ] are total percentages. 3. Pearson’s X2=567.585; df=12; p<0.001
4. Cramer’s V=0.471
25
Table 4-1 Straight- and Split-Ticket Voting in 2008 among Those Who Voted for KMT in 2004 2004’s SNTV 2008’s 2008’s PR SMD
KMT DPP NP TSU Other Total
KMT KMT 208 4 13 4 4 233 (89.3) (1.7) (5.6) (1.7) (1.7) [80.6] [1.6] [5.0] [1.6] [1.6] DPP 7 10 0 1 1 19 (36.8) (52.6) (5.3) (5.3) [2.7] [3.9] [0.4] [0.4] Other 4 1 1 0 0 6 (66.7) (16.7) (16.7) [1.6] [0.4] [0.4] Total 219 15 14 5 5 258
Data sources: TEDS2004L and TEDS2008L Notes: 1. Figures in ( ) are row percentages.
2. Figures in [ ] are total percentages. 3. Pearson’s X2=90.459; df=8; p<0.001
Fisher’s exact test: p<0.001 4. Cramer’s V=0.419
26
Table 4-2 Straight- and Split-Ticket Voting in 2008 among Those Who Voted for DPP in 2004 2004’s SNTV 2008’s 2008’s PR SMD
KMT DPP NP TSU Other Total
DPP KMT 30 14 2 3 2 51 (58.8) (27.5) (3.9) (5.9) (3.9) [12.1] [5.6] [0.8] [1.2] [0.8] DPP 2 158 1 10 7 178 (1.1) (88.8) (0.6) (5.6) (3.9) [0.8] [63.7] [0.4] [4.0] [2.8] TSU 0 5 0 1 0 6 (83.3) (16.7) [2.0] [0.4] Other 4 8 0 1 0 13 (30.8) (61.5) (7.7) [1.6] [3.2] [0.4] Total 36 185 3 15 9 248
Data sources: TEDS2004L and TEDS2008L Notes: 1. Figures in ( ) are row percentages.
2. Figures in [ ] are total percentages. 3. Pearson’s X2=120.474; df=12; p<0.001
Fisher’s exact test: p<0.001 4. Cramer’s V=0.402
27
Table 4-3 Straight- and Split-Ticket Voting in 2008 among Those Who Voted for PFP in 2004 2004’s SNTV 2008’s 2008’s PR SMD
KMT DPP NP TSU Other Total
PFP KMT 71 1 11 0 4 87 (81.6) (1.1) (12.6) (4.6) [77.2] [1.1] [12.0] [4.3] DPP 1 1 0 0 0 2 (50.0) (50.0) [1.1] [1.1] Other 2 0 1 0 0 3 (66.7) (33.3) [2.2] [1.1] Total 74 2 12 0 4 92
Data sources: TEDS2004L and TEDS2008L Notes: 1. Figures in ( ) are row percentages.
2. Figures in [ ] are total percentages. 3. Pearson’s X2=23.293; df=6; p=0.001
Fisher’s exact test: p=0.116 4. Cramer’s V=0.356
28
Table 4-4 Straight- and Split-Ticket Voting in 2008 among Those Who Voted for TSU in 2004 2004’s SNTV 2008’s 2008’s PR SMD
KMT DPP NP TSU Other Total
TSU KMT 2 3 1 1 1 8 (25.0) (37.5) (12.5) (12.5) (12.5) [5.0] [7.5] [2.5] [2.5] [2.5] DPP 0 26 0 2 0 28 (92.9) (7.1) [65.0] [5.0] TSU 0 2 0 0 0 2 (100.0) [5.0] Other 0 2 0 0 0 2 (100.0) [5.0] Total 2 33 1 3 1 40
Data sources: TEDS2004L and TEDS2008L Notes: 1. Figures in ( ) are row percentages.
2. Figures in [ ] are total percentages. 3. Pearson’s X2=19.048; df=12; p=0.087
Fisher’s exact test: p=0.037 4. Cramer’s V=0.398
29
Table 5 Two-Level Random Intercept Logit Model: A Test of Equality of Within-subject and Between-subject Effects
Blue vs. Green ˆ β (s.e.) exp(βˆ) SMD Ballot (SNTV and PR=0) 0.577 * (0.257) 1.781 Gender (Female=0) Male 0.361 (0.282) 1.435 Age 0.011 (0.012) 1.011
Education (Junior high school or less =0)
Senior high school -1.132 ** (0.417) 0.322
College or above -0.764 (0.493) 0.466 Ethnicity(Minnan=0) Hakka 0.456 (0.401) 1.578 Mainlander 1.077 $ (0.559) 2.936 Aboriginal -0.781 (1.475) 0.458 Party Identification
(Other Parties & Independents =0)
KMT 3.461 *** (0.456) 31.849 DPP -3.608 *** (0.486) 0.027 NP 1.276 (0.943) 3.582 PFP 3.245 ** (1.218) 25.662 TSU -2.510 ** (0.840) 0.081 Independence / Unification (0~10) (Independence=0; Unification=10) Subject-mean centered 0.228 * (0.113) 1.256 Subject mean 0.312 *** (0.076) 1.366
Evaluation of President Chen Shui-bian
(very unsatisfied=0; very satisfied =10)
Subject-mean centered -0.144 (0.107) 0.866 Subject mean -0.509 *** (0.086) 0.601 Constant 0.978 (0.943) 2.659 Random intercept SMD Random intercept 2.519 (0.331) 0 SMD 0 (0.411) 2.958 Sample size = 947 Number of observations = 1,961 Whole Model: Log Likelihood = -429.80818 Wald test X2 =101.11, df=17, p<0.001
30
31
Table 6 Two-level Random Coefficient Logit Model with and without Correlation Between Random Terms
Blue vs. Green (Model 1) Blue vs. Green (Model 2) ˆ β (s.e.) exp(βˆ) ˆ β (s.e.) exp(βˆ) SMD Ballot (SNTV and PR=0) 0.574 (0.256) * 1.776 (0.235) 0.555 * 1.741 Gender (Female=0) Male 0.360 (0.282) 1.434 (0.270) 0.351 1.420 Age 0.011 (0.012) 1.011 (0.012) 0.010 1.010
Education (Junior high school or less =0)
Senior high school -1.123
(0.416) ** 0.325 (0.393) -1.076 ** 0.341 College or above -0.755 (0.492) 0.470 (0.468) -0.723 0.485 Ethnicity(Minnan=0) Hakka 0.469 (0.400) 1.599 (0.382) 0.422 1.524 Mainlander 1.058 (0.557) $ 2.880 0.994 (0.534) $ 2.701 Aboriginal -0.829 (1.473) 0.437 (1.368) -0.876 0.416 Party Identification
(Other Parties & Independents =0)
KMT 3.463 (0.456) *** 31.919 (0.391) 3.254 *** 25.901 DPP -3.620 (0.486) *** 0.027 (0.407) -3.402 *** 0.033 NP 1.276 (0.940) 3.582 (0.884) 1.112 3.040 PFP 3.243 (1.219) ** 25.600 (1.175) 3.001 * 20.101 TSU -2.499 (0.838) ** 0.082 (0.782) -2.362 ** 0.094 Independence / Unification (0~10) (Independence=0; Unification=10) (0.069) 0.292 *** 1.338 (0.064) 0.281 *** 1.324
Evaluation of President Chen Shui-bian
(very unsatisfied=0; very satisfied =10)
Subject-mean centered -0.133
(0.106) 0.876 (0.101) -0.130 0.878
Subject mean -0.516
32 Constant 1.089 (0.929) 2.971 (0.887) 1.045 2.843 Model 1 Random intercept SMD Random intercept 2.513 (1.045) 0 SMD 0 (1.409) 2.937 Model 2 Random intercept SMD Random intercept 1.581 (0.708) (0.398) 1.254 SMD (0.398) 1.254 (0.544) 0.995 Sample size = 947 Number of observations = 1,961 Whole Model:
Model 1: Log Likelihood = -430.05081
Wald test X2 =101.51, df=16, p<0.001 Model 2: Log Likelihood = -426.93054
Wald test X2 =159.34, df=16, p<0.001
Data sources: TEDS 2004L and TEDS 2008L
33
Figure 1 Hierarchical Structure of Taiwan’s SNTV and MMM Electoral Systems in the 2004 and 2008 Legislative Yuan Elections
Source: revised from Huang 2008b, 139.
Notes: D= district; V= voter; SNTV= single nontransferable vote; SMD= single-member district; PR= proportional representation; C= candidate; P= party
Voters Ballots Alter- natives Districts C1 PR 2004 SNTVV C3… V1 V2… D1 P3… 2008 SMD C2 C3… C1 C2 C3… P1 P2 PR SNTVV SMD PR C1 C2 V1 V2… SMD SNTVV PR SNTV SMD D2…
34