National Chiao Tung University
Department of Mechanical Engineering
PhD Thesis
以平行化二維流體模型模擬 CF
4低溫電感耦合式電漿
源蝕刻二氧化矽(SiO
2)之研究
Numerical Investigation of Carbontetrafluoride Inductively Coupled
Plasma Source Considering Silicon Dioxide Etching Process Using a
Parallel 2-D Axisymmetric Fluid Model
Student: Yuan-Ming Chiu (邱沅明)
Advisor: Dr. Jong-Shinn Wu (吳宗信 博士)
以平行化二維流體模型模擬 CF
4低溫電感耦合式電漿源蝕刻
二氧化矽(SiO
2)之研究
Numerical Investigation of Carbontetrafluoride Inductively
Coupled Plasma Source Considering Silicon Dioxide Etching
Process Using a Parallel 2-D Axisymmetric Fluid Model
研 究 生 : 邱沅明
Student : Yuan-Ming Chiu
指導教授 : 吳宗信 博士
Advisor : Dr. Jong-Shinn Wu
國 立 交 通 大 學
機 械 工 程 研 究 所
博 士 論 文
by Yuan-Ming ChiuB.Tech., National Dong Hwa University, Hualien, 2003 M.S., National Tsing Hua University, Hsinchu, 2006
A Thesis
Submitted in partial fulfillment of the requirements
for the degree of Doctor of Philosophy in Mechanical Engineering in the Graduate College of the National Chiao Tung University, 2012
Hsinchu, Taiwan
I
中文摘要
以平行化二維流體模型模擬 CF
4低溫電感耦合式電漿源蝕刻二氧化
矽(SiO
2)之研究
國立交通大學機械工程學系
學生:邱沅明
指導教授:吳宗信博士
本論文研究目的是發展、驗證與應用一個平行化二維軸對稱的電漿流體模型 程式。本研究所使用的電漿流體模型程式包含了流體模型方程式、計算感應電磁 場的 Maxwell’s equations、計算靜電場的 Ambipolar 擴散模型、計算蝕刻二氧化 矽表面鍵結情形的表面平衡方程式。我們是使用半隱式(semi-implicit)有限差分法 離散流體模型所考慮的方程式。這些離散後的矩陣方程式則是使用 Krylov subspace (KSP)和矩陣前處理器(preconditioner)數值方法來求解。在計算的過程 中,我們利用區域切割的平行計算方法來加快計算時間,處理器在計算期間所需 要的資訊交換是透過 MPI 的函式庫來完成。接著,我們利用此一電漿流體模型 來探討不同型式的 CF4低溫電感式電漿源在蝕刻 SiO2基版時所發生之電漿物理 與化學特性。研究結果顯示 CF3+是主要的離子氣體,而負離子 F-的濃度相較於 正離子氣體稍微低一點,但是和電子相比,F-的濃度卻相當的接近電子濃度,代 表所模擬的電漿源為負離子電漿源。在中性氣體的模擬結果顯示活性自由基 F 原子氣體僅次於 CF4進氣氣體,為最多的活性氣體; 另外,SiF4、COF2 和 O2為 蝕刻 SiO2時所產生最主要的蝕刻氣體,和實驗所量測之蝕刻產物氣體成分相當 吻合。最後,模擬顯示螺旋式線圈和進氣口均圍繞在傳統腔體側邊的電漿源的蝕 刻效率最好,因為不但有高蝕刻速率並且有良好的蝕刻均勻度。本研究主要可以 分成四個部份。第一部分為二維軸對稱電漿流體模型方程式之描述,第二部分為II 我們所使用的離散方法、數值方法和平行化的方法之簡介,第三部分為平行程式 之驗證與平行效能測試,第四部分主要是利用所驗證的平行化流體模型程式來研 究各種不同 CF4電感式電漿源。以下將一一簡單介紹每一部份。 在第一部分,我們將詳細介紹由波茲曼方程式推導出之電漿流體模型、 Maxwell’s equations 和表面動力模型。此電漿流體模型包含所有粒子的連續方程 式、帶電粒子的漂移-擴散(drift-diffusion) 近似的動量方程式以及電子的能量方 程式。流體模式中所需要的靜電場是依據 Ambipolar 擴散模型所得到。電子能量 方程式所需要的電子吸收功率,則是計算 Maxwell’s equations 得到軸向的感應電 場並帶入 Ohmic heating 得到電漿吸收功率。程式裡面用來計算二氧化矽覆蓋率 和表面化學特性的表面動力學也會在此部份中做一詳盡的介紹。 在第二部分,我們將介紹程式中計算流體的數值方法和平行化的計算。此部 份一開始會詳細介紹離散化後之方程式。在每一時間步進中,我們使用 Krylov subspace method (KSP)和矩陣前處理(precondition)之組合求解離散化後之矩陣方 程。為了加速計算的速率,我們使用區域切割計算方法來平行化這些計算之數值 方法。 在第三部分,我們將驗證與測試所發展之平行化電漿流體程式的正確性和平 行計算效能。程式之驗證是和 Fukumoto 等人[26][74]之前的研究結果作一比較, 在同一模擬條件下所模擬的結果和他們所作之實驗和模擬數據非常一致。我們將 所發展的平行化電漿流體模型在台灣國家高速電腦中心 IBM1350 的機器上作一 效能測試,發現疊代法使用 GMRES 和矩陣前處理器使用 Block Jacobi 在網格數
為 122 179 之電漿模擬能線性加速計算效能至 26 顆處理器。
在第四部分,我們利用所發展和所驗證的平行化電漿流體模型程式探討不同
型式的 CF4電感式電漿源內之物理機制和化學特性。此部份所探討之電感式電漿
源包括標準的 GECRC 電漿源、平板式線圈設計在傳統腔體上方的電漿源、螺旋 式線圈設計在傳統腔體側邊的電漿源以及圓頂式腔體的電漿源。本部份的電漿流
III 體化學模型總共考慮 96 條氣相化學反應式和 27 條二氧化矽表面反應。首先,我 們將詳盡地討論在 GECRC 電感式電漿源和圓頂腔體式電感式電漿源內之電漿氣 體的空間分布、化學特性、蝕刻產物和化學反應速率。結果顯示不論在 GECRC 或是圓頂式腔體內部主要的離子氣體為 CF3+,原因為解離 CF4產生 CF3+的解離 能在所有的解離反應為最低。而負離子 F-的濃度相較於正離子氣體稍微低一點, 但是由於其電子附著反應能很低,使得 F-的濃度相當的接近電子濃度。此外,在 中性氣體的結果發現氟原子氣體 F 僅次於 CF4背景氣體為最多的活性氣體,因為 氟原子在游離反應中被大量的生成。此外,蝕刻過程所產生的蝕刻氣體大部份為 SiF4、COF2 和 O2,其結果和很多實驗所量測結果一致。同時,我們應用此模型 來探討各種電感式電漿源的蝕刻速率和蝕刻均勻度並幫助改進電感式電漿源的 腔體設計。模擬結果顯示把螺旋式線圈和環狀進氣口兩者圍繞在傳統腔體測邊的 電漿源之蝕刻效率最好,因為不但有高蝕刻速率並且有良好的蝕刻均勻度,其原 因為電漿生成區域接近外圍基版,不會過度集中於腔體中間區域,使的蝕刻所需 的活性離子氣體如氟原子氣體均勻地傳輸到基版。 此外,我們會將本論文研究的主要發現以及未來應進行之研究部分條列說明 於論文之最後。 關鍵字:電感式電漿源; 流體模型; 平行計算; GECRC; 圓頂式電搞式電漿 源; CF4氣體放電; 表面動力學
IV
ABSTRACT
Numerical Investigation of Carbontetrafluoride Inductively Coupled
Plasma Source Considering Silicon Dioxide Etching Process Using a
Parallel 2-D Axisymmetric Fluid Model
Department of Mechanical Engineering
Student: Yuan-Ming Chiu
Advisor: Dr. Jong-Shinn Wu
This thesis reports development and validation of a parallel 2-D axisymmetric plasma fluid model which includes the fluid modeling equations for plasma transport, the Maxwell’s equations for induced electric field, ambipolar diffusion for electrostatic electric field, and surface kinetic model for modeling SiO2 etching. This
model is discretized by using the semi-implicit finite difference method with preconditioned Krylov subspace (KSP) method for discretized modeling equations. The fluid modeling code is parallelized using domain decomposition method through the use of MPI protocol. We employ this plasma fluid model to study plasma physics and chemistry of tetrafluoromethane (CF4) gas discharge considering the etching
process of a SiO2 substrate in different inductively coupled plasma (ICP) sources. The
results show that CF3+ is the dominant charged species, and F- concentration is
comparable to that of electron. Reactive F atom is the most dominant radical in CF4
discharge. In addition, the major etching products from the the substrate are SiF4,
COF2 and O2 in all ICP reactors considered in this thesis. Finally, the results show that
it is possible to design an ICP reactor with relatively high and uniform etching rate with both gas inlet and coil arranged along the cylindrical wall. Researches in this thesis are divided into four major parts. The first part is the description of the fluid moldeing equations. The second part is the numerical schemes and algorithms for
V
solving the fluid modeling equations and corresponding parallel computing method. The third part is the description of validation and parallel performance of the parallel fluid modeling code. The fourth part is the description of applications of the developed fluid modeling code for study the CF4 discharge in various inductively
coupled plasma sources.
In the first part, the fluid modeling equations, derived from the velocity moments of Boltzmann equation, the Maxwell’s equations and the surface kinetic model are introduced in detail. The fluid modeling equations include the continuity equations for charged and neutral species, the electron energy density equation, the momentum equations by the drift-diffusion approximation for the charged species, the ambipolar diffusion approximation for the electrostatic field. The power absorption that is needed in electron energy equation is solved through the Maxwell’s equation. The surface kinetic model (or site balance equations) for CF4 discharge etching SiO4 is also
introduced in this part.
In the second part, the numerical schemes and algorithms for solving fluid modeling equations and the corresponding parallel computing method are introduced. The discretized equations are presented in detail. A combined method of preconditioning and Krylov subspace method (KSP) are proposed to solve the large sparse algebraic linear system formed at each time step. Parallel computing of the fluid modeling code using domain decomposition is also reported.
In the third part, the validation and parallel performance of the developed parallel 2D axisymmetric plasma fluid model are reported. Simulations are compared reasonably well with the previous simulation and experimental results by Fukumoto et
al. [26][74]. Parallel performance study shows that the fluid code is scalable up to 26 processors on the IBM-1350 at National Center for High-Performance Computing in
VI
Taiwan using the combination of GMRES and Block Jacobi with sub-preconditioner ILU with a problem size of 122×179.
In the fourth part, we employ our developed and validated parallel plasma fluid model to study plasma physics and plasma chemistry of CF4 discharge in different
geometries of ICP reactors: a typical ICP reactor, a GECRC, and a dome-shaped ICP reactor. The plasma chemistry includes 96 gas-phase reaction channels and 27 surface reaction channels. The spatial distributions of various plasma properties, etching characteristics, and production rate are described in detail in the both GECRC and dome-shaped ICP reactor. The numerical results indicate that CF3+ is the dominant
charged species because the threshold energy of electron-impact dissociative ionization reacting with the feedstock that produces CF3+ is the lowest among all
dissociative ionization. In addition, F- concentration is comparable to that of electron in the CF4 discharge because dissociative-attachment energy of CF4 is the lowest.
Furthermore, the reactive F atom is found to be the most dominant radical in CF4 ICP
discharge. The major etching products from the substrate are SiF4, COF2 and O2,
which is consistent with the previous experimental observations. Meanwhile, this plasma fluid model is employed to study the etching characteristics in different geometries of ICPs reactor for predicting etching rate and corresponding uniformity on the substrate surface. The results show that the typical cylindrical ICP reactor with both gas inlet and coils arranged along the cylindrical wall gives relatively high and uniform etching rate because the dissociative ionization tends to peak off-axis to affect plasma density profile most likely off-axis so that the discharge region is flat and wide near the substrate. It proofs that this simulation tool could help to optimize the designs of large reactors with very low cost.
VII
Finally, major findings and recommendations for future study are outlined at the end of the thesis.
Keywords: Inductively Coupled Plasma (ICP), Fluid Model, Parallel Computing,
VIII
ACKNOWLEDGMENTS
First and foremost the author is heartily grateful to his supervisor, Prof. Jong-Shinn Wu, whose encouragement, guidance and support from the initial to the final level enabled the author to develop an understanding of this research and implementation of this lengthy thesis. The author would also like to present his appreciations to Prfo. Feng-Nan Hwang (NCU) and Prof. Tsin-Fu Jiang (NCTU) who helped a lot during the course of this research. The author would also like to convey thanks to his thesis committee members (Prof. Shou-Shing Hsieh, Prof. Tong-Miin Liou, Prfo. Chwung-Shan Kou, Prof. Feng-Nan Hwang, Prof. Cheng-Che Hsu, Prof. Chi-Chuan Wang, and Prof. Yao-Hsien Liu) providing many valuable suggestions and insightful advice.
In addition, the author would also acknowledge Dr. Chieh-Tsan Hung, Dr. Hsin-Yun Chou, Dr. Ming-Hung Chiang, Dr. Yun-Min Lee, Fu-Li Li, Kai-Wen Cheng, Kai-Wen Cheng, Ya-Ju Lin, Kun-Mo Lin, Cheng-Chin Su, Tzu-Hao Chou, Bi-Ren Gu, Yi-Wei Yang, Chih-Tung Liu, Guan-Rung Lai, Wei-Cheng Hung, Chih-Wei Lu, Tsung-Han Lin, Wun-Ci Wu, Zheng-Ling Lu, Yu-Tsung Liu, Chih-Liang Liu, Ying-Chih Wang, I-Min Lin, Jyun-Jie Lin, Po-Tsun Shen, Ruei-Shang Chen, and Huang-Chin Chen for their endless supports, advice and their willingness to share their bright thoughts with him, which were very fruitful for shaping up his ideas and research.
Lastly, the author offers his regards and blessings to all of those who supported him in any respect during the completion of the reserarch.
Yuan-Ming Chiu
IX
TABLE OF CONTENTS
中文摘要... I ABSTRACT ... IV ACKNOWLEDGMENTS ... VIII TABLE OF CONTENTS ... IXLIST OF TABLES ... XIV
LIST OF FIGURES ... XV
NOMENCLATURE ... XXIII
CHAPTER 1 INTRODUCTION ... 1
1.1 Background and Motivation ... 1
1.2 Overview of Low-Pressure Non-Equilibrium Plasma Sources ... 3
1.2.1 Classification of Low-Pressure Gas Discharges in Semiconductor Fabrication... 4
1.2.1.1 Direct Current Plasma (DCP) ... 4
1.2.1.2 Capacitively Coupled Plasma (CCP) ... 5
1.2.1.3 Electron Cyclotron Resonance Plasma (ECR) ... 6
1.2.1.4 Inductively Coupled Plasma (ICP) ... 7
1.2.2 Some Fundamentals of Plasma Physics ... 8
1.2.2.1 Debye Length ... 9
1.2.2.2 Plasma Sheath ... 10
1.2.2.3 Bohm Velocity ... 10
1.2.2.4 Plasma Oscillations (plasma frequency) ... 11
1.2.3 Classification of Plasma Chemistry ... 12
1.2.3.1 Electron-Impact Reactions ... 12
X
1.2.3.3 Neutral Related Reactions ... 14
1.3 Overview of Inductively Coupled Plasma Source (ICPs) ... 14
1.3.1 Dielectric Constant and Conductivity ... 17
1.3.2 Wave and Skin Depth in ICPs ... 17
1.3.3 Ohmic Heating in an ICPs ... 18
1.4 Literature Survey for Modeling ICP ... 19
1.4.1 Numerical Modeling of ICPs... 20
1.4.2 Electropositive ICP ... 21
1.4.3 Electronegative ICP ... 23
1.4.4 Tetrafluoromethane CF4 Discharge in ICPs ... 25
1.5 Specific Objectives and Organization of this Thesis ... 27
CHAPTER 2 NUMERICAL METHODS ... 29
2.1 Introduction ... 29
2.2 Fluid Model Equations ... 30
2.2.1 Transport Equations for Charged Species ... 34
2.2.2 Transport Equations for Neutral Species ... 35
2.2.3 Electron Energy Density Equation ... 36
2.3 Maxwell’s Equations for Electron Power Absorption Calculation ... 37
2.3.1 Vector Wave Equation ... 37
2.3.1.1 Plasma Region ... 38
2.3.1.2 Quartz Region ... 39
2.3.1.3 Coil Region ... 39
2.3.1.4 Air Region ... 39
2.3.1.5 Maxwell’s Equations in Alternative Form ... 40
XI
2.4 Heat eqution ... 41
2.5 Surface Kinetic Model ... 42
2.6 Boundary Conditions ... 44
2.7 Gas-Phase Reactions of CF4 ICP Source ... 46
2.8 Numerical Discretizations and Algorithms ... 47
2.8.1 Discretizations of Conservation Equations ... 47
2.8.1.1 Discretizations of Continuity Equations ... 48
2.8.1.2 Discretizations of Electron Energy Density Equation ... 49
2.8.1.3 Discretizations of Maxwell’s Equation ... 49
2.8.1.4 Discretizations of Heat Equation ... 51
2.8.2 Numerical Algorithms for Solving Discretized Equations ... 52
2.8.3 Numerical Procedures ... 53
2.8.4 Implementation of Parallel Computation ... 54
CHAPTER 3 VALIDATION AND PARALLEL PERFORMANCE ... 55
3.1 Validation ... 55
3.2 Parallel Performance ... 56
CHAPTER 4 RESULTS AND DISSCUSION ... 58
4.1 CF4 Discharge in Gaseous Electronics Conference Reference Cell (GECRC) ... 58
4.1.1 Spatial Profiles ... 59
4.1.1.1 Induced Electric Field, Power Absorption and Electron Temperature ... 59
4.1.1.2 Production Rate ... 60
4.1.1.3 Electron and Negative Charge Ions ... 62
XII
4.1.1.5 Neutral and Radical Species ... 64
4.1.2 Chemical Ingredients ... 67
4.1.3 Surface Coverage ... 68
4.1.4 Etching Rate and Fluxes to Substrate ... 68
4.2 CF4 Discharge in a Dome-Shaped ICP Reactor ... 70
4.2.1 Spatial Profiles ... 71
4.2.1.1 Induced Electric Field, Power Absorption and Electron Temperature ... 71
4.2.1.2 Production Rate ... 72
4.2.1.3 Electron and Negative Charge Ions ... 74
4.2.1.4 Positive Ions ... 75
4.2.1.5 Neutral and Radical Species ... 76
4.2.2 Chemical Ingredients ... 78
4.2.3 Surface Coverage ... 79
4.2.4 Etching Rate and Fluxes to Substrate ... 79
4.3 Comparison of Etching Rates in Different Type of Inductively Coupled Plasma Reactors ... 81
4.3.1 Reactor Geometries... 81
4.3.2 Testing Conditions ... 82
4.3.3 Spatial Profiles ... 82
4.3.4 Fluxes, Coverage and Etching Rate ... 85
CHAPTER 5 CONCLUSION AND RECOMMENDATIONS FOR FUTURE WORK ... 88
5.1 Summary ... 88
XIII REFERENCES ... 91 TABLES ... 97 FIGURES ... 111 LIST OF PUBLICATIONS ... 166 APPENDIX A ... 168 APPENDIX B ... 170
XIV
LIST OF TABLES
Table 1: Summary of fluid model used for electropositive inductively coupled
discharge. ... 97
Table 2: Summary of fluid model used for electronegative inductively coupled
discharge. ... 98
Table 3: Overview of the species included in the model and corresponding
parameters for transport properties. ... 99
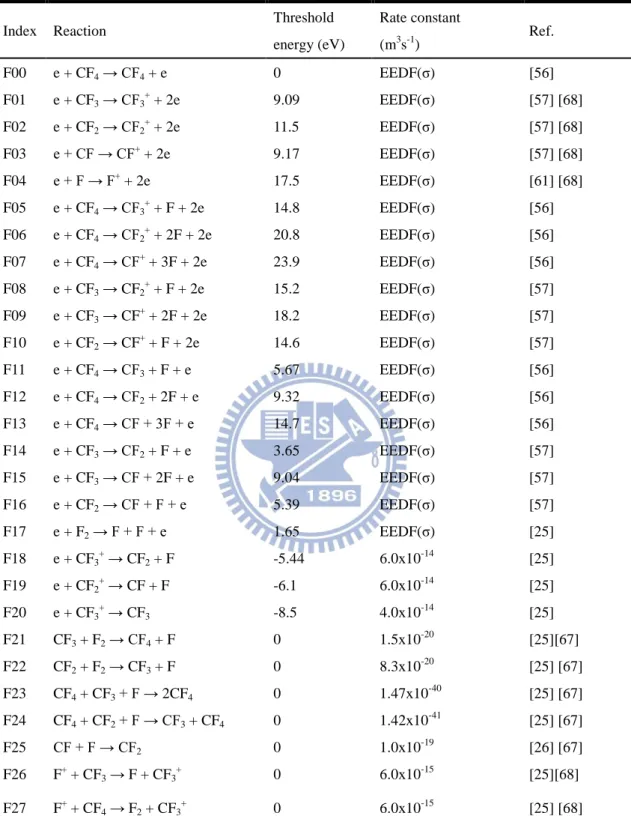
Table 4: Reactions of electron-impact with CFx (x=1~4) and relative gas-phase
reactions. ... 100
Table 5: Reactions including negative charge F-. ... 101
Table 6: Electron-impact reaction for corresponding oxygen-contain species. .. 102
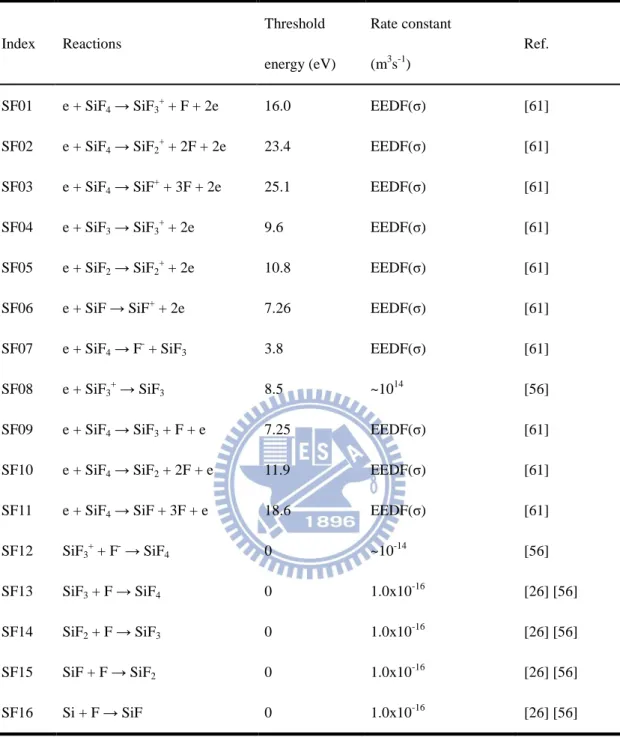
Table 7: Electron-impact and gas-phase reactions for etching products SiFx. ... 104
Table 8: Reactions of etching processes on SiO2 substrate in CF4 discharge... 105
Table 9: Wall sticking reactions on the metal surface. ... 107
Table 10: A list of conditions studied by Fukumoto et al. [26]. ... 109
Table 11: The consuming time for testing parallel efficiency under a condition of
~700,000 unknown in 2000 time steps. ... 109
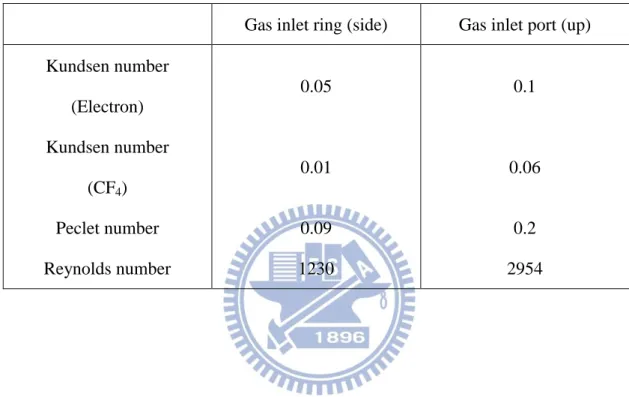
Table 12: The estimate of Reynolds number, Peclet number and Kundsen
XV
LIST OF FIGURES
Figure 1: Schematic of inductively driven sources with coil type of cylindrical. 111
Figure 2: Schematic of inductively driven sources with coil type of planar. ... 111
Figure 3: Research framework of this thesis. ... 112
Figure 4: Structure of our developed simulation tools ... 113
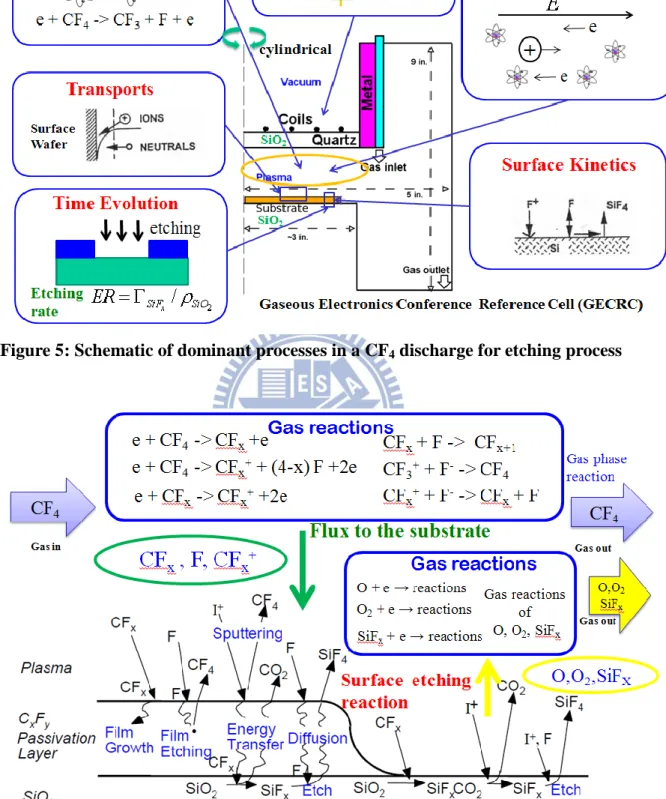
Figure 5: Schematic of dominant processes in a CF4 discharge for etching process
... 114
Figure 6: Summary of CF4 gas-phase reactions and surface reactions ... 114
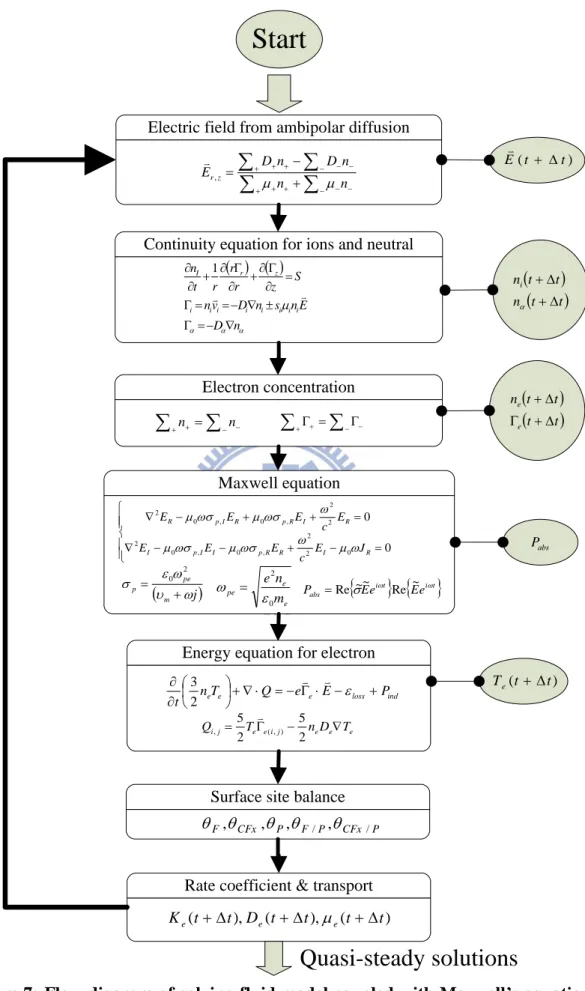
Figure 7: Flow diagram of solving fluid model coupled with Maxwell’s equation
and surface kinetic model ... 115
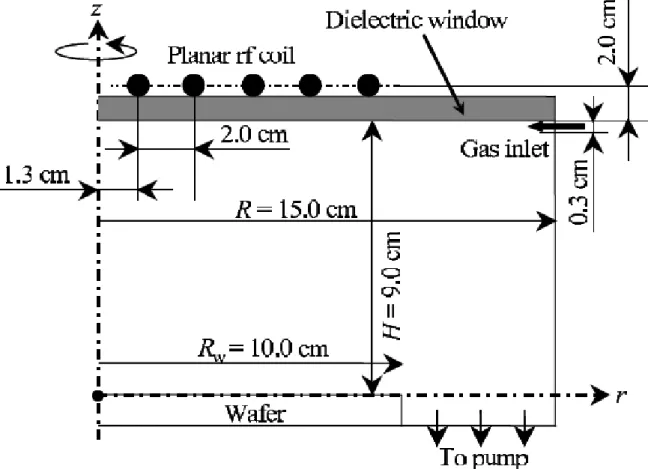
Figure 8: Schematic of the typical ICP reactor was applied in CF4 plasma by H.
Fukumoto et al. [26]. ... 116
Figure 9: Chemical compositions of charged species averaged over the entire region of the reactor chamber in three cases of ‘a wafer’, ‘no wafer’ and ‘no etching’ [26]. ... 117 Figure 10: Mass spectrum done by Fukumoto et al. [74] for ICP CF4 plasmas at a
pressure of 20 mTorr, and an ICP power of 280 W. ... 118
Figure 11: Two-dimensional distributions of CF4 density (a) done by Fukumoto et
al. [26] (b) our validation under the standard conditions: a gas pressure of
10mTorr, a feedstock CF4 flow rate of 200 sccm, a total power deposition of
250W and an ion bombardment energy of 100 eV on substrate surfaces of
temperatureTs = 300 K. ... 119
Figure 12: Two-dimensional distributions of electron density (a) Fukumoto et al.
[26] (b) our simulating result under the standard conditions: a gas pressure of
XVI
250W and an ion bombardment energy of 100 eV on substrate surfaces of
temperatureTs = 300 K. ... 120
Figure 13: Two-dimensional distributions of Te (a) Fukumoto et al. [26] (b) our
simulating result under the standard conditions: a gas pressure of 10mTorr, a
feedstock CF4 flow rate of 200 sccm, a total power deposition of 250W and an
ion bombardment energy of 100 eV on substrate surfaces of temperatureTs = 300
K. ... 121
Figure 14: Two-dimensional distributions of F- density (a) Fukumoto et al. [26] (b)
our simulating result under the standard conditions: a gas pressure of 10mTorr,
a feedstock CF4 flow rate of 200 sccm, a total power deposition of 250W and an
ion bombardment energy of 100 eV on substrate surfaces of temperatureTs = 300
K. ... 122
Figure 15: Two-dimensional distributions of CF3+ density (a) Fukumoto et al. [26]
(b) our simulating result under the standard conditions: a gas pressure of
10mTorr, a feedstock CF4 flow rate of 200 sccm, a total power deposition of
250W and an ion bombardment energy of 100 eV on substrate surfaces of
temperatureTs = 300 K. ... 123
Figure 16: Results validation and comparison to the experiment by Fukumoto et
al. [26] via bar chart for chemical compositions of ion species averaged over the
entire region. ... 124
Figure 17: Increased speed and parallel efficiency as a function of processor with
preconditioners of ASM, Block Jacobi, SOR based on the matrix solver of
GMRES. ... 125
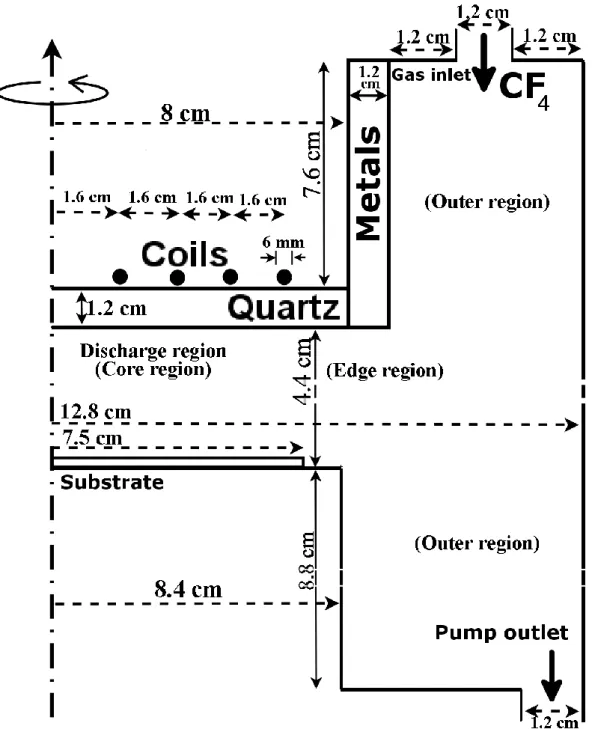
Figure 18: Schematics of the cylindrical gaseous electronics conference reference
XVII
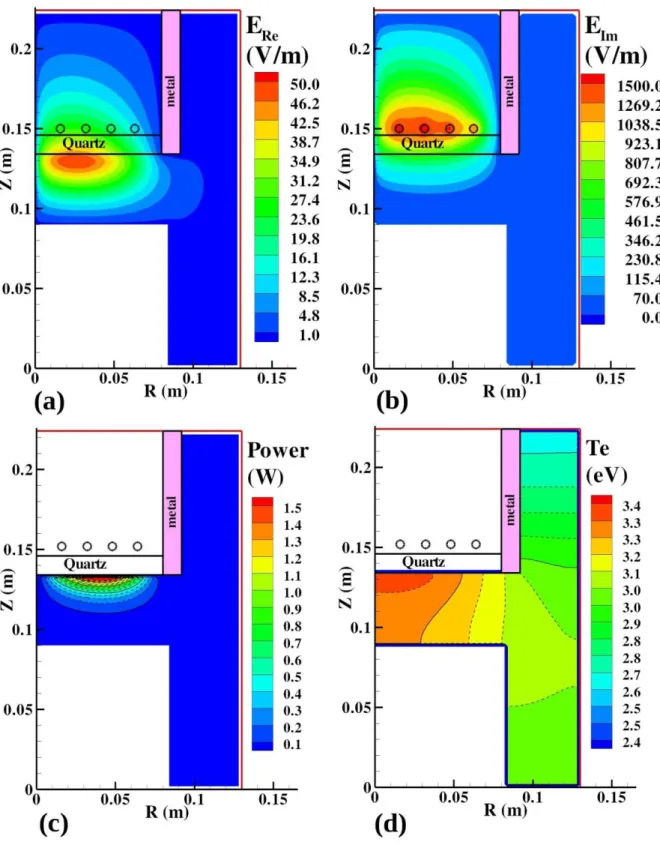
Figure 19: Two-dimensional contour of (a) the real part of the induced electric
field, (b) the imaginary part of the induced electric field, (c) the electron
temperature Te and (d) the power density at a power absorption of 150 W and a
pressure of 30 mTorr. ... 127
Figure 20: Two-dimensional contour of (a) the feeding gas CF4 in a unit of m-3 and
(b) the production rate for momentum transfer reaction (F00) in unit of m-3s-1 at a
power absorption of 150 W and a pressure of 30 mTorr. ... 128
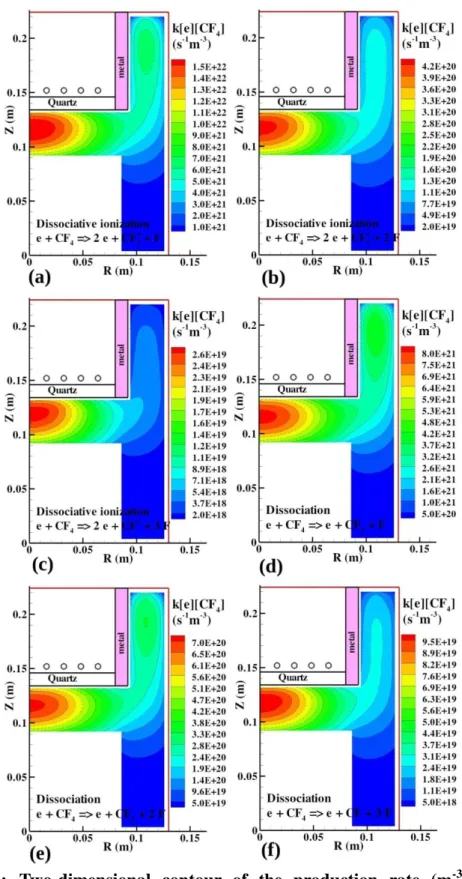
Figure 21: Two-dimensional contour of the production rate (m-3s-1) of (a)
dissociative ionization e + CF4 → CF3+ + F + 2e (F05), (b) dissociative ionization e
+ CF4 → CF2+ + 2F + 2e (F06), (c) dissociative ionization e + CF4 → CF+ + 3F + 2e
(F07), (d) dissociation e + CF4 → CF3 + F + e (F11), (e) dissociation e + CF4 → CF2
+ 2F + e (F12) and (f) dissociation e + CF4 → CF + 3F + e (F13) at a power
absorption of 150 W and a pressure of 30 mTorr. ... 129
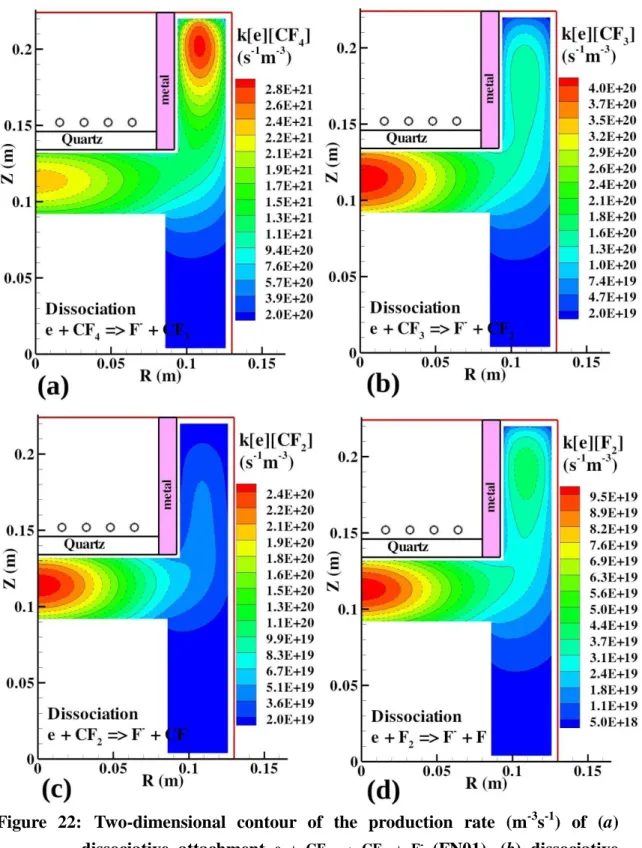
Figure 22: Two-dimensional contour of the production rate (m-3s-1) of (a)
dissociative attachment e + CF4 → CF3 + F- (FN01), (b) dissociative attachment e +
CF3 → CF2 + F- (FN02), (c) dissociative attachment e + CF2 → CF + F- (FN03) and
(d) dissociative attachment e + F2 → F + F- (FN04) at a power absorption of 150 W
and a pressure of 30 mTorr. ... 130
Figure 23: Two-dimensional contour of the (a) electron and (b) F- concentrations
at a power absorption of 150 W and a pressure of 30 mTorr. ... 131
Figure 24: Two-dimensional contour of the (a) F+, (b) CF+, (c) CF2+ and (d) CF3+
concentrations at a power absorption of 150 W and a pressure of 30 mTorr. .... 132
Figure 25: Two-dimensional contour of the (a) O+, (b) O2+ and (c) CO+
XVIII
Figure 26: Two-dimensional contour of the (a) SiF+, (b) SiF2+ and (c) SiF3+
concentrations at a power absorption of 150 W and a pressure of 30 mTorr. .... 133
Figure 27: Two-dimensional contour of the (a) F, (b) CF, (c) CF2 and (d) CF3
concentrations at a power absorption of 150 W and a pressure of 30 mTorr. .... 134
Figure 28: Two-dimensional Contour of (a) O, (b) O2, (c) O(1D) and (d) O2(a1g)
concentrations at a power absorption of 150 W and a pressure of 30 mTorr. .... 135
Figure 29: Two-dimensional contour of (a) COF, (b) COF2, (c) CO and (d) CO2
concentrations at a power absorption of 150 W and a pressure of 30 mTorr. .... 136
Figure 30: Two-dimensional contour of (a) Si, (b) SiF, (c) SiF2, (d) SiF3, (e) SiF4
and (f) F2 concentrations at a power absorption of 150 W and a pressure of 30
mTorr. ... 137
Figure 31: Chemical ingredients of charged species averaged over the core region
of the reactor chamber. ... 138
Figure 32: Chemical ingredients of neutral species averaged over the core region
of the reactor chamber. ... 139
Figure 33: Surface coverages as a function of radial distance on the substrate. 140
Figure 34: Etch rate, radical fluxes and CFx+ ion fluxes as functions of radial
distance on the substrate surface. ... 141
Figure 35: Schematics of the cylindrical dome-shaped reactor for etching SiO2.
... 142
Figure 36: Two-dimensional contour of (a) the real part of the induced electric
field, (b) the imaginary part of the induced electric field, (c) the electron
temperature Te and (d) the power density in dome-shaped reactor with a power
XIX
Figure 37: Two-dimensional contour of (a) the feeding gas CF4 in a unit of m-3 and
(b) the production rate for momentum transfer reaction (F00) in unit of m-3s-1
(dome-shaped reactor with a power of 200 W and a pressure of 20 mTorr) ... 144
Figure 38: Two-dimensional contour of the production rate (m-3s-1) of (a)
dissociative ionization e + CF4 → CF3+ + F + 2e (F05), (b) dissociative ionization e
+ CF4 → CF2+ + 2F + 2e (F06), (c) dissociative ionization e + CF4 → CF+ + 3F + 2e
(F07), (d) dissociation e + CF4 → CF3 + F + e (F11), (e) dissociation e + CF4 → CF2
+ 2F + e (F12) and (f) dissociation e + CF4 → CF + 3F + e (F13) in dome-shaped
reactor with a power absorption of 200 W and a pressure of 20 mTorr. ... 145
Figure 39: Two-dimensional contour of the production rate (m-3s-1) of (a)
dissociative attachment e + CF4 → CF3 + F- (FN01), (b) dissociative attachment e +
CF3 → CF2 + F- (FN02), (c) dissociative attachment e + CF2 → CF + F- (FN03) and
(d) dissociative attachment e + F2 → F + F- (FN04) at a power absorption of 150 W
and a pressure of 30 mTorr. ... 146
Figure 40: Two-dimensional contour of the production rate (m-3s-1) of (a)
ionization of oxygen atom (F05 e + O → O+ + 2e), (b) ionization of oxygen
molecule (F06 e + O2 → O2+ + 2e), (c) dissociation of oxygen molecule (F07 e + O2
→ 2O + e), (d) excitation of oxygen molecule (F11 e + O2 → O2 (a) + F + e), in
dome-shaped reactor with a power absorption of 200 W and a pressure of 20
mTorr. ... 147
Figure 41 Two-dimensional contour of the (a) electron, (b) F- and (c) O
-concentrations in dome-shaped with a power absorption of 200 W and a pressure
of 20 mTorr. ... 148
Figure 42: Two-dimensional contour of the (a) F+, (b) CF+, (c) CF2+ and (d) CF3+
XX
Figure 43: Two-dimensional contour of the (a) O+, (b) O2+ and (c) CO+
concentrations at a power absorption of 150 W and a pressure of 30 mTorr. .... 149
Figure 44: Two-dimensional contour of the (a) SiF+, (b) SiF2+ and (c) SiF3+
concentrations in dome-shaped reactor with a power absorption of 200 W and a
pressure of 20 mTorr. ... 149
Figure 45: Two-dimensional contour of the (a) F, (b) CF, (c) CF2 and (d) CF3
concentrations in dome-shaped reactor with a power absorption of 200 W and a
pressure of 20 mTorr. ... 150
Figure 46: Two-dimensional Contour of (a) O, (b) O2, (c) O(1D) and (d) O2(a1g)
concentrations at a power absorption of 150 W and a pressure of 30 mTorr. .... 151
Figure 47: Two-dimensional contour of (a) COF, (b) COF2, (c) CO and (d) CO2
concentrations in dome-shaped reactor with a power absorption of 200 W and a
pressure of 20 mTorr. ... 152
Figure 48: Two-dimensional contour of (a) Si, (b) SiF, (c) SiF2, (d) SiF3, (e) SiF4
and (f) F2 concentrations in the dome-shaped with a power absorption of 200 W
and a pressure of 20 mTorr. ... 153
Figure 49: Chemical ingredients of charged species averaged over the entire
reactor chamber. ... 154
Figure 50: Chemical ingredients of neutral species averaged over the entire
reactor chamber. ... 155
Figure 51: Surface coverages as a function of radial distance on the substrate in
dome-shaped reactor. ... 156
Figure 52: Etch rate, radical fluxes and CFx+ ion fluxes as functions of radial
XXI
Figure 53: The geometries of CF4 ICP reactors for etching SiO2, coil
configurations, and configuration of gas inlet position considered in this paper. (a)
gas inlet ring beside typical cylindrical ICP chamber with planar coils, (b) gas
inlet ring beside typical cylindrical ICP chamber with cylindrical coils (side), (C)
gas inlet port upon typical cylindrical ICP chamber with cylindrical coils (side), (d)
gas inlet port upon dome-shaped ICP reactor of elliptic roof, (e) gas inlet port
upon dome-shaped ICP reactor of spherical roof, (f) gas inlet ring beside
dome-shaped ICP reactor of elliptic roof, and (g) gas inlet ring beside
dome-shaped ICP reactor of spherical roof. ... 158
Figure 54: The schematic of typical cylindrical reactor with top coils and beside
gas inlet ring. ... 159
Figure 55: The schematic of typical cylindrical reactor with cylindrical (side) coils
and with side or top gas inlet ring. ... 159
Figure 56: The schematic of dome-shaped reactor (elliptic) with top coil and with
side or top gas inlet ring. ... 160
Figure 57: The schematic of dome-shaped reactor (spherical) with top coil and
with side or top gas inlet ring. ... 160
Figure 58: Two-dimensional contour of electron densities (m-3) at a power
absorption of 200 W and a pressure of 20 mTorr. ... 161
Figure 59: Two-dimensional contour of CF3+ densities (m-3) at a power absorption
of 200 W and a pressure of 20 mTorr. ... 161
Figure 60: Two-dimensional contour of electron temperature (eV) at a power
absorption of 200 W and a pressure of 20 mTorr. ... 162
Figure 61: Two-dimensional contour of feedstock gas CF4 densities (m-3) at a flow
XXII
Figure 62: Two-dimensional contour of production rate (dissociative ionization) at
a power absorption of 200 W and a pressure of 20 mTorr. ... 163
Figure 63: CF3+ fluxes as a function of radial distance on the SiO2 substrate. .. 164
Figure 64: F fluxes as a function of radial distance on the SiO2 substrate. ... 164
Figure 65: Surface coverages as a function of radial distance on the substrate. 165
XXIII
NOMENCLATURE
A area (m2)
B magnetic field
c velocity of light in vacuum d denotes an exact differential
d distance(m)
D diffusion coefficient (m2/s)
e or q unsigned charge on an electron (1.602×10⁻¹⁹ C) E electric field (V/m) f frequency (Hz) i imaginary integer 1 I current (A) k Boltzmann constant 1.3811023J /K e m electron mass 9.11×10⁻³¹ Kg i m ion mass n density p pressure
Power power absorption
t time (s) e T electron temperature n i e
flux of electron, ion and neutral
denotes the change of a quantity
mobility (m2
XXIV
m
collision frequency of momentum transfer
cross section; electrical conductivity
electric potential ; azimuthal angle
pe
electron plasma frequency
RF
1
CHAPTER 1
INTRODUCTION
1.1 Background and Motivation
Plasmas which are ionized gases also known as discharge consist of positive ion, negative ion, electron and neutral species. In generally, plasma is treated as the fourth state of matter since sufficiently heating of a gas could give sufficient energy to ionize gas turning the gas into plasma. Plasmas are the most common phase state of matter in the universe, and they can be found from stars, interstellar matters to earth. According to ionization degree, plasmas can be divided from fully ionized gas (100%), such as stars, solar and fusion, to partially ionized gases (10-4~10-6), such as aurora, flames, and artificial plasmas. While generation of artificial plasmas via heating is very difficult to handle, it could be generated easily via electromagnetic wave in our daily lives as well as in industry. Artificial plasma generated in the laboratory and industry can be generally categorized by many aspects which include the type of power sources (DC, RF and microwave), operating pressure, temperature (thermal plasma Te=Ti and low-temperature non-equilbirium plasma Te >> Ti), and application (light
emission, material etching and material deposition, to name a few). The major fields of application may include: plasma processing, thin film deposition, plasma spray and bulk materials work, display systems, environmental and health applications, switches, relays, focus, antennas and power systems [1][3].
For the past three decades, the applications of glow discharge for manufacturing integrated circuit (IC) have increased tremendously in semiconductor industry, such as etching and deposition. These plasmas are often operated at low pressure because
2
of easier gas breakdown under this condition. Some low-pressure and high-density plasma sources had been invented in the semiconductor industry. These may include: capacitively coupled plasma (CCP), helicon discharge, electron cyclotron resonance (ECR), ion cyclotron resonance (ICR), and inductively coupled plasma sources (ICPs). In particular, among these high density plasma sources, inductively coupled plasma sources have been playing an important role in etching and nano-material deposition because of its advantages, such as high plasma density, controllable energetic ions, and potential of generating chemically active radical species [1][3][4][6]. The feed gases for ICPs’ etching process are usually noble gases (He, Ne, Ar, Kr and so on) and halogen gases (Cl2, CF4, HBr and so on) in which fluorocarbon (CF4) is generally
encountered plasma etching of dielectrics in semiconductor fabrication. Such etching processes of dielectric usually damage and charge Si or SiO2 contact layer; therefore,
understanding of how etching rates and selectivity of SiO2, caused by such a plasma,
vary under different conditions are extremely important for a better etching of new devices [1][7][8].
Development of processing equipment for plasma etching had been accomplished mostly by trial-and-error approach; however, it was found that this approach was often time-consuming and very costly as the etching reactors become more complicated. It is generally difficult and very expensive to directly measure plasma properties within an ICP chamber. Due to the advancement of modern computer technology and numerical schemes, plasma modeling becomes an invaluable tool for understanding complex plasma physics and chemistry in ICP etching process. Indeed, plasma modeling for a realistic discharge system with complicated plasma chemistry (gas-phase and surface) and a large reactor size is often very time-consuming. [1][8][9]. Fortunately, parallel computation can efficiently
3
reduce the computational time [10], although there have been very few reports in this regard in the community [79]. Thus, it is important to develop and validate a parallel computational tool which can simulate the complex etching process of any ICP source considering realistic plasma physics and chemistry.
1.2 Overview of Low-Pressure Non-Equilibrium Plasma
Sources
The common features of low-pressure non-equilibrium plasma sources include operations under low-pressure environment for easier gas breakdown (lower voltage) and different kinetic temperatures among different species (electron’s temperature >> ion’s temperater neutral’s temperature). In general, the electron temperature is in the range of 1-10 eV, while the temperatures of ions and neutrals are not far from the room temperature. For polyatomic gas discharge, energy relaxation of rotational and vibrational temperatures is also impotant in maintaining the discgarge. For a glow discharge confined in a bounded space, there exists a large quasi-neutral region in the central part of the space with thin sheath regions closed the bounded walls. Because of frequent electron collision with neutral species, electronic excitations of neutral species and light emission due to de-excitation of electrons are very common in a glow discharge.
In this section, various kinds of low-pressure non-equilibrium plasma sources often found in semiconductor fabrication industry and especially the inductively coupled plasma source will be introduced.
4
1.2.1 Classification of Low-Pressure Gas Discharges in
Semiconductor Fabrication
Several commonly seen low-pressure plasma sources, incuding direct current plasma (DCP), capacitively coupled plasma (CCP), electron cyclotron resonance (ECR), inductively coupled plasma (ICP) [1][3][4][5][6], are introduced in turn next.
1.2.1.1 Direct Current Plasma (DCP)
The direct current plasma is the simplest laboratory discharge, but it provides the basic understanding of fundamental discharge phenomena for other more complex discharges. When a sufficiently high electric field is applied between two electrodes placed in a gas, gas breaks down into positive ions and electrons, which is so-called gas discharge. The mechanism of gas breakdown in a DC plasma can be explained briefly as follows. First, a few electrons exist naturally in the universe and emitted from the electrodes due to the cosmic radiation from space. When a voltage is applied on an electrode, the electrons are accelerated by the electric field near the electrode and collide with the gas for exchanging energy and momentum. The most important collisions are the inelastic collisions that lead to excitation and ionization of neutral molecules. The excitation collisions, followed by de-excitations with the emission of radiation, are responsible for the terminology, glow discharge. The ionization collisions generate new electrons and ions. The ions are accelerated by the electric field toward the cathode, where they release new electrons due to ion or neutral bombardment, which is the so-called secondary electron emission. The electrons are accelerated in the sheath near the cathode, giving rise to new ionization collisions that generate new ions and electrons. These processes of secondary electron emission at the cathode and ionization in the plasma bulk make the glow discharge a
5
self-sustaining plasma. DC plasma with addition of magnetic field near the cathode (e.g., permanent magnet) can be used to deposit the material substrate as the anode using the sputtered atom which releases from material placed on the cathode. Nevertheses, it is seldom to apply DC plasma directly in industry. The reasons are described as follows. Firstly, the cathode is easily eroded by the ion bombardment which often releases metal material that is undesirable in materials processing. Secondly, although operated in low-pressure environment, the gap voltage often has to increase to several kVs for an acceptable plasma density for several practical applications. When a time-varying voltage is applied, the role of the electrodes becomes less important because electrons can oscillate in the plasma between the two electrodes. This is the so-called capacitively coupled discharge which is introduced next.
1.2.1.2 Capacitively Coupled Plasma (CCP)
As one of the electrodes of DC plasma is applied by an alternating voltage and the other grounded, each electrode acts alternately as either the cathode or anode, which is a typical capacitively coupled plasma (CCP). In a typical CCP, probability of heavy charged particles bombarding to the electrodes becomes low since they cannot respond quickly enough to the high-frequency oscillation of electric field. If one or both of the electrodes are non-conducting materials the charge accurmulated on electrodes will be partially neutralized by the opposite charge accumulated during the other half cycle. However, the frequency should be high enough so that half the period of the alternating voltage is less than the time during which the insulator would be charged up and bombarded. Otherwise, there will be a series of short-lived
6
discharges with the electrodes successively taking opposite polarities instead of a quasi-continuous discharge.
The frequencies generally used for these alternating voltages are typically in the radiofrequency (rf) range (100 kHz ~ 100MHz). The term “capacitively coupled” refers to the way of coupling the input power into the discharge, and the sheaths near two electrodes form one kind of capacitor. The electrons may have obtained energy from the oscillating electric field by the so-called Ohmic heating, and stochastic heating especially in low-pressure environment. Additionally, heating of the electrons can also be realized in the bulk plasma, when the bulk electric field is significant. This happens in the case of electronegative gases where radial losses due to ambipolar diffusion to the walls are important. However, for plasma processing applications, plasma density and mean free path of particles in a typical CCP are relatively low, which is not favored in etching process. In recent years, there have been new ideas by adding another lower frequency power source, named as dual-freqency CCP [80], for a better control of bombarding flux and energy of ions, which is used for etching purpose.
1.2.1.3 Electron Cyclotron Resonance Plasma (ECR)
Electron cyclotron resonance (ECR) plasma is generated from the interaction between an electric field at microwave frequency and a superimposed magnetic field, in which the electrons are in resonance with the microwave field. A characteristic feature of microwave is that the wavelength of power source (2.45 GHz) is comparable to the dimension of the plasma apparatus. ECR reactor consists essentially of two parts: a resonance region and a process region (with the surface to be treated). The plasma flows along the magnetic field lines from the resonance
7
region into the process region, where energetic ions and free radicals from the plasma can bombard the surface. When a magnetic field B is applied, the charged particles are confined and gyrating around the magnetic field lines with an angular cyclotron frequency that is a function of local magnetic field. When the cyclotron frequency is in resonance with the 2.45 GHz, very high power absorption by the electrons can be expected. This would lead to a high-density plasma generated in the chamber.
While the goals of high rates and low damage have been required in semiconductory fabrication industry, there are some disadvantages of the ECR technology. Firstly, the ECR resonance can lead to "mode hopping". Real wide-range fully automatic tuning of the microwave energy is difficult or impossible. It is very expensive to scale the technology up to large wafer sizes. Operation outside the resonance (at pressures > 2 mtorr) can lead to microwave energy transferring to the wafer [1][5][6].
A much simpler processing technology such as "Inductively Coupled Plasma" can possibly address all of the above problems. Today many major suppliers of plasma equipment utilize the ICP or similar technologies for high rate and low damage etch applications. The description of inductively coupled plasma will be introduced next.
1.2.1.4 Inductively Coupled Plasma (ICP)
In the inductively coupled plasma source, as shown in Figure 1 and Figure 2, the plasma chamber is surrounded by a high-frequency oscillating current coil. Simply speaking, the rf current in the coil generates an rf magnetic flux, which penetrates into the plasma region. According to Faraday's law, time-varying magnetic flux density
8
induces an azimuthal rf electric field, which accelerates the free electrons and sustains the discharge.
Inductively coupled plasma sources have the same required advantages, including the simplicity, no requirement for D.C. magnetic field, and operated in RF range rather than in microwave range. In contrast to ECRs, which can be configured to achieve plasma density no ≥1019 m−3, inductively coupled discharges may have
density limit, no ≤ 1019 m−3, for an efficient power transfer to the plasma. However,
the practical plasma density, 1017≤no≤1018 m−3, for an efficient inductive discharge
operation, is still typically 10 times higher than that of a capacitive RF discharge in the same pressure range (∼1 Pa).
Major advantanges of ICP sources can be summarized as follows:
[1][3][4][5][6]:
1. High etch rates are achieved by high ion density (>1017 m-3) and high radical density.
2. Control over selectivity and damage is achieved by lowering ion energy. 3. Separate control over ICP and electrode RF provides high process flexibility. 4. ICP source has combined effect of chemical and ion-induced etching.
5. ICP can be used for deposition in ICP-CVD mode, offering very dense films at lower temperature than PECVD and lower damage deposition onto temperature sensitive substrates.
1.2.2 Some Fundamentals of Plasma Physics
Plasma is loosely described as an electrically neutral medium of positive and negative particles (i.e., quasi-neutral). It is important to note that although these charged particles are unbound, but they are not totally free. When the charges move,
9
they generate electrical currents with magnetic fields, and as a result, they are affected by each other’s fields. This governs their collective behavior with many degrees of freedom. A definition of plasma could have three criteria: the plasma approximation, bulk interaction, and plasma frequency [2].
The first criterion is plasma approximation. Charged particles must be close enough together that each particle influences many nearby charged particles, rather than just interacting with the closest particle. The plasma approximation is valid when the number of charge carriers within the sphere of influence of a particular particle is higher than unity to demonstrate collective behavior of the charged particles. This sphere is often called the Debye sphere whose radius is the Debye screening length.
The second criterion is bulk interaction. The Debye screening length is short compared to the physical size of the plasma. This criterion means that interactions in the bulk of the plasma are more important than those at its edges, where boundary effects may take place. When this criterion is satisfied, the plasma is quasi-neutral.
The third criterion is plasma frequency. The electron plasma frequency is large enough as compared to the electron-neutral collision frequency. When this condition is valid, electrostatic interactions dominate over the processes of ordinary gas kinetics. Briefly, collision frequency must be so sufficient that kinetic and statistical theory is valid.
In the following, some fundamentals of of plasma physics, including sheath, Debye length, Bohm velocity and plasma frequency, are described in turn next.
1.2.2.1 Debye Length
Debye length is the distance scale over which mobile charge particles screen out electric fields in plasmas and other conductors. In other words, the Debye length is the
10
distance over which significant charge separation can occur. A Debye sphere is a volume whose radius is the Debye length, in which there is a sphere of influence, and outside of which charges are screened. Debye length is expressed as [2][3][4][5]:
g e De qn T 0 (1.1)
where 0is the permittivity of free space, Teis the electron temperature in eV, q is
the elementary charge, and ngis the background gas density. Overally speaking, it is
a measure of the shielding distance or thickness of the sheath.
1.2.2.2 Plasma Sheath
The sheath is generated by the interaction of the plasma with the boundary material. As positive charges and electron diffuse thermally to wall, the sheath is formed that is caused by the velocity of electron is much larger than the velocity of positive ions. Physically this means that the electron density must be always less than the ion density in the sheath region. The function of a sheath is to form a potential barrier so that the more mobile electrons are confined electrostatically in the bulk. The height of the barrier adjusts itself so that the flux of electrons that have enough energy to overcome the barrier to the wall is just equal to the flux of positive ions reaching the wall.
1.2.2.3 Bohm Velocity
As the ions enter the sheath, they are accelerated by the large electric field and their density must decrease to maintain a constant flux. If this decrease is too fast, the ion density will fall off well before the electrons (which diffuse a bit into the region of positive potential) vanish, leading to a net negative charge, which would then increase the ion velocity. The stable solution must occur when the ions entering the sheath
11
have enough initial velocity to ensure that the sheath remains positive charged. The sheath can exist only if the initial ion velocity exceeds the critical condition at the presheath position, which is called Bohm sheath criterion. In the presheath region, a weak electric field penetrating into the plasma near the sheath edge, which accelerates the ions as they enter the "main" sheath. The initial velocity at the preshaeth position which could allow ion transport from the plasma bulk into the main sheath is known as Bohm velocity [3][4]:
M qT u
us B e (1.2)
where us is ion velocity, uB is Bohm velocity and M is ion’s mass. It only depends on
electron temperature and mass of ion.
1.2.2.4 Plasma Oscillations (plasma frequency)
An important property of plasma is the time scale for plasma oscillations to occur. Plasma oscillations, also known as “plasma frequency” and “Langmuir frequency”, are rapid oscillations of the electrons in conducting media such as plasmas or metals. The oscillations can be described as instability in the dielectric function of a free electron gas. In other words, under assumption of quasi-neutral plasma, if an electron is moved from its equilibrium position, the resulting positive charge exerts an electrostatic attraction on the electron, causing the electron to oscillate about its equilibrium position. Because the interaction between electrons is strong, they all oscillate together at a characteristic frequency that depends on the nature of the particular plasma. Electron plasma frequency is shown as [2][3][4]:
e pe m n q 0 0 2 (1.3)
12
where pe is plasma frequency, 0is permittivity of vacuum, and me is electron
mass. The electron plasma frequency is the fundamental characteristic frequency of plasma that determines the time scale of a plasma response to external electric perturbations.
1.2.3 Classification of Plasma Chemistry
A major part of any plasma modeling is the description of the chemical reactions occurring in the gas phase and at surfaces in the plasma reactor. This description consists of a set of reaction paths with kinetic rate parameters for each reaction. For a low-pressure plasma process, the gas-phase reaction mechanism typically comprises a large set of electron-impact collisions as well as fast reactions between neutral radicals, ion-neutral reactions and ion-ion reaction. According to kinetic theory, the elementary processes can be expressed by some collision parameters such as cross section, reaction rate coefficient and collisional frequency where the transport coefficients and the rate constants related to electron are calculated by solving the Boltzmann equation [3][4]. For the current study, we consider a relatively complex set of plasma chemistry involving CF4 gas, which will be presented in CHAPTER 2.
Several important types of plasma chemistry often seen in gas discharges are described briefly for completeness in the following in turn .
1.2.3.1 Electron-Impact Reactions
Electron-impact reactions are by far the most important type of gas-phase reaction. Thus, mechanism development begins with the compilation of available electron-impact cross sections, starting with electrons impacting the atoms and molecules. There are a multitude of possible electron-impact excitation processes that
13
can occur for any target atom or molecule, but the mechanism development must focus on those collisions that are most likely to affect etching and deposition processes.
Plasma-enhanced etching and deposition chemistry depends on the kinds and impact fluxes of ions and radicals from the plasma bulk to the wafer surface. Therefore, processes such as ionization, excitation leading to dissociation, and dissociative ionization are of primnary importance. Moreover, a more complicated molecule would naturally have a number of paths such as dissociation and dissociative ionization. Many of the process gases typically used for materials processing applications also have electronegative properties where the amount of negative charges are sometimes comparable to that of electrons, so that electron attachment, dissociative attachment, and detachment reactions also need to be considered in the modeling.
Excitation of molecules resulting from electron impact need to be considered because the mean electron energy that drives ionization and dissociation processes is determined from a balance between the plasma power source and collisional energy losses. Hence, all processes that lead to significant energy loss of the electrons need to be considered. Typically, the data for electronic excitation to the lowest few excited states that sometimes refer to metastable excitation should be also included for a proper modeling, but not all the higher excited states.
1.2.3.2 Ion Related Reactions
Ion-neutral and ion-ion reactions often play a significant role in the plasma chemistry. In addition, mutual neutralization between positive and negative ions is an important loss process for ions in an electronegative discharge, and may also result in
14
atom transfer or molecular re-arrangements. A high density of negative ions in an electronegative discharge may also lead to appreciable electron detachment processes.
In general, the dominant positive ion in the discharge is expected to be related to the molecule or atom with the lowest ionization potential, provided the corresponding neutral is of sufficient abundance in the plasma. Charge-exchange reactions also provide a route for energy exchange between the ion and the neutral species. If the difference in ionization potential between two species is large, enough energy may be released by the charge transfer that may cause dissociation.
1.2.3.3 Neutral Related Reactions
Electron-impact reactions can generate a large amount of different radical species that participate in the etching or deposition processes at the wafer. In addition to surface reactions, these neutral species may react in the gas phase. Although radical recombination reactions are important, they often require stabilization by collision with a third body. It is sometimes reasonable to neglect these reactions entirely in a high-density plasma due to the very low-pressure environment. However, in some plasma such as SiH4, the neutral reactions which form several large clustering species
have to be considered.
1.3 Overview of Inductively Coupled Plasma Source (ICPs)
Inductively coupled plasma sources (ICPs) have been using frequently in semiconductor fabrication industry to produce high-density plasma for materials processing such as etching and deposition. The ICP source is the simplest type of high-density plasma source because it does not require an external magnetic field like ECR. The plasma in an ICP source is produced by radio frequency (RF) coils parallel
15
to the plasma source. The RF coils are separated from the plasma by a dielectric wall, and the discharge is typically operated with the frequency in the range of 1~40 MHz. The dielectric wall is part of the vacuum barrier and may be flat, domed, or cylindrical. Radio frequency currents in ICP coils induce opposing electric field (RF currents) in the plasma, which are concentrated primarily within a skin depth of the plasma surface, generally a few centimeters. The plasma thus acts as the secondary transformer with the ICP coils as the primary one.
The RF current in the plasma is carried primarily by electrons which rapidly transfer power to the plasma by frequent electron-neutral collision. High voltages on electrodes are not required in an ICP source, which leads to a very low plasma potential and low loss of charged particles to the wall. For example, the high plasma density produced in ICP sources, typically > 1017 m-3, which implies that the substrate sheath is relatively thin and fewer ion scatterings in the sheath as compared to capacitive coupled plasma sources because the debye length is relatively low [1][6].
Figure 1 and Figure 2 show the typical reactors of ICP with planar and cylindrical types of coil. In general, an ICP source consists of inductive coils, plasma chamber, RF generator, quartz window, match network and pumping system. Substrate hosting a wafer is often located at the bottom. Moreover, a dc voltage could be applied to the substrate for controlling the processing condition. A radio frequency (RF) current generator produces an oscillating current in an induction coil that is arranged around the chamber. The induction coil creates an oscillating magnetic field which produces an oscillating electric field being vertical to magnetic field according to the Maxwell’s equations. The induced electric field alternately induces an oscillating current that is generated by the ions and electrons in the plasma. However, the magnitude of electromagnetic field, which transfers energy for electron to react
16
ionization, is relatively low if ICPs is operated in high presuree. Therefore, nonthermal ICP plasma discharges are usually operated at low pressure to make mean free path of electoron long enough to obtain sufficient energy and to make high electron conductivity to transfer the energy from skin depth to plasma bulk. From the viewpoint of an equivalent circuit, the characteristics between the inductive coil and plasma can be interpreted as a transformer. For an effective coupling of the plasma with the RF power supply, it requires a low plasma resistance. Thus, when ICPs are in a gas-discharge state, they are convenient to reach high currents, high electric conductivity and high electron density at relatively low electric field and voltage. The principle of heating plasma in an ICPs is related to electromagnetic field according to the Maxwell’s equations,
t D t E t E J B total 0 0 1 (1.4)where B is inductive magnetic field, Jtotal is total current density and 0is permeability of free space. The time-dependent current in the azimuthal direction induces time-dependent magnetic field in the r and z direction. We can calculate the time-dependent induced electric field in θ direction generated by the time-dependent magnetic field in term of Faraday’s Law as
t B E (1.5)
Time-dependent induced electric field in the azimuthal direction can be applied to accelerate electrons leading to more energetic electrons to sustain the discharge. It has to be noted that power transferred from the electric field to the plasma is within a skin depth layer. The conductivity, wave, skin depth and Ohmic heating (power absorption) of ICP will be described in the following [3].
17
1.3.1 Dielectric Constant and Conductivity
Electron and ions in the plasma respond differently to an oscillating electric field because of the very large difference of masses between them. It can be shown that plasma acts like a dielectric medium in the range of GHz frequency. The plasma permittivity or dielectric constant is derived by combining the Maxwell’s equations with the equation of motion. We can obtain an effective plasma dielectric constant as
[3]
j j p m pe p 0 2 0 1 (1.6)where p is the plasma conductivity and it can be written as
m pe p j 2 0 (1.7)
where pe is plasma frequency, is frequency of applied current, and m is
collisional frequency. At a lower frequency (pe) or in a low presuree (lower
collisional frequency), p is relatively high to act plasma like a good conductor.
1.3.2 Wave and Skin Depth in ICPs
Because plasma usually acts like a good conductor, the EM wave can only penetrate into distance within skin depth. To understand mechanism more, we start from wave propagation. The electric and magnetic fields of a RF EM wave, oscillating transverse to the direction of propagation x, have a spatial dependence given by E(x) ~ E0 exp(jkx), where k 0/cis the propagation constant and c is the speed of light. For a low-frequency RF field, where peand 0 is imaginary, the electric field