Social Network Analysis for Opto-electronics Industry
of Southern Taiwan Science Park
Chihyen Huang
1, Ting Lin Lee
21Department of Land Management Feng Chia University, Taichung 407 Taiwan
2Department of Asia-Pacific Industrial and Business Management, National University of Kaohsiung, Kaohsiung 811, Taiwan Abstract—Thanks to governments’ policy planning, “North
(Shin-Chu Science Park, SCSP) IC, South (Southern Taiwan Science Park, STSP) Opto-electronics,” engines in the high-tech
industry have been fuelled by two major focuses and each of them locates in different Parks. Obviously, each industry has developed an industry network along with its cluster in the Park. In order to understand relationships among optic-electronic corporations in the STSP, Social Network Analysis (SNA) approach is used in the research. The study classifies network data into four groups, including basic, business, financial, and external interaction networks. The outcomes will show the relationship among those corporations in many perspectives such as actors, resources, financial flows, and interactions, etc. The study will therefore explain how people and corporations in the same industry would interact with each other and further create lots of outputs and performances.
I. INTRODUCTION
With the IC industry getting mature in Taiwan, the next popular industry has already come around the corner. It is opto-electronic industry. According to the data from OESL (Opto-Electronic & Systems Laboratories, ITRI), the total amount of optic-electronic industry in the world is expected growing from $191 hundred million dollars in 2002 to $413 hundred million dollars in 2006. It may bring astonishing economic values to many countries. The opto-electronic industry contains the enormous business opportunity. According to OESL’s report, the total value of the global opto-electronic industry grows up from 2,367 hundred million dollars in 2001 to 3,597 hundred million dollars in 2005.
Since the IC industry in Taiwan developing maturely into the 21st century, next emerging high-tech industry in
Taiwan has already come around the corner, that is “opto-electronics industry.” State’s technology policies, “North (Shin-Chu Science Park, SCSP) IC, South (Southern Taiwan Science Park, STSP) Opto-electronics,” have settled two focuses in different locations. Obviously, each industry has developed an industry network along with its cluster in the Park. The STSP, for example, homed by more than 40 opto-electronics corporations. The total revenue in the STSP has reached $1,500 hundred million in 2003. Opto-electronics industry, particularly, has already taken above 62% in the STSP. Sales revenue for opto-electronics industry was NT$897.2 million in 2003, an increase of 71.4 % over 2002. Corporations in the industry has benefited from the policy, and part of economic gains coming from the cluster in the Park.
In order to understand relationships among optic-electronic corporations in the STSP, Social Network
Analysis (SNA) approach is used in the research. This study seeks to explore relationship networks of opto-electronics industry in STSP, teases out the prominent patterns in such networks, traces the flow of information (and other resources) through them, and discovers what effects these relations and networks do to people, organizations and its performance. The results will reveal the process of production/business activities of opto-electronics industry in the STSP. In addition, what kind of inter-dynamic relationships existed among firms located in the STSP and how the relationships affect the business performance will be examined in this study. Furthermore, this study is attempt to answer how to recognize and confirm the core position of firms through the analysis of social network, and how governments take advantages of this core firm to assist policy support and implementation.
The focus of this study is on the modelling of entrepreneurial networks arising from questionnaire and expert surveys taken from the fieldwork. Three issues stand out as problematic. First, to explore what kind of relationships of cooperation network among opto-electronic firms located in the STSP. In general, by examining the pattern of relationships among firms, groups emerge as highly interconnected sets of actors known as cliques and clusters. In other words, a group is an empirically discovered structure. We can also find who belong to a group, as well as the types and patterns of relations that define and sustain such a group. The second issue is which firm/firms might stand at the core positions of opto-electronics networks in the STSP. Position analysis, will be examined in this study. The central positions who share empirically-identified positions are likely to share similar access to informational resources and have greater access to diverse sources of information, while other positions may have a limited pool of new ideas or information in which to draw. Besides, by means of blockmodeling, it can partition social network actors while simultaneously taking into account role relationships such as giving or receiving orders, socializing, collaborating, and giving or receiving information. Third, these networks and cooperation relationships may have impacts on the organizational performance. The indicators of organizational performance chose here include the number of patents, industrial revenues, market share, process technology capacity, sales revenue, R&D capacity, and productivity.
There are three research questions in the study. The first question is explored using a combination of approaches, in order to build an entrepreneurial social network model of the opto-electronics in the STSP. One input is derived from the primary data from the annual reports of firms. Another
input involves an inductive research strategy, based on questionnaire and experts survey to firms’ managers. The second research question based on the collected data from the first question will employ Social Network Analysis (SNA) combined with software UCINET VI, to carry out the analyses and explanations. In other words, after data coding and editing, a matrix table with relational data is merged into network software UCINET VI. In addition to analyze the relationships among firms, network data therefore are run by drawing software KrackPlot to present the networks.
II. OVERVIEW OF TAIWAN’S OPTO-ELECTRONICS INDUSTRY IN 2003-2004
Taiwan's opto-electronics industry kept pace with the trend of global growth in 2003. Total revenue for Taiwan's opto-electronics industry was NT$737.755 billion in 2003, an increase of 29% over 2002. Driven by rapid development in the optical display segment in 2004, it is estimated that total revenue will increase by 38% to NT$1 trillion. Revenue and growth rates in the industry for 2003 versus 2002 in the various segments are as follows. The optical information segment was the largest in the industry, with revenue of NT$374.386 billion, an increase of 24% over the previous year. Revenue for the optical display segment was NT$316.168 billion, an increase of 35% over 2002. This segment grew rapidly thanks to government and industry endeavors in the national “Two Trillion in Duel Stars” program. Despite low revenues, the opto-electronics component segment enjoyed the fastest growth in the industry.
This segment had revenue of NT$39.253 billion, an increase of 41%. The optical communication segment stagnated due to the global recession, with sales decreasing by 3% to NT$7.949 billion.
In 2003, total revenue of the optical storage segment was NT$237.471 billion. Despite Iraq War and the SARS epidemic, the optical storage segment revived quickly. The CD-ROM drive market, as well as CD-ROM, DVD-ROM, CD-RW and combo disk markets all stabilized. However, as major DVD-burner manufacturers increased product shipments, manufacturers began increasing production to replace VCRs with recordable DVD players at a faster pace. With home appliance manufacturers joining in the competition, large quantities were shipped by the Christmas holidays. Because of growing demand for blank CDs, prices continued to climb through the quarter. Despite falling prices for blank DVDs, manufacturers continued making investments to produce them due to their high profit margins. This drove revenues higher, resulting in a 26.76% increase in 2003 over 2002.
As far as the optical output segment is concerned, due to steady growth in orders received for inkjet printers and multipurpose office machines, revenue grew a modest 0.3%, or NT$24.2 billion in 2003. For the optical input segment, 2003 production values rose to NT$113.387 billion, a 25% increase over the previous year thanks to strong demand for digital cameras. Due to their low prices, revenue from scanners, PC cameras and the like stabilized.
TABLE 1: PRODUCTS PRODUCED BY TAIWAN’S OPTO-ELECTRONICS INDUSTRY Optical Input:
Image scanner, Barcode Reader, Digital Camera, PC Camera Optical Storage
CD-ROM Drive: CD-ROM, CE-RW, DVD-ROM, Combo, DVD-W, CD Player, VCD, DVD Player, DVD Recorder
CD: Information CD, Music DC, Video CD, CD-R, CD-RW, DVD R, DVD RW Optical information
Optical Output: Printer, Fax Machine Optical Fiber, Optical Cable Optical Active Component Optical Passive component Optical Communication
Optical Communication Equipment
Optical Display PDP, TFT, TN/STN, OLED, Micro Display, VFD Opto-electronics Component Light Emitting Component: LD, LED
Light Detecting Component: CIS, CMOS Source: IEK-IT IS Program, ITRI (2004/04)
Owing to growing demand for information monitors and flat TVs, Taiwan's flat panel display (FPD) segment grew accordingly in 2003. Shipments of large-size TFT LCD panels hit record highs with rising average sales prices (ASPs.) Popularity of hand-held devices drove revenue for small to mid-sized panels higher. The fact that Taiwan manufacturers continued to expand capacity led to the emergence of applications markets for organic ELD and PDP panels. Revenue from monitor sales in 2003 reached NT$316.168 billion, an increase of 35% over 2002. Revenue from sales of optical communication products in 2003 decreased 3% to NT$7.949 billion versus the previous year.
Output in the optical communication segment grew in 2003. However, rapidly falling unit prices drove revenue down. Price drops were particularly steep for Japan's Bi-Di optical transceivers, which forced domestic manufacturers to cut their Q4 quotes by an average of 25% versus Q3.
LED products carry much weight in Taiwan's opto-electronics component segment. Ultra-bright LED was one of the key products. Blue-light and white-light LEDs are the driving force of growth. Nevertheless, fierce competition drove prices down rapidly. Popularity of digital images contributed much to the growth in production value of image detectors. In 2003, the production value of opto-electronics
components was NT$39.2 billion, an increase of 41% over 2002.
STSP Sales Statistics in the STSP
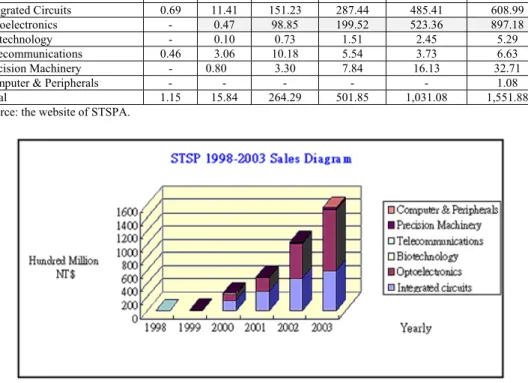
STSP companies are classified into six categories: Integrated Circuits, Optoelectronics, Biotechnology, Telecommunications, Precision Machinery, and Computer &
Peripherals. It was in 2003 that Opto-electronics progressed by leaps and bounds, with NT$ 897.18 hundred million in sales and an increase of 71.4 % in sales over the previously year, and more over an increase of 1907 % over the year of 1999. In 2003, the STSP has NT $ 1551.88 hundred million sales in total, and the Optoelectronics industry had a largest number of sales proportions (see Table 2 and Figure 1). TABLE 2: THE SALES STATISTICS OF STSP
Unit: Hundred Million NT$
1998 1999 2000 2001 2002 2003 Integrated Circuits 0.69 11.41 151.23 287.44 485.41 608.99 Optoelectronics - 0.47 98.85 199.52 523.36 897.18 Biotechnology - 0.10 0.73 1.51 2.45 5.29 Telecommunications 0.46 3.06 10.18 5.54 3.73 6.63 Precision Machinery - 0.80 3.30 7.84 16.13 32.71
Computer & Peripherals - - - 1.08
Total 1.15 15.84 264.29 501.85 1,031.08 1,551.88
Source: the website of STSPA.
Figure 1: Sales diagram of STSP in 1998-2003 Followed with the development of STSP, the numbers of
employees have increased year by year. A total of 21,532 people work in the STSP, in terms of the distribution of
workers, 6,338 (29%) work in Integrated Circuits, 12,695 (60%) work in opto-electronics industry, and only a few people distributed in other high-tech industry (see Figure 2)
Figure2: Number of workers by industry in STSP, 2004
Integrated Circuits, 6338, 29% Optoelectronics , 12695, 60% Precision Machinery, 266, 1% Telecommunications , 688, 3% Biotechnology , 506, 2% Computer & Peripherals, 65, 0% Others, 974, 5%
III. LITERATURE REVIEW OF SOCIAL NETWORK ANALYSIS
A number of disciplines have shaped the development of social network analysis. German psychiatrist Jacob L. Moreno [59], who developed an approach known as sociometr1, used network diagrams to represent interpersonal
relations in small groups. British anthropologists John A. Barnes [2], Elizabeth Bott [5], and J. Clyde Mitchell [57] investigated the structure of community relations in tribal and village societies. Some sociologists at Harvard University explored the patterns of international relations and established the mathematical basis for the analysis of social structure [74, 75, 76]. Their extensive research, specifically focusing on ego-centric networks, soon firmly established social network analysis as a method of structural analysis in the 1960s and early 1970s [66]. Influenced by mathematically-orientated structural analysts, some scholars started using algebraic ideas to model structural relations and developed advanced techniques for network analysis in other disciplines. Linton C. Freeman [30], for example, developed a measure of the centralization of a network, based on the difference between of the centrality of the most central unit and the other units. His work has become one of the most important measurements in social network analysis.
Generally speaking, there have been three distinct research traditions [72]: the concept of the social network, social structure as social network, and structural explanations of social/political processes. Network analysts use the concepts and methods of graph theory, which generate the mathematical analysis of nodes and links [15]. Due to limitations in the scale of social systems and the complexity of these sociological analyses, network analysts use matrices in which each cell represents a potential tie from one network member to another. In addition, they use standard statistical methods, supplementing them with such measures of network properties as the density of ties and the centrality of members. Blockmodeling, for example, has helped researchers to discover basic social structures and to compare actual networks with hypothesized structures.
Social network analysis focuses on patterns of relations among people, organizations, states, etc [71]. This research approach has rapidly developed in the past twenty years, principally in sociology and communication science. The International Network for Social Network Analysis (INSNA) is a multidisciplinary scholarly organization, which publishes a refereed journal.
A. Major mathematical foundations of network method and its tenet
Social network analysis encompasses theories, models, and applications that are expressed in terms of relational concepts or processes. Some theoretical concepts have been the inspiration for the development of specific network
1 Moreno used sociometry, which was also a journal found by Moreno in
1937, as a method to investigate how psychological well-being is related to the structural features of what he termed ‘social configurations’.
analysis methods. Pioneers from different disciplines have taken particular aspects of the theoretical idea of social groups to develop more precise social network definitions. There are three major mathematical foundations of networks methods: graph theory, statistical and probability theory, and algebraic models.
First, graph theory provides an approximate representation of a social network and a set of concepts that can be used to study formal properties of social networks. It gives us mathematical operations and ideas in which many of these properties can be quantified and measured. Its terminology can be used to label and denote many social structural properties [66]. For example, we use graph theory as a model of a social system consisting of a set of actors and the ties between them. Actors in a network are represented as nodes of a graph while ties between actors are represented as lines between the nodes of the graph. In addition, graph theory also gives us the ability to prove theorems about graphs and representations of social structure [2].
Second, statistical theory is important as people begin to study reciprocity, mutuality, balance, and transitivity [71]. Research on statistical models for social networks increased in 1980s and development of more advanced statistical models continues today. Simple log linear models of dyadic interactions are now commonly used in practice in either a nominal or an ordinal scale [66]. Statistical models become necessary when researchers test hypotheses about various structural tendencies on multivariate relational network data. For example, special statistical procedures designed to formalize social network analysis notions about the density of ties, the centrality of actors, and structural equivalence may contribute to a unique analytical toolbox that further distinguishes social network analysis from conventional social analysis [71, 29, 66].
Third, algebraic models are widely used to study multirelational networks such as kinship systems [74], friendship networks [7], and network role structures [51, 6, 62]. A network structured by algebraic models may refer either to relations among individuals or to relations among other social units such as blocks in a blockmodel [62]. In particular, algebraic methods allow for a general means of analyzing network representations into simple components, a property that may greatly enhance the descriptive power of the representation.
Discussed through the above theoretical development, three different notational schemes are used to represent a wide range of network data [71]. First, graph theoretic notations become most useful for centrality and prestige methods, cohesive subgroup ideas, as well as dyadic and triadic methods. It provides a straightforward way to refer to actors and relations. One presents the data for each relation in a two-way matrix, termed a sociomatrix, where the rows and columns refer to the actors making up the pairs. Sociomatrices are adjacency matrices for graphs. Second, sociometric notation is often used for the study of structural equivalence and blockmodels [76]. The third notation is algebraic notation, which is most appropriate for role and positional analysis and relational algebra. Such analyses use
algebraic techniques to compare and contrast measured relations, and derive compound relations.
There are a variety techniques in which network data can be collected such as questionnaires, interviews, observations, archival records, experiments, and other qualitative techniques [71]. Questionnaires and interviews, for example, are very useful when the study objects are human beings. They can be implemented under several formats, e,g, roster or free recall, free or fixed choice, ratings or complete rankings. Network data also can be obtained from archival records such as journal articles, newspapers, and minutes of meetings [18]. Throughout the network data collection procedure, a specific group of members will be identified from the actor population. Knoke [47: pp.280] provided four techniques to locate the key actors:
1. Positional methods: Persons or organizations in the key roles such as the elected or executive positions in the units;
2. Decisional methods: Actors influencing or participating in the decision-making process;
3. Reputational methods: Actors who are believed by knowledgeable observers to possess or exercise actual or potential power in the system; and
4. Relational methods: Actors who maintain important relationships with other members whom are not found through reputational queries in the system.
Network data gathered from the above methods attempt to measure the ties among all the actors in the set, in addition to collecting actor attribute information. The items regarded as the attributes of particular individuals such as gender and education can be analyzed through variable analysis in the statistical procedure where attributes are measured as values of particular variables. Relational data, on the other hand, are the ties and connections that relate one to another. By undertaking quantitative and statistical counts of relations, network analysis, which is employed to be the measures of network structure, should illustrate attribute and relational data. Plus, the drawing software will be helpful to illustrate network data and analyses.
The primary tenet of network analysis is that the structure of social relations determines the content and outcomes of those relations. Garton et al. [37] synthesize literatures in past years and list four units of analysis:
(1) Relations: relations are characterized by content, direction and strength [37]. The content refers to the resource that is exchanged. In social networks, pairs may exchange different kinds of information, such as social matters or work-related. The relations between peoples may have direction; in other words, a relation is directed or undirected. When one of dyad gives information and the other only receives it, the relation is directed. Besides content and direction, relations also differ in strength. We can decide the degree of strength with frequency of communication, the amount of information exchanged and the importance of information. The strength of relations that dyad communicates once a day is greater than communicate weekly or yearly.
(2) Ties: A tie connects a pair of actors by one or more relations. Pairs may maintain a tie based on one relation only or a multiplex tie based on many relations. Thus, ties also have characteristics like content, direction and strength, but they are often referred to as weak or strong. Actors that are connected at short lengths or distances may have stronger connections; actors that are connected many times may have stronger ties. Ties that are weak are generally non- intimate connections by infrequently maintained. Strong ties include combinations of intimacy, self-disclosure, provision of reciprocal services, frequent contact, and kinship [37].
(3) Multiplexity: the more relations in a tie, the more multiplex the tie. Social network analysts have found that multiplex ties are more intimate, voluntary, supportive and durable [73].
(4) Composition: the composition of a relation or a tie is derived from the social attributes of both participants. For example, a tie is between different or same sex dyads, between a supervisor and an underlying or between two peers.
The centrality of actors and the density of ties are perhaps the two most important and fundamental measures of structural relations. An actor is prominent if the ties of the actor make the actor particularly visible to the other actors in the network. Freeman [30] has developed a measure of the centralization of a network, based on the difference between the centrality of the most central unit and the other units. According to Freeman, centrality can be determined by three types of relation measurement: (1) degree, which refers to the number of direct ties between an actor and other actors in a network; (2) closeness, which refers to the extent to which an actor can reach a large number of other actors in a small number of steps; and (3) betweenness, which refers to the extent to which an actor has a unique path between other actors, so that the latter must deal with the former if they are to communicate. The centrality measurement is critical in most network studies. For example, Brass and Burkhardt [8, 9] found that assertiveness and coalition building were related to degree and closeness measures of centrality. Typically, the general procedure involved in any measure of graph centralization is to look at the differences between the centrality scores of the most central points and those of all other points. In other words, centralization is the ratio of the actual sum of differences to the maximum possible sum of differences. It describes the extent to which the cohesion is organized around particular focal points. In sum, the primary purpose of a graph centralization measure is to express how tightly the graph is organized around its most central points. Another important measurement of structural relations is density, which describes the general level of cohesion in a graph. The density of a graph is defined as the number of lines in a graph, expressed as a proportion of the maximum possible number of lines [66]. Although different measures of density can be used to evaluate the cohesiveness of a graph, a subgroup, a blockmodel, or an affiliation network [71], this study will focus on the measure of ties in the graph generated from network data.
The most direct way to study a social structure is to analyze the patterns and strength of ties linking its members. These ties linking nodes in a social system are used to explore how structural properties affect behavior beyond the effects of normative prescriptions, personal attributes, and dyadic relationships. They also provide opportunities and constraints because they affect the access of people and institutions to such resources as information and power. The debate on effects of strong ties and weak ties has been addressed by scholars [38, 39, 60]. Weak ties provide people with access to information and resources beyond those available in their own social circle, but strong ties provide close support systems in some circumstances and are more readily available. McPherson, Popielarz and Drobnic [55] found that weak ties and network connections that span greater distance in sociodemographic space are positively correlated with people leaving current groups and joining new ones. Nelson [60] investigated the relationship between social networks and conflict in 20 organizations and showed that low-conflict organizations are characterized by higher numbers of intergroup strong ties, measured as frequent contacts, than are high-conflict organizations.
B. The Applications of SNA
In the past two decades, many researchers have contributed to our understanding of networks by making efforts to improve network centrality measures [30, 68, 35], structural position [56], network and algebraic models [1, 31, 62], analytic methods [47, 72, 53, 71, 63, 66], computer software [4], and graph visualization [48, 33, 32]. Some researchers emphasize theory-driven development or applied network approaches to network-related theories. For instance, network exchange theories, which include power-dependence theory identified by Emerson [28], Cook [19] and their colleagues, and elementary-relations theory identified by Willer and his colleagues [52], concern how the shape and parameters of network structures of exchange relations affect the power of actors to extract valuable resources in their exchanges with others [52, 78, 67, 21, 77]. A few researchers use network approaches by examining stakeholder theory [44, 26, 64], which explains how an organization functions with respect to the relationships and influences existing in its environment. Since social network analysis has become a major tool for sociological analysis and is used in disciplinary debates on a wide variety of issues, more network application to non-sociological theories can be expected in the future.
Researchers also use social network analysis to extend their understanding of many behavioral and social phenomena. Such analysis is used to study: community elite decision-making [49], power [9], ethnographic study [69], social influence [54], social psychology [34, 40], economic sociology [23,22], innovation diffusion [17, 70], organization study [61], and behavior science [10]. Social network analysis has even become an aid in conspiracy investigation [24]. In addition, many sociologists have worked since the 1970s to expand network concepts into a comprehensive structural formulation by concentrating on studying the form
of network patterns rather than their content [3, 16, 12, 11]. Some structuralists analyze intra-organizational as well as interpersonal networks. Ibarra and Andrews’ [43] study, for example, explored the relative contributions of individual attributes, formal organization positions, network centrality, and network proximity in explaining individual variation in the perception of work-related conditions in an advertising firm. They suggested that network factors shaped job-related perceptions over the effects of individual attributes and formal positions.
Some political sociologists employed social network studies to evaluate the political power that results from the position of interest groups and nation-states in the pattern of links. Domhoff [25] examined the membership lists of thirteen elite social clubs and 17 policy-planning groups by using matrix algebra and found that the corporate-dominated Business Council stood in the central position, and most large U.S. firms had interlocks with each other in the network. Dye [27] examined governing boards rather than memberships in three groups and found that corporate executives and directors were in key leadership positions. Burris [13] found a high degree of overlapping leadership in the policy-planning network among twelve leading groups/organizations between 1973 and 1990 in the U.S. Kanter [45] defined power in terms of the access to important resources provided by one’s position within an organization. Burt [14] presented a comprehensive treatment of the various conceptualizations of the link between network position and community power. Cook and Emerson [20] reported findings from a laboratory study of four-party exchange networks that demonstrate a direct link between network position and level of power use. In addition, many scholars explored power networks by studying the private sector. Brass [7] found that departmental membership was significantly related to individual power in a firm. In a cross-national comparative study, Scott [65] revealed that networks of corporate power were different and could not be generalized across different societies/countries. In his comprehensive study, Mizruchi [58] examined the political behavior of firms against the variables of market constraints, corporate interlocks, stock ownership, geographic proximity, and social ties. Results indicated that the presence of indirect ties between firms was more strongly associated with contributions to the same candidates than was the presence of direct ties. Few people deny that firms are influential in politics, but fewer still know just how influential business is or what role its influence takes. However, by examining structural relations among municipal elites, political scientists revitalized the microanalysis of community power structures.
Some political scientists began to refocus their theoretical interests on the internal structure of relationships among community leaders, eventually coming to reconceptualize the basis of community power as interpersonal networks. Galaskiewicz [36] found that elected officials, bureaucrats, and committees responsible for making certain political decisions take into account the opinions of various groups in the community that do become active, assess these actors’ potential to form coalitions with
other actors in the community, and then make decisions accordingly so as to minimize the level of conflict over the issue. In a study of Norwegian entrepreneurs, Levine [50] found that networks linking entrepreneurs create new enterprises. In addition, networks that developed between the public and private sectors also promoted economic development. He also found the public sector played a new role—network broker. This new role, however, required public sector initiatives, provision of necessary resources, and active and equal participation among all parties involved in the development effort. Unfortunately, there is an absence of empirical study similar to Levine’s that analyzes political-economic structures of power and dependency in local economic development.
The application of network methods to power structures produces new insights into domination and influence processes in local communities. Through network studies on power structures, the structural relations among community actors have been taken into account to fully understand how a community power structure operates. For many local officials, especially economic development
professionals, social network analysis should be helpful when they allocate resources, make policy decisions, or solve economic (or social) problems.
IV. RESEARCH DESIGN
This research will be divided into four steps as follows (see Figure 3).
Step1: Define the question domain.
Step2: Literature review which contained opto-electronics industry, Social Network Analysis, and industrial network theory, and research design (include questionnaire design and implementation).
Step3: Build the model of entrepreneurial social network, including four main networks of relationships-- attribute, business, financial, and external interaction with actors, resources, activities and interactions information.
Step4: Measure organizational performance by the outcomes of networks and cooperation relationships.
A. Entrepreneurial Networks
A social network is a set of people (or organizations or other social entities) connected by a set of social relations, such as friendship, co-working or information exchange [37]. Therefore, Social Network Analysis (SNA) is the mapping and measure of relationships and flows between people, groups, organizations, or other information/knowledge processing entities. In other words, SNA provides both visual and statistical analyses.
The definition of industrial network by Hakansson [41, 42]: “…consists of three variables: actors (individuals, groups or companies), activities performed by actors (transformations and transactions), and resources (physical assets, financial assets and human assets). Each of three classes of variables forms a network structure, and at the same time they are interwoven in a total network.” In our study, a variable- interpersonal relationships, adding with a social point of view, is contained in this model. This model will cover four main networks of relationship: attribute, business, financial, and external interaction (Figure 4). For the purposes of operationalization, the common elements of each network are explained as follows:
1. Attribute network: This subsection discusses the attribute network, which composed of firm's scale, capital investment, R&D expenditure, employee profit sharing & stock ownership, initial public offerings, establishes time of firms, the number of firm’s staff, etc.
2. Business network: The content of business network contains the main business of firms (such as manufacture, design, testing services or others), sales revenues, market shares in domestic or international market, material supplier, equipment vendor, the type of strategic alliance (includes patent licensing, cooperation of management and sales, joint venture, spin-off, technical training, OEM, etc.), the number of patent, etc.
3. Financial network: The financial network includes gross profit, cross holding/cross ownership, correspondent bank (such as foreign bank; homeland/native bank; financial institute for local region: credit cooperative,
farmer’s cooperative, or others), finance raising (such as debenture stock issuing; loan, leveraged buyout and loan), TSE (Taiwan Stock Exchange), OTC (Over-the-Counter) Listed Company, etc.
4. External interaction network: The external interaction network consists of interpersonal relationships; exhibition activity; face-to-face meeting, by telephone, fax, email, paper letters or memos; audio conference; videoconferencing; trade union/ chamber of commerce; venture capital, etc.
B. Research hypotheses
According the proposed model (analysis framework), we raise five basic research hypotheses:
Hypothesis 1: The bigger (attribute network ) the firm is, the better financial energy it will be.
Hypothesis 2: The more frequency of interaction, the more complex of the business network.
Hypothesis 3: The more complex of the business network, the better of the organization performance.
Hypothesis 4: The better of the attribute network, the closer of the inter-dynamic network outside.
Hypothesis 5: The closer the external interaction network, the more channels to collect finance.
This research centres on an attempt to develop a model of entrepreneurial network analysis, particularly with regard to the opto-electronics industry in the STSP. The research also conducts an assessment to measure how the interaction and interdependence among them affect the industrial performance. In order to analyze these, the interactions (or relationships) that take place among firms are tested. Most of Taiwan’s opto-electronics industry are located and concentrated on the STSP. In 2002, the STSP included 44 companies (see Table 3), conducted NT$897.2 million in sales and experienced a growth rate of 71.4 % over the previous year. Because of this success in opto-electronics industry and its cluster effect, this research investigates the interactive relationship among these companies by taking the opto-electronics industry and especially the STSP as a case study.
In the literature on the performance of Opto-electronics industry, there has not been much consideration of network relations toward the organizational performance in Taiwan, even though the concept of Social Network Analysis has adopted in many field and received much attention from scholars worldwide. In this study, we are the first one to apply SNA approach into analyzing the measurement of organizational performance. Under the state’s policy of “North (Shin-chu Science Park) IC, South (STSP)
“Opto-electronics”, this study also casts light on government, especially STSP Administration, how to attract foreign opto-electronics firms invest in this area and formed industry cluster effect via “position analysis” of opto-electronics industry in the STSP. Furthermore, the government is able to deliver related information, integrated resources, and further, to assist or inverse to control the whole industry development policy through position analysis.
TABLE 3 LIST OF OPTO-ELECTRONICS FIRMS IN THE STSP Actima Technology Corporation
Chi Mei Electroluminescence Corp. CHI MEI Optoelectronics Corp. Coretronic Corporation
Corning Display Technologies Taiwan, TSIP branch DELTA Electronics Inc.,Tainan Branch
Dragon Technology Inc. E-One Moli Energy Corp. Epitech Co. Ltd. FINEX Co. Ltd. Genesis Photonice Inc.
HannStar Display Corporation, TSIP Branch HI-D Films Technologies Inc.
Himax Display Inc.
Jantex Technology Co. Ltd., TSIP Branch Kenmos Technology Co. Ltd.
Lightronik Technology Inc. Lintec Speciality Films Inc. (Taiwan) Motech Industries Inc., Science Park Branch NEXGEN Mediatech Incorporation, TNSIPA Branch One Touch Technology Co. Ltd.
Optimax Technoology Corporation,Tainan Branch Prokia Technology Co. Ltd.
South Epitaxy Corporation South SINTEK Photronic Corp.
Taiwan Salt Industrial Corporation, TSIP branch Taiwan Stanley Electric Co. Ltd.
United Epitaxy Co. Ltd. West Electric Co. Ltd.
V. EXPECTED OUTCOMES
The study results will reveal the process of production/business activities of opto-electronics industry in the STSP. In addition, the study reviews what kind of inter-dynamic relationships existed among firms located in the STSP and how the relationships affect the business performance. Furthermore, the study will explain how to recognize and confirm the core position of firms through the analysis of social network, and how the government take the advantages of the core firms to assist policy support and implementation.
REFERENCES
[1] Arabie, P. and Boorman, S. A. 1982. Blockmodels: Developments and prospects. In Hudson, H. C. (ed.) Classifying social data. San Francisco, CA: Jossey-Bass Inc.
[2] Barnes, John A. and Harary, F. 1983. Graph theory in network analysis. Social Networks. 5: 235-44.
[3] Boorman, S. A. and White, Harrison C. 1976. Social structure from multiple networks II role structures. American Journal of Sociology. 81: 1384-1446.
[4] Borgatti, Steven, Martin Everett, Martin and Freeman, Linton C. 1999. UCINET V. Natick, MA: Analytic Technologies Inc.
[5] Bott, E. 1957. Family and social network: Roles, norms, and external relationships in ordinary urban families. London: Tavistock.
[6] Boyd, J. P. 1990. Social semigroups: A unified theory of scaling and Blockmodeling as applied to social networks. Fairfax, VA; George Mason University.
[7] Brass, Daniel J. 1984. Being in the right place: A structural analysis of individual influence in an organization. Administrative Science Quarterly. 29: 518-39.
[8] Brass, Daniel J. and Burkhardt, Marlene E. 1992. Centrality and power in organizations. in Nohria, Nitin and Eccles, Robert G. (eds.) Networks and organizations: Structure, form, and action. pp. 191-215. Boston, MA: Harvard Business School.
[9] Brass, Daniel J. and Burkhardt, Marlene E. 1993. Potential power and power use: An investigation of structure and behavior. Academy of Management Journal. 36: 441-70.
[10] Brass, Daniel J., Butterfield, Kenneth D. and Staggs, Bruse C. 1998. Relationships and unethical behavior: A social network perspective. Academy of Management Review. 23(1): 14-31.
[11] Breiger, R. L. 1991. Explorations in structural analysis: Dual and multiple networks of social structure. New York, NY: Garland Press. [12] Burkhardt, Marlene E. and Brass, Daniel J. 1990. Changing patterns or
patterns of change: The effects of a change in technology on social network structure and power. Administrative Science Quarterly. 35: 104-27.
[13] Burris, Val 1992. Elite policy-planning networks in the United States. In Moore, Gwen and Whitt, J. Allen (eds.) Research in politics and society IV: The political consequences of social network. pp. 111-34. Greenwich, CT: JAI Press.
[14] Burt, Ronald S. 1977. Power in a Social Topology. In Liebert, R. J. and Imershein, A. W. (eds.) Power, paradigms and community research. pp. 251-334. Beverly Hill, CA: SAGE.
[15] Burt, Ronald S. 1980. Models of network structure. Annual Journal of Sociology. 85: 892-923.
[16] Burt, Ronald S. 1982. Towards a structural theory of action: Network models of social structure, perceptions, and action. New York, NY: Academic Press.
[17] Burt, Ronald S. 1987. Social contagion and innovation: Cohesion versus structural equivalence. American Journal of Sociology. 92: 1287-1335.
[18] Burt, Ronald S. and Lin, Nan 1977. Network time series from archival records. In Heise, D. R. (eds.) Sociological methodology. pp. 224-54. San Francisco, CA: Jossey-Bass.
[19] Cook, Karen S. 1987. Social exchange theory. Newbury Park, CA: SAGE.
[20] Cook, Karen S. and Emerson, Richard M. 1978. Power, equity and commitment in exchange network. American Sociological Review. 43: 721-39.
[21] Cook, Karen S. and Whitmeyer, J. M. 1992 Two approaches to social structure: exchange theory and network analysis. Annual Review of Soicology. 18: 109-27.
[22] Davern, Michael E. 1997. Social networks and economic sociology: A proposed research agenda for more complete social science. Journal of Economics and Sociology. 56(3): 287-302.
[23] Davern, Michael E. and Eitzen, D. Stanley 1995. Economic sociology: An examination of intellectual exchange. American Journal of Economics and Sociology. 54(1): 79-88.
[24] Davis, Roger H. 1981. Social network analysis: An aid in conspiracy investigations. Investigative aids of the federal bureau of investigation. Washington, DC: The Department of Justice.
[25] Domhoff, G. William 1978. The powers that be: Processes of ruling class domination in America. New York, NY: Randon House. [26] Donaldson, T. and Preston, L. E. 1995. The stakeholder theory of the
corporation: Concepts, evidence, and implications. Academy of Management Review. 20: 65-91.
[27] Dye, Thomas R. 1983. Who’s running America? The Reagan years. 3rd.ed. Englewood Cliffs, NJ: Prentice-Hall.
[28] Emerson, Richard M. 1962. Power-dependence relations. American Sociological Review. 27: 31-40.
[29] Erickson, Bonnie 1997 Social networks and history: A review essay. Historical Methods. 30: 149-57.
[30] Freeman, Linton C. 1979. Centrality in social networks I: conceptual clarification. Social Networks. 1: 215-39.
[31] Freeman, Linton C. 1992. The sociological concept of “Group”: An empirical test of two models. American Journal of Sociology. 98(1): 152-66.
[32] Freeman, Linton C. 2000. Visualizing social network. Journal of Social Structure. 1: 1-14. http://www.libraby.cmu.edu:7850/JoSS/article.
[33] Freeman, Linton C., Webster, Cynthia M. and Kirke, Deirdre M. 1998. Exploring social structure using dynamic three-dimensional color images. Social Networks. 20: 109-18.
[34] Friedkin, Noah E. 1990. Social networks in structural equation models. Social Psychology Quarterly. 53(4): 316-28.
[35] Friedkin, Noah E. 1991. Theoretical foundations for centrality measures. American Journal of Sociology. 96(6): 1478-504.
[36] Galaskiewicz, J. 1979. Exchange networks and community politics. Beverly Hill, CA: SAGE.
[37] Garton, Laura, Caroline Haythornthwaite, and Barry Wellman 1997. Studying Online Social Newtorks, access to the website of http://www.ascusc.org/jcmc/vol3/issue/garton.html on 07/15/2004 [38] Granovetter, Mark 1973. The strength of weak ties. American Journal
of Sociology. 78: 1360-80.
[39] Granovetter, Mark 1982. The strength of weak ties: A network theory revisited.” In Marsden, Peter V. and Lin, Nan (eds.) Social structure and network analysis. pp. 105-30. Beverly Hill, CA: SAGE.
[40] Gregory, Bovasso 1996. A network analysis of social contagion processes in an organizational intervention. Human Relations. 49(11): 1419-1435.
[41] Hakansson, H. 1982. International marketing and purchasing of industrial goods: an interaction approach, John Wiley and Sons, Chichester.
[42] Hakansson, H. 1987. Industrial technological development: a network approach, Croom Helm, London.
[43] Ibarra, Herminia and Andrews, Steven B. 1993. Power, social influence and sense making: Effects of network centrality and proximity on employee perceptions. Administrative Science Quarterly. 38(2): 277-303.
[44] Jones, T. M. 1995. Instrumental stakeholder theory: A synthesis of ethics and economics. Academy of Management Review. 20: 404-37. [45] Kanter, R. 1977. Some effects of proportions on group life. American
Journal of Sociology. 82: 965-90.
[46] Knoke, David 1994. Networks of elite structure and decision making. In Wasserman, Stanley and Galaskiewicz, Joseph (eds.) Advances in social network analysis: Research in the social and behavioral sciences. pp. 274-94. Thousand Oaks, CA: SAGE.
[47] Knoke, David and Kuklinski, James H. 1982. Network analysis. Newbury Park, CA: SAGE.
[48] Krackhardt, David, Blythe, Jim and McGrath, Cathleen 1995. KrackPlot 3.0 Natick, MA: Analytic Technologies Inc.
[49] Laumann, E. O. and Pappi, F. 1973. New directions in the study of elites. American Sociological Review. 38: 212-30.
[50] Levine, Morton 1993. Creating networks for rural economic development in Norway. Human Relations. 46(2): 193-208.
[51] Mandel, M. J. 1983. Local roles and social networks. American Sociological Review. 48: 376-86.
[52] Markovsky, Barry, Willer, David and Patton, Travis 1988. Power relations in exchange networks. American Sociological Review. 53: 220-36.
[53] Marsden, Peter V. 1990. Network data and measurement. Annual Review of Sociology. 16: 435-63.
[54] Marsden, Peter V. and Friedkin, Noah E. 1994. Network studies of social influence. In Wasserman, Stanley and Galaskiewicz, Joseph (eds.) Advances in social network Analysis: Research in the social and behavioral sciences. pp. 3-25. Thousand Oaks, CA: SAGE.
[55] McPherson, Miller, Popielarz, Pamela A. and Drobnic, Sonja 1992. Social networks and organizational dynamics. American Sociological Review. 57(2): 153-80.
[56] Michaelson, Alaina and Contractor, Noshir S. 1992. Structural positions and perceived similarity. Social Psychology Quarterly. 55(3): 300-10.
[57] Mitchell, J. Clyde (ed.) 1969. Social networks in urban situations. Manchester, UK: Manchester University Press.
[58] Mizruchi, Mark S. 1992. The structure of corporate political action: Interfirm relations and their consequences. Cambridge, MA: Harvard University Press.
[59] Moreno Jacob L. 1934. Who shall survive? Washington, DC: Nervous and Mental Disease Publishing Co.
[60] Nelson, Reed E. 1989. The strength of strong ties: Social networks and intergroup. Academy of Management Journal. 32(2): 377-401. [61] Nohria, Nitin 1992. Is a network perspective a useful way of studying
organizations? in Nohria, Nitin and Eccles, Robert G. (eds.) Networks and organizations: Structure, form, and action. pp. 1-21. Cambridge, MA: Harvard Business School.
[62] Pattison, Philippa 1993. Algebraic models for social networks. Cambridge, UK: University of Cambridge.
[63] Richards, William and Seary, Andrew 2000. Eigen analysis of networks. Journal of Social Structure. 1. http://www.libraby.cmu.edu:7850/JoSS/richards.
[64] Rowley, Timothy J. 1997. Moving beyond dyadic ties: A network theory of stakeholder influences. Academy of Management Review. 22(4): 887-910.
[65] Scott, John 1991. Networks of corporate power: A comparative assessment. Annual Review of Sociology. 17: 181-203.
[66] Scott, John 2000. Social network analysis. 2nd ed. Thousand Oaks, CA:
SAGE.
[67] Skvoretz, John and Willer, David 1991. Power in exchange networks: Setting and structural variations. Social Psychology Quarterly. 54(3): 224-38.
[68] Stephenson, K. and Zelen, M. 1989. Rethinking centrality: Methods and examples. Social Networks. 11: 1-37.
[69] Uehara, Edwina 1990. Dual exchange theory, social networks, and informal social support. American Journal of Sociology. 96(3): 521-57. [70] Valente, Thomas W. 1995. Network models of the diffusion of
innovations. Cresskill, NJ: Hampton Press.
[71] Wasserman, Stanley and Faust, Katherine 1994. Social network analysis: Methods and application. Cambridge, UK: Cambridge University Press.
[72] Wellman, Berry 1983. Network analysis: Some basic principles. In Collins, Randall (ed.) Sociological theory. pp. 155-200. San Francisco, CA: Jossey-Bass Inc.
[73] Wellman, Berry and Wortley, Scot 1990. Different strokes from different folks: Community ties and social support. American Journal of Sociology. 96(3): 558-88.
[74] White, Harrison C. 1963. An anatomy of kinship. Englewood Cliffs, NJ: Prentice-Hall.
[75] White, Harrison C. 1970. Chains of opportunity. Cambridge, MA: Harvard University Press.
[76] White, Harrison C., Boorman, S. A., and Breiger, R. L. 1976. Social structure from multiple networks I: Blockmodels of roles and positions. American Journal of Sociology. 81: 731-79.
[77] Willer, David ed. 1999. Network exchange theory. Westport, CT: Praeger.
[78] Yamagish, Toshio and Cook, Karen S. 1990. Power relations in exchange networks: A comment on “network exchange theory.” American Sociological Review. 55(2): 297-300.