行政院國家科學委員會專題研究計畫 期中進度報告
乳癌治療抗療性之整合研究--乳癌經放射治療、化學治療
或合併治療後分子特徵之比較(子計畫二)(1/3)
期中進度報告(精簡版)
計 畫 類 別 : 整合型 計 畫 編 號 : NSC 96-2627-B-002-013- 執 行 期 間 : 96 年 08 月 01 日至 97 年 07 月 31 日 執 行 單 位 : 國立臺灣大學電機資訊學院生醫電子與資訊學研究所 計 畫 主 持 人 : 莊曜宇 共 同 主 持 人 : 宋孔彬、張煥宗 報 告 附 件 : 出席國際會議研究心得報告及發表論文 處 理 方 式 : 本計畫可公開查詢中 華 民 國 97 年 06 月 12 日
行政院國家科學委員會補助專題研究計畫
期中進
度報告
乳癌治療抗療性之整合研究-乳癌經放射治療、化學治療或合併治療後
分子特徵之比較(子計畫二)
Breast Cancer Therapy-Resistant Integrated Research
計畫類別:□個別型計畫 ■整合型計畫 計畫編號:NSC 96-2627-B-002-013 執行期間: 96 年 7 月 1 日至 97 年 6 月 30 日 計畫主持人:莊曜宇 共同主持人:宋孔彬、張煥宗 計畫參與人員:陳俊雄、黃志清、賴柏禎、曾德玉、吳政舉 成果報告類型(依經費核定清單規定繳交):■精簡報告 □完整報告 本成果報告包括以下應繳交之附件: □赴國外出差或研習心得報告一份 □赴大陸地區出差或研習心得報告一份 □出席國際學術會議心得報告及發表之論文各一份 □國際合作研究計畫國外研究報告書一份 處理方式:除產學合作研究計畫、提升產業技術及人才培育研究計畫、列管計畫及下列情 形者外,得立即公開查詢 □涉及專利或其他智慧財產權,□一年□二年後可公開查詢 執行單位:國立台灣大學 中 華 民 國 年 月 日
計畫中文摘要: 本計畫提出一整合式之研究方法來探討個別病患對乳癌治療之不同 抗性。抗療性 乃乳癌治療之一大課題,其非由單一成因所造成,也非現有臨床 工具可做預測。為探討 此問題,我們結合臨床醫學、基因資訊、分子影像、電 腦輔助診斷、藥物資訊等領域, 針對以下課題進行跨領域之探 討與整合:(一)電腦模擬篩選(in silico)平台發展抑制血管新生 抗乳癌藥物;(二) 以DNA微陣列探討乳癌經放射治療、化學治療或合併治療後分子特徵之 比較;(三)開發新光學技術,應用奈米標記與高光譜影像於DNA微陣列之基因表現 多 重檢測;(四)即時超音波分子顯微影像技術,用以評估小動物乳癌模式中之 血管新生及腫 瘤型態變化;(五)3-D乳房彩色超音波之電腦輔助治療監測。本計畫將探討TTA1,並將其 施以乳癌細胞株MDA.MB.231,在裸鼠動物模型中從分子至組織層級進行化療及放療效果 探討。 關鍵字:乳癌、抗療性、aptamer、微陣列、超音波影像、分子影像、電腦輔助 治療監測。 Abstract: We propose an integrated approach to investigating anti-cancer treatment response of individual breast cancer patient. Treatment resistance of breast cancer is a major clinical problem and the cause is likely to be heterogeneous, multifactorial and often unpredictable with current clinical tools. To address this problem, the main purpose of this project is to explore an integrated approach for individualized medicine that includes clinical research, genetic data analysis, molecular imaging, and information technologies. Specifically, the approach includes the following components: (1). An in silico platform with peptide aptamers as guides for small molecule antiangiogenesis drug discovery, (2). The use of DNA microarray to identify differentially expressed genes, provide gene expression profiles for tissue-specific disease signature, and to map signal transduction pathway, (3). A new optical detection platform for DNA microarrays allowing simultaneous analysis of at least four samples on a single microarray, (4). Ultrasonic molecular real-time microimaging with improved resolution, contrast and angiogenesis targeting capabilities, and (5). A computer-aided monitoring system that can quantify the vessel information of 3-D power Doppler ultrasound on breast tumors and analyze the contrast medium response of tumor. TTA1 compounds will be used to treat breast cancer cell lines, MDA.MB.231 with chemotherapy and/or radiation therapy, and assess the curative effect by examining molecular characterization using microarray analysis and in vivo targeted imaging on xenografted tumors. The research team consists of 3 PIs, 5 co-PIs and two international collaborators from multiple and complementing disciplines, and all with extensive experiences and achievements in related research fields. With this, disease prognosis is possible and the project represents a step closer to individualized healthcare. This approach can also be extended to other diseases and has a greater impact.
Keywords: Breast cancer, treatment resistance, microarray, ultrasonic imaging, molecular imaging, computer aided monitoring.
Introduction
Breast cancer has become the leading cause of death in women in Taiwan, and the incidence of breast cancer has dramatic increased in the past two decades, from 10.40 of 100,000 in 1980-1984 to 22.38 of 100,000 in 1995-1999 for Taiwanese [1, 2]. Furthermore, lifestyle change since 1960, such as having harmful dietary habits that take more fats and fewer supplements, may be one of the causes that lead to the increasing number of breast cancer patients in relatively young median age in Taiwan [3]. Early-onset breast cancer has more aggressive tumor biology and poorer prognostic features for all stages than the breast cancer at older age groups [4]. Radiotherapy and chemotherapy are hitherto the most important treatment modalities for breast cancer. Radiotherapy can improve local control before or after surgery and improve overall survival, whereas adjuvant chemotherapy is considered to enhance survival of breast cancer patients. However, the curative efficacy of radiotherapy is sometimes limited due to the radioresistance of individual tumors or the risk of radiation-mediated angiogenesis in tumors. Combination of chemotherapy and radiotherapy has synergistic effects on residual disease after surgery that could enhance therapeutic efficacy. Therefore, discovery of new compounds will benefit future therapy in breast cancer.
Ionizing radiation has been known to cause necrosis, DNA damage, cell cycle arrests, and apoptosis [5]. DNA damage induced by radiation includes double strand breaks (DSB), single strand break (SSB), base damage, and DNA-protein crosslinks [6]. Those lethal mutations and chromosomal aberrations lead to loss of reproductive ability in tumor cells and trigger cell death. Hence, radiotherapy is generally applied to control carcinoma. However, the efficiency of radiotherapy may be restricted by multiple cellular protective responses through activating DNA repair process or inducing stress responsive pathways. For example, most of the radiosensitive tumor cell lines have been examined to have defect in DSB repair [7-9] suggesting that DSB repair mechanisms affect the sensitivity of tumor cells response to radiation. Furthermore, many genes involved in stress responses have been shown to alter the transcriptional levels after radiation and are expected to participate in the radiation-induced responses, such as those genes involved in MAP kinase pathway [10, 11], DNA repair pathway [12, 13] and TP53-activated pathway [14-16], and the members of EGFR gene family [17], cytoskeletal elements [18] and cytokines [19, 20]. Cytokine factors, such as TNF-alpha, bFGF, and IL-1 have known to modulate radiosensitivity [21-24]. Mutations in oncogenes like c-raf-1 [25, 26] and ras [27] or in tumor suppressor genes like p53 [28, 29] have also reported to affect radioresistance. By modulating of these pathways, we could reduce therapeutic resistance and improve clinical outcome. For instance, pharmacological inhibition of DNA repair enzymes such as PARP, DNA-PK or XRCC4/ligase IV complex has been proved to be a useful strategy to enhance radiosensitivity [30].
In addition, the interactions between extracellular matrix molecules (ECM) and adhesion molecules have been reported to associate with radioresistance, and the radiation-modulated expression of adhesion molecules and ECM components has been considered to be responsible for the increasing risk of angiogenesis and metastasis after
radiotherapy (reviewed in ref. [31]) . For instance, radiation-induced apoptosis could be inhibited in cells cultured onto fibronectin [32, 33]. Radiation has been known to remodel extracellular matrix molecules and thus disable the cell-cell interaction, and the process might increase genomic instability that consequently promotes carcinogenesis [34, 35]. The interaction between cells and ECM also plays a crucial role in tumor invasion and metastasis. Emerging data have shown that radiation may enhance the potential for invasion and metastasis partially by interfering with adhesion molecules on tumor cells [31], despite another report suggested this conclusion still needs more evidence to support [36]. Therefore, modulation of adhesion and ECM components in combination with radiation is expected to improve therapeutic efficacy in tumors.
Tenascin-C, an extracellular matrix protein, is observed to be highly expressed in tumor stroma, and has been reported to stimulate cell proliferation and angiogenesis [37, 38]. Moreover, numerous studies revealed that the expression level of tenascin-C is positively correlated with the tumor grade, malignancy, and invasiveness of tumors [37], including in breast carcinoma [39, 40]. For these reasons, tenascin-C is avaluable candidate of molecular markers for cancer diagnosis. Tenascin-C can stimulates tumor cell proliferation by competing the binding site of fibronectin that results in the impairment of the receptor function of syndecan-4 and the inhibition of fibronectin-induced integrin signaling [41]. A study made by Ruiz et al. [42] has showed that glioblastoma cells grown in presence of tenascin-C enhance proliferation related to in absence of tenascin-C. A microarray analysis of glioblastoma cells grown in presence or absence of tenascin-C showed that the present of tenascin-C can modulate a set of genes whose functions are link to proliferation and tumorgenesis [42]. For instance, mitogen-activated protein kinase signaling pathway, which induces downstream genes driving proliferation [43], is activated; Wnt signaling pathway, which is involved in cellular transformation [44], is downregulated. Therefore, strategies to counteract the function of tenascin-C in cancer development have been proposed by many studies. A modality designed to use radio-labeled tenascin-C antibody has been proposed for local radiotherapy and showed better outcome than with conventional radiotherapy [45, 46]. Chemotherapy that uses drugs designed to block the active sites of tenascin-C is another approach to enhance curative effect of radiotherapy. TTA1, a modified RNA aptamer, is designed to bind tenascin-C [47]. Aptamers are characterized by their high affinity to targets and small sizes, and thus they have the advantages of higher uptake in target tissue and rapid blood clearance and might be powerful tools of cancer diagnosis and therapy.
Bio-markers often assist in cancer diagnosis and prognosis. DNA microarray technology is a powerful tool that can simultaneously evaluate large number of genes. New technology in microarray can also allow high throughput screening of mutation and genotyping for polymorphisms possible. DNA microarray can be used to identify differentially expressed genes, provide gene expression profiles for tissue-specific disease signature, and map signal transduction pathway. Genome-wide expression profiling methods using microarray chip technology have been applied to compare the gene expression profiles among subgroups of patients characterized by different survival or tumor morphologic types [48-51], and the studies
provided potential in establishing biomarkers to predict lung cancer risk or progression. Utilizing microarray facilities us to identify the genes acting downstream of a target gene. These technological advances have tremendous impact in clinical medicine. The information generated from microarray can be used to identify biomarkers for early diagnosis of diseases, for molecular classification of cancer, for prognosis prediction, for pharmcogenomic studies, or for identification of new drug targets and individualized treatment strategy. Also, microarray is utilized to survey the modulated expression profiles of cells in response to radiation or drugs, whose results provide knowledge to improve the therapy outcome.
Angiogenesis that is essential for mataesis and invasion is an important process in tumor growth. Hence, inhibition of angiogenesis may attribute to tumor control. The use of anti-angiogenesis drugs in combination with radiotherapy should help to overcome the limitations of radiotherapy and to enhance therapeutic efficacy. TTA1 is a novel discovered compound having therapeutic effect in anti-agiogenesis, and has high cancer diagnostic and therapeutic value. Yet, little is known about how TTA1 and TTA1-like anti-angiogenesis compounds selected by project 1 modulate molecular pathways, and the cytotoxicity of TTA1 and TTA1-like anti-angiogenesis compounds also requires careful examination. Therefore, we will utilize microarray to study molecular mechanisms modulated by TTA1 and TTA1-like anti-angiogenesis compounds selected by project 1 in breast cancer cells and xenografted tumors, and study the cytotoxicity of TTA1 and TTA1-like compounds combined with/without radiation in the breast cancer cells. By using array analyses, we hope to elucidate how drugs combined with/without radiotherapy modulate genes involved in angiogenesis, proliferation, invasion, apoptosis, cell cycle progression, and motility processes in breast cancer cells and xenografted tumors, and examine whether those novel TTA1-like compounds enhance the curative efficacy of radiotherapy. Meanwhile, we will investigate transcriptional profiles in xenografted tumors to identify genetic characters at each stage of tumor progression compared with ultrasound imaging in sub-project 4. Identified genetic markers could be used to predict tumor progression in the future. Results from this study will provide information about modulation of expression profiles in breast cancer in response to radiation or drugs and provide knowledge to estimate the therapy outcome that might facilitate development of individual therapy in the future.
This report is designated for the sub-project 2 which aimed to use DNA microarray to identify differentially expressed genes, provide gene expression profiles for tissue-specific disease signature, and to map signal transduction pathway. This progress report is divided into two parts. The first part will talk about the development of a hyperspectral imaging system specifically for detecting light scattering spectra from metal naoparticles (MNPs) over large area. The second part of the report will discuss the construction of a xenograft model of nude mice injected with human breast cancer cell line, MDA.MB.231.
A. Hyperspectral imaging system for detecting light scattering spectra from MNPs
The objectives of this part of the sub-project for Year One are (1) design and assembly of a hyperspectral imaging system specifically for detecting light scattering spectra from MNPs over large areas, (2) characterization and selection of up to five MNPs as optical tags, and (3) proof-of-concept results of labeling and detecting DNA on glass substrate using the selected MNPs. A progress report on the project objectives during the first year (2007/08/01~2008/05/31) is described below.
A1. Hyperspectral imaging system
A1.1 Experimental setup
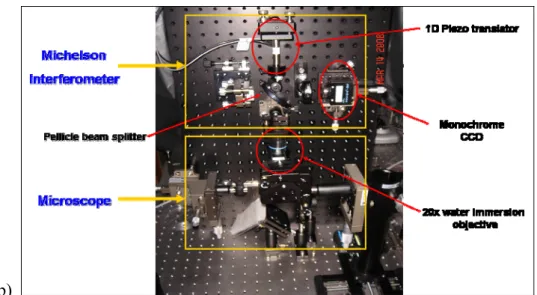
A schematic diagram of the designed hyperspectral imaging system is shown in Figure 1(a). Several changes to the originally proposed design were made. First, dark-field illumination and imaging were changed from reflectance to transmission mode in order to get higher contrast from the scattering of MNPs. Second, an optical power meter originally designed to monitor the light source intensity fluctuations was not adopted in the final setup because the Xe arc lamp was proved to have very high stability. Third, two lenses in front of the mirrors in the Michelson interferometer were not used to simplify the optical setup. A picture of the optical setup is shown in Figure 1(b). The major components we used in the optical setup include: Xenon arc lamp (Oriel, Apex 100W Xe), water immersion objective lens (Olympus, UMPLFL20XW), 2-axis motorized stage (Sigma, SGSP-20-85), Pellicle beam splitter (Thorlabs), piezo translator (PI, P-841.20), and monochrome CCD camera (Prosilica, EC1380).
(b)
Figure 1: Schematic diagram (a) and a photograph (b) of the white-light hyperspectral imaging system
A1.2 Numerical simulation of Fourier transform spectrometry (FTS)
Before measuring interferogram data with the hyperspectral imaging system, we developed a simulation tool using LabVIEW to simulate the process of generating spectral information in Fourier transform spectrometry. The simulation tool can be used to help diagnose the cause of any abnormality in the experimentally measured interferograms and the resulting spectra. For validating the tool, we generated time-varying electrical fields of a single frequency light source and calculated the interferogram and Fourier transform of the interferogram to obtain the spectrum of the light source. Figure 2(a)(b) show the interferograms and the corresponding spectra of two laser sources with wavelength of 488 nm and 653 nm, respectively. The resulting spectra show sharp peaks at correct wavelengths.
Figure 2: Simulated interferograms and FTS spectra of two laser sources.
We also simulated interferograms from a light source with a spectrum resembling the scattering spectrum of 32nm-diameter Au nanoparticles (Figure 3(a)) and Au nanorods (Figure
3(b)). A total mirror shift range of 5 μm was used for all simulations. Three values of mirror step size, 25, 50, 100nm, were used in the simulation. The results indicate that a step size of 100nm is sufficient to get MNP spectra without severe distortions. Compared with a shorter step size, we can acquire fewer images with a step size of 100nm so the acquisition time is reduced.
(a) (b)
Figure 3: Simulated interferograms and FTS spectra of (a) Au nanoparticles and (b) Au nanorods. The scattering spectra of the nanoparticles measured with the imaging spectrometer are also shown for comparison.
A1.3 Experimental results
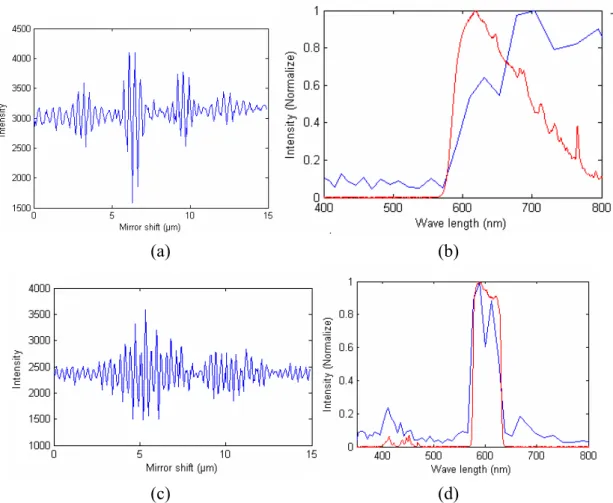
After mounting all components on an optical table, we used a laser as a light source to align the mirrors and the beam splitter in the interferometer. Then the zero optical path difference (OPD) location was found by manually translating the “fixed” mirror in the interferometer with the Xe lamp as the light source. In order to validate the function of the Fourier transform spectrometer, we used two lasers as the light sources and compared the spectra from FTS with those measured with an imaging spectrometer in our laboratory (Acton, SpectroPro SP-2150i; Andor, EMCCD). Figure 4(a) shows the interferogram obtained with 50nm step size and 0.4s exposure time. The spectrum of a 532nm laser is shown in Figure 4(b) in blue while the red curve is the spectrum measured by the spectrometer. Similar result was obtained with a 653nm laser (data not shown). The results indicate that the wavelength of monochromatic light can be accurately measured by the FTS.
(a) (b)
Figure 4: (a) Interferogram of a 532nm laser obtained with the FTS. (b) Spectrum from FTS is in blue and spectrum from spectrometer is in red.
Next, we measured the Xe lamp passing through filters with broad spectral bands to simulate white light scattering spectra from MNPs. Figure 5 shows the interferograms and spectra of a long-pass filter and a band-pass filter. The spectrum of the long-pass filter measured with the imaging spectrometer has lower intensity at longer wavelength, which can be attributed to lower efficiency of the grating used in the spectrometer.
(a) (b)
(c) (d)
Figure 5: Interferogram and spectra of (a)(b) a long-pass filter and (c)(d) a band-pass filter. The spectra in blue were obtained with FTS and red with the imaging spectrometer.
In order to show that the hyperspectral imaging system is capable of providing spectral information over the full field of view (FOV), we analyzed the interferograms obtained from the four corners in the FOV. The resulting spectra of the band-pass filter show the same bandwidth as shown in Figure 5(d). There exists a noticeable shift in wavelength, which is expected considering a slight increase in the OPD for off-axis locations. The location dependent changes in OPD can be calculated and corrected easily.
The spectral resolution of the current system was determined to be about 12nm from the measured laser spectra, which was larger than the expected value of 5nm. A resolution target was imaged by the system to determine the spatial resolution to be 1.3 μm. The FOV is 617μm × 465μm with the current optical setup, which agrees well with the values predicted by geometric optics. The FOV can be increased by using a lower power objective lens or a projection lens with a shorter focal length.
A1.4 Signal processing
When taking Fourier transform of the measured interferograms, one must consider several issues due to the fact that a discrete version of Fourier transform is performed instead of the theoretical continuous transform. Discrete Fourier transform implies that the signal to be transformed is periodic. Therefore, any discontinuity in the signal resulting from different values at the end points can introduce artifacts in the frequency domain, especially at high frequencies. One commonly used method to reduce this problem is zero padding, i.e. adding zero data points to both ends. A side benefit of zero-padding is decreased wavelength interval between adjacent points in the resulting spectrum due to increased data points in the interferogram, without actually moving more steps. Another problem is the finite range of mirror shift which is equivalent to a rectangular truncating window on the interferogram. The Fourier transform of a rectangular window is a sinc function which has many side lobes. To reduce the effect of sinc function on the resulting spectrum, one can apply a window function to the interferogram, which is called apodization. Figure 6 shows the results of applying the techniques of zero-padding and apodization to the interferogram of the band-pass filter. 256 zeros were added to each side of the interferogram. The apodization function was a triangular function with a total width of 10μm in mirror shift. It can be seen from the results that the dip in measured spectrum around 600nm was eliminated by apodization. Also, spectra with zero padding have a smoother appearance than the ones without.
Figure 6: Results of applying various signal processing steps prior to taking Fourier transform on the interferogram obtained from the band-pass filter.
We plan to use the developed simulation tool to find out the cause of the jagged appearance of the resulting spectra. Proper correction procedures can be employed once the cause of the problem is identified. The parameters that we suspect and plan to investigate include asymmetric sampling of the interferogram, fluctuations in OPD due to errors in positioning of the piezo translator and environmental vibrations, and noise in captured images by the CCD.
A2. Metal nanoparticle optical tags
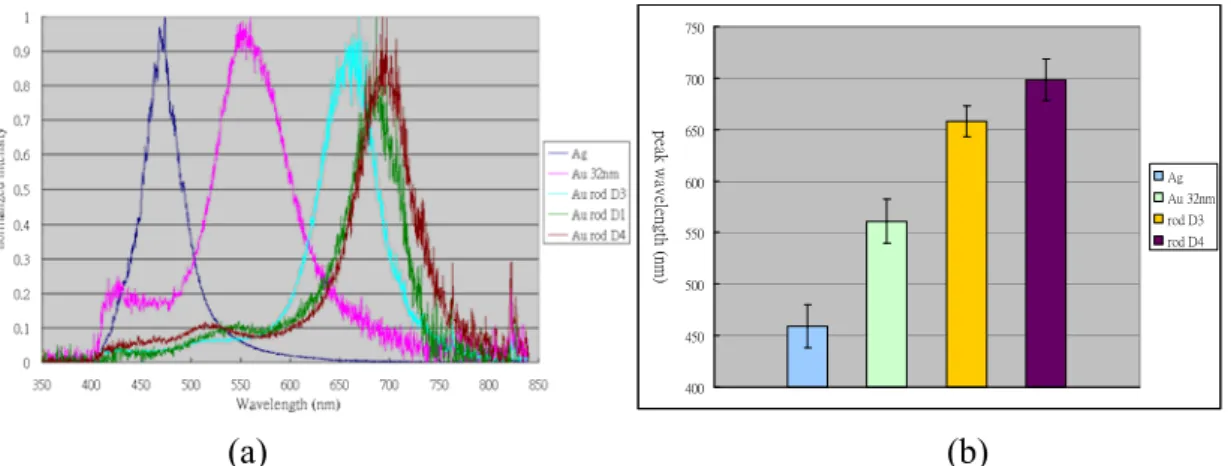
Au, Ag nanoparticles and Au nanorods were synthesized in Dr. Huan-Tsung Chang’s laboratory. We measured scattering spectra of MNPs with various sizes and shape using a line-scan hyperspectral imaging system that was developed in our laboratory (partly supported by the National Science Council NSC95-2218-E-002-063). Single particle can be clearly visualized under the dark field illumination/collection configuration that is incorporated into our system. Scattering spectra from single MNPs were obtained and Figure 7(a) shows the spectra from five types of selected particles. The peak wavelengths obtained from the selected MNPs are shown in Figure 7(b). Error bars indicate the standard deviations of 11-15 measurements on individual MNPs.
400 450 500 550 600 650 700 750 peak w av el en gt h (n m ) Ag Au 32nm rod D3 rod D4 (a) (b)
Figure 7: (a) Single MNP scattering spectra of selected types of MNPs. (b) Peak wavelength of the selected MNPs.
A3. Conjugation and detection of single-stranded DNA with MNPs
In this sub-project, MNPs will be used as optical tags for sensitive detection of DNA hybridization on microarrays. In Year One, synthesized single-stranded DNA molecules were conjugated to 32-nm Au nanoparticles via thiol functional groups incorporated into the DNA molecules. Labeling of DNA by MNPs and detection of hybridization events between complementary DNA sequences on a solid surface were tested and demonstrated in three sets of experiments with increasing complexities as described below.
A3.1 Conjugated single-stranded DNA hybridizes to complementary strands immobilized on glass surface
We started with the simplest binding scheme in which the target strand was conjugated to 32-nm Au nanoparticles and the probe strand was immobilized on surface of a glass slide. A single hybridization reaction was performed, followed by washing off the unbound DNA-MNP conjugates. A cartoon of the binding procedure and a photograph of such glass slides are shown in Figure 8. One each slide, one column of spots is for positive samples and the other for negative samples which have DNA probes with a non-complementary sequence.
(a) (b) (c)
Figure 8: (a)(b) Cartoon of the binding between complementary sequences. (c) Photograph of glass slides showing two columns of immobilized probe DNA, one with complementary sequence (positive) and the other not (negative).
The results of this experiment are shown in Figure 9. The picture of a positive spot shows a much higher density of bright particles (MNPs) than the picture of a negative spot. These pictures were captured with a color CCD camera mounted on the line-scan hyperspectral imaging system. The bright blue particles in the negative image are identified as contaminants and not MNPs because of their color.
Figure 9: Color pictures of a positive sample (left) and a negative sample (right).
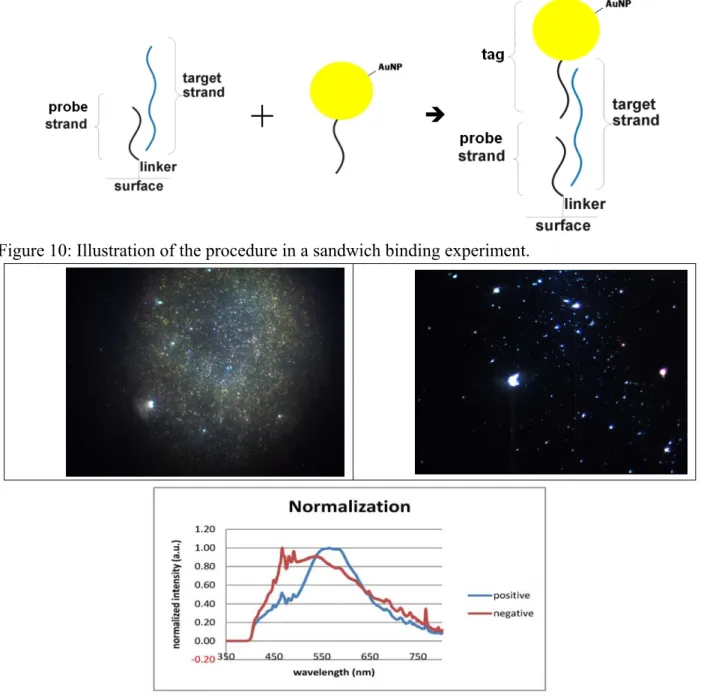
A3.2 Sandwich binding experiment with target strand bound to surface first
In this experiment we wanted to test a sandwich binding scheme where the target DNA strand was first hybridized to the immobilized probe strand. The Au particle conjugated detection strand was complementary to part of the target strand as shown in Figure 10. The sandwich complex was formed after a second hybridization reaction. The reason of conducting this experiment is because this is the most commonly used strategy reported in the literature for detecting DNA binding with MNPs. For negative spots, no target DNA was added in the first hybridization reaction. The results of this experiment are shown in Figure 11. It is obvious that the density of MNPs is much higher in the positive image than those in the negative image. Spectral measurements were performed at multiple areas within the positive and the negative
spots. Representative spectra are shown in Figure 11 and indicate that the spectral features of particles in the negative spots (nbn3-1, nbn4-1) are very different from those in the positive spots. Note that the spectra were normalized in intensity in order to illustrate the difference in the shape between the positive and negative samples.
+
Î
Figure 10: Illustration of the procedure in a sandwich binding experiment.
Figure 11: Color photographs of a positive spot (left) and a negative spot (right). The bottom graph shows normalized scattering spectra measured with the line-scan hyperspectral imaging system.
A3.3 Sandwich binding scheme with target strand bound to MNP first
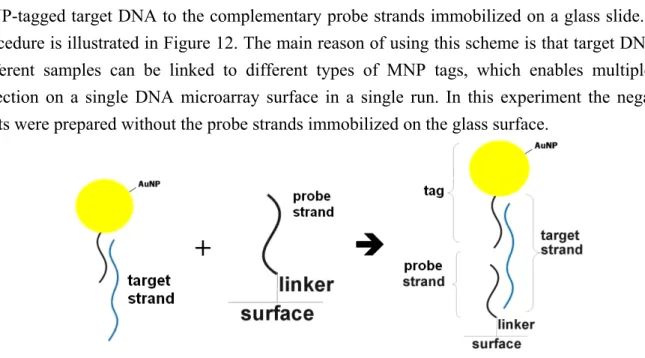
Finally, we tested the binding scheme which was what we proposed in the project proposal for multiplexed detection. A detailed description of this method can be found in the proposal. Briefly, a synthesized, thiol-functionalized poly-A DNA strand was conjugated to 32-nm Au nanoparticles. Then the DNA-Au conjugates were hybridized with the target DNA strand through a poly-T tail on the target DNA. A second hybridization reaction was performed to bind the
MNP-tagged target DNA to the complementary probe strands immobilized on a glass slide. The procedure is illustrated in Figure 12. The main reason of using this scheme is that target DNA in different samples can be linked to different types of MNP tags, which enables multiplexed detection on a single DNA microarray surface in a single run. In this experiment the negative spots were prepared without the probe strands immobilized on the glass surface.
+
Î
Figure 12: Illustration of the procedure in the second sandwich binding experiment.
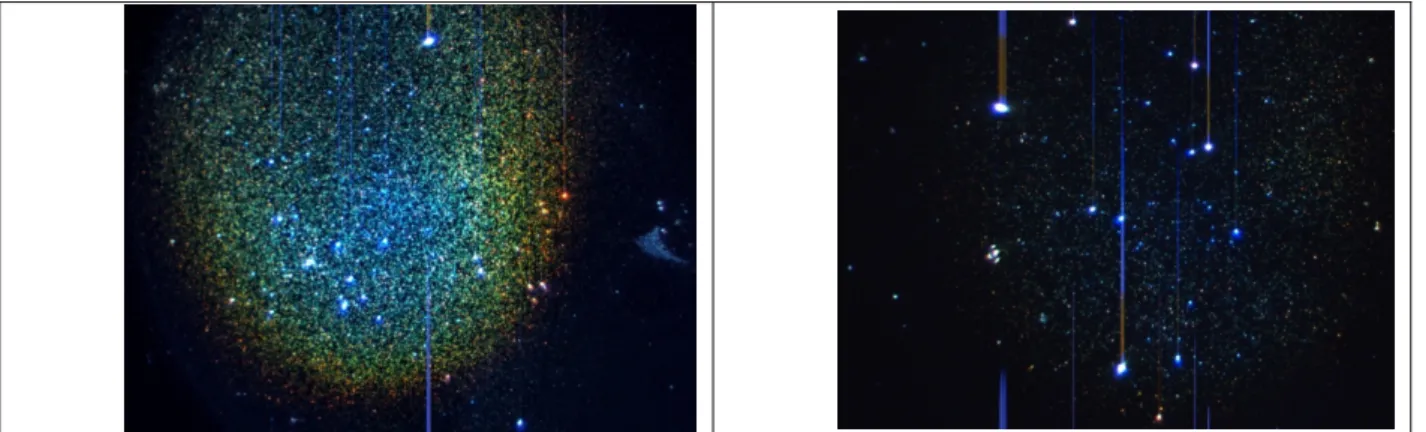
Representative dark-field images of a positive spot and a negative spot are shown in Figure 13. As in the previous two experiments, the density of MNP in the positive image is much higher than that in the negative image. Spectral measurements were again performed with the line-scan hyperspectral imaging system. As seen in Figure 13, the difference in spectral features between the positive and negative spots is obvious. However, we noticed that the peak wavelength in the measured scattering spectra of MNPs is somehow longer than what we measured from non-conjugated MNPs (Figure 7). This might indicate a red-shift in the resonance frequency resulting from either conjugation of MNPs with DNA molecules or coupling of the surface plasma between neighboring MNPs or both. We will investigate this phenomenon in the second year.
Figure 13: Color photographs of a positive spot (left) and a negative spot (right) in a second sandwich binding experiment. The bottom graph shows normalized scattering spectra measured with the line-scan hyperspectral imaging system.
In conclusion, we finished the construction of the FTS-based hyperspectral imaging system and characterized spectral and spatial capabilities of the system. The major remaining work in Year One will be to obtain scattering spectra from MNPs on glass slides. In addition, we will try to improve the quality of spectral data by using digital signal processing techniques. During the first year of the project we also demonstrated labeling of DNA with MNPs and detection of complementary DNA molecules on solid surface using MNP tags. In the remaining time of Year One and the first half of Year Two, we will optimize all of the protocols and quantify the sensitivity, specificity and dynamic range of detecting DNA molecules using the sandwich binding format and the FTS hyperspectral imaging system. The issue of red-shifts in scattering spectra of MNPs needs to be carefully examined and well controlled in order to make the project successful.
B. Construction of a xenograft model of nude mice injected with human breast cancer cell line, MDA.MB.231
B1. Objective
Angiogenesis is a very important process for tumor invasion and metastasis. Therefore, inhibiting angiogenesis is a curial step in controlling tumor growth. Applying drugs that inhibit angiogenesis can lessen the restriction on the amount of radiotherapy being used on patients and therefore increase its treatment outcome. Nude mice have been widely used to study angiogenesis and drug mechanics, and the breast cancer cell line, MDA.MB.231 has been used in many breast cancer mechanism and drug research. This study will use BABL/c null mice and induce the in
vivo tumor angiogenesis mechanism to study its drug resistance, and use it for the newly
developed imaging system.
We proposed an integrated approach to investigating anti-cancer treatment response of individual breast cancer patient. The main purpose of this project was to explore an integrated approach for individualized medicine that includes clinical research, genetic data analysis, and molecular imaging and information technologies. We selected peptide aptamers and proposed TTA-1 and TTA1-like compounds as our lead compound. Unfortunately, after several weeks of effort to purchase TTA-1 and searching for synthetic partner to generate these specific target compounds, we concluded that we were not able to continue this project with aptamers in time.
To continue this study, we selected another novel compound TW-01 with similar targeted properties on the angiogenesis in blood vessels with high specificity and strong affinity. We then precede our proposed research after switching targeted molecules to treat 3 different breast cancer cell lines with chemotherapy and/or radiation therapy, and assess the curative effect by examining molecular characterization using microarray analysis and in vivo targeted imaging on xenografted tumors along with molecular modeling techniques as scheduled.
TW01 is an anti-cancer drug designed by Taiwanese scholars, but the effects of this drug is not fully understood. Using computer model, it’s speculated that the drug might inhibit SFKs (Src-family kinase) proteins. In order to understand the anti-cancer mechanism and to use the computer model to evaluate the drug, nude mice is used to investigate the inhibiting mechanism and effects of TW01. Ultrasound was also applied to study the effect of TW01 on nude mice. Combining chemotherapy and radiation therapy, DNA microarray will use to study the gene expression of the tumor to improve the treatment outcome expectation and gain further understanding on tumor growth.
Breast cancer has been the leading cause of death in women in Taiwan. In order to advance the therapy of breast cancer and to estimate the combined effects of radiotherapy and TW01-like compounds, we will establish a platform to survey the molecular response to TW01 and novel TW01-like compounds selected by sub-project 1, in breast cancer cells and xenografted tumors.
The objective for this sub-group in the first year, is to develop an in vitro system using the breast cancer cell line MDA.MB.231 and an in vivo system using xeno-transplantation of human
breast cancer cells into mice will be established, and the cytotoxicity and gene expression profiles in MDA.MB.231 cells and xenografted tumors following treatments of TW01 coupled with/without radiotherapy will be studied.
The aims of our project are:
1. To study cytotoxicity of TW01 or TW01-like compounds in combination with/without radiation in breast cancer cells, and to examine whether the treatment of chemotherapy using TW01 or new therapeutic TW01-like compounds could increase sensitivity of breast cancer cells or xenografted tumors to radiation.
2. To compare the differences of gene expression profile between in vitro system (in breast cancer cells) and in vivo system (in xenografted tumors) following the treatment of TW01 or TW01-like compounds selected by sub-project 1 combined with/without radiotherapy. This study will help us to discover new TW01-like compounds for breast cancer therapy.
B2. Literature review
Nude mice model has been used in studying angiogensis and also in many other research models, which included the tumor xenograft of human breast cancer cell line, MDA.MB.231 to study cell proliferation and death phenomenon, studies on tumor cell angiogenesis, and the tumor xenograft experiment to study the anti-cancer drug effect [52-54]. Therefore, nude mice was selected for this study to observe the angiogenesis in breast cancer and used for studying the outcome of combined chemotherapy and radiation therapy [55, 56]. Aptamers are oligonucleic acid or peptide molecules that bind a specific target molecule. It has the capacity to mimic the shape of any antigen in the blood, therefore, the ligants of the specific proteins such as fibronectin and tenascin being induced during angiogenesis can be used as targets when designing
anti-cancer drug. Apatmers modified with DNA can connect to biological molecules such as toxin or cytokine to eliminate solid tumor [57-59]. However, since it is extremely hard to find the place to synthesis apatmers in Taiwan, the TW01 anti-cancer drug developed by the Pharmaceutical Department in Taipei Medical University was used instead to study the effect of inhibiting angiogenesis. After comparing the structure using a computer model, it was found that TW01 may be inhibitor for SFKs kinase activity, of which the combing site might be Abl. Proteins such as Fyn also have highly similar active sites. It had been indicated that SFKs is related to tumor development and angiogenesis [60]. Past studies have found that the size and the rate of growth of solid tumor depend on its blood supply, and that cutaneous tumors will induce angiogenesis right away. Therefore, the newly developed cells on the surface which come in contact with blood and newly developed tumor have become an important target for cancer treatment. Protein
expressed on the blood vessel surface such as αvβ3 is a good target to study angiogenesis [61]. Using the expression of αvβ3, the protein can be located on the newly developed blood vessel, and this can be use to study the effect of TW01 on tumor. This model can be applied on microarray as well to select a new marker for gene expression [62]. Through the development of nude mice model, ultrasound, drug study, and microarray, together they can achieve new understandings on the treatment effectiveness of combine chemotherapy and radiotherapy on breast cancer patients.
B3. Material and Method
B3.1. Model Animal and Cell Culturing
The 4-6 weeks old female mice were provided by the National Experimentation Animal Center, and were grew in the National Taiwan University Animal Research Center. The human breast cancer cell, MDA.MB.231 (Biological Resource Preservation and Research Center) were cultured in L15 medium with 10% fetal bovine serum (FBS; GIBCO-BRL) at 37°C incubator.
B3.2. Xenograft model
Different numbers of MDA.MB.321 cells were applied trypsin to detach from the plate and were centrifuged before mixing with 0.1mL PBS or Matrigel (1:1 with PBS). Using 10G needle, the cell mix was injected subcutaneously on the hind leg of the nude mice. The diameter of the tumor was measure every week. Ultrasound was applied on the mice three weeks after the injected and was sacrificed after the experiment to obtain the solid tumor sample. RNA was extracted from half of the tumor and the other half was used for immuno-staining to exam the expression of αvβ3.
B3.2. Total RNA extraction, cDNA synthesis and cye dye labeling
Total RNA from MDA.MB.231 and dissected xenografted tumor tissues after treatment will be isolated using TRIzol® reagent (Invitrogen, Carlsbad, CA). Universal Human Reference RNA (Stratagene, La Jolla, CA) will be used as reference.Spectrophotometry will be used to determine RNA concentration. For probe labeling, 20 μg or 40 μg RNA will be added into labeling mixture. The labeling reactions will be performed during reverse transcription in the presence of poly-dT primers; 0.5 mM each dATP, dCTP, and dGTP; 0.2 mM dTTP; 0.1 mM Cy-dUTP (0.1 mM Cy3 or Cy5) (Roche Molecular Biochemicals; Mannheim, Germany); 5X first strand buffer; 0.01 M DTT; 1 unit/μl Ribonuclease inhibitor (Invitrogen, Carlsbad, CA); and 10 units/μl of superscript II reverse transcriptase (Invitrogen, Carlsbad, CA) in a 40 μl solution. The reaction mixture will be incubated at 42 °C for 90 minutes. The RNA will be degraded by adding of 5 μl of 500 mM EDTA and 10 μl of 1 M NaOH incubation at 65 °C for 45 mins. The labeled samples will be neutralized by addition of 25 μl of 1 M Tris. Labeled probe will be purified with Bio-Spin 6 columns (Bio-Rad, Hercules, CA. USA) to remove unlabeled fluoresce dyes, and followed used microcon YM-30 (Millipore, Bedford, MA) columns to concentrate the probe.
B3.3 Microarray analysis and statistical analysis
20k oligo-array slides will be pre-hybridized for at least one hour at 42°C with 40 µl of pre-hybridization solution consisting of 5 × SSC, 0.1% SDS, and 1% BSA. Pre-hybridization solution will be washed off by rapidly plunging the slides in distilled water for 2 minutes, followed by 100% isopropanol for 2 minutes. Slides will be allowed to air dry prior to sample
hybridization. Cy3 and Cy5 labeled targets will be combined together for hybridization after dye-coupled cDNA purification. One µl of human COT-1 DNA (Invitrogen) and 1 µl of poly-d (A) 40–60 (Amersham Biosciences) will be added to each tube. Targets will be denatured at 100°C for 1 minute before snap cooling on ice. 20 µl of pre-warmed (42°C) 2 × Hybridization Buffer (50% form amide, 10 × SSC, 0.2% SDS) will be added to each sample. The combined target/hybridization solution mixture will be incubated at 42°C for one minute, mixed and loaded onto microarray slides. Humidity will be maintained in each chamber through the addition of 20 µl of DEPC water. Slides will then be hybridized at 42°C overnight. Post-hybridization washing include: 5 minutes in 2 × SSC + 0.1% SDS, 5 minutes in 1 × SSC, 5 minutes in 0.2 × SSC, and finally 1 minute in 0.05 × SSC. Slides will be dried in a centrifuge at 650 rpm for 3 minutes. Then, slides will be scanned at 10 μm resolution using a GenePix 4000B scanner (Axon Instruments), and images and data will be stored in a database for further analysis. The Cy5-labeled cDNAs will be scanned at 635 nm, and the Cy3-labeled cDNA samples will be scanned at 532 nm. The resulting TIFF images will be analyzed by GenePix Pro 6.0 software (Axon Instruments, Inc.). The ratios of the sample intensity to the reference intensity (red: green) for all of the targets will be determined. NTUMAPs web-based analysis platform will be utilize to evaluate the intensities of each hybridization signal, analyze data, and generate visual representations of results.
B3.4. Immuno-staining
The extracted tumor was submerged in Acetone (Sigma) for 10 minutes, after the acetone was fully soaked, it was transferred to National Taiwan University Hosipital for αvβ3 staining.
B4. Result and Discussion
The objective for this sub-project in the first year, is to develop an in vitro system using the breast cancer cell line MDA.MB.231 and an in vivo system using xeno-transplantation of human breast cancer cells into mice will be established, and the cytotoxicity and gene expression profiles in MDA.MB.231 cells and xenografted tumors following treatments of TW01 coupled with/without radiotherapy will be studied.
To established a tumor xenograft model, first the concentration of cell number being used for the xenograft mush be found. Therefore, different cell numbers of MDA.MB.231 were tested for the subcutaneous injection. Three weeks after the injection the mice was sacrificed for observation, as shown in Table 1. One week after the injection, only the injections with cell numbers 108 and 5*107 generated apparent tumor growth, in addition, the injection with 107 had a tumor >1mm developed three weeks after the injection (Figure 1). 5*106 and106 did not have tumor forming within three weeks of the injection.
During the experiment, it was found that the number of time the cell line, MDA.MB.231, being subcultured was related to the xenograft tumor development. After 31 passages, 1*106 and 1*107 MDA.MB.231would not form tumor on the nude mice. When using cells with fewer
numbers of passages, such as 12 passages, generate a better xenograft tumor development comparing to the one with higher number of passages, such as 31 passages. Therefore, before injection, it is important to use younger cells which have fewer passages to avoid the problem of poor xenograft tumor development. The cell line, MDA.MB.231, was cultured in RPMI
1640+10% FBS, however, with the increase of cell line passage, the growth condition seemed to degenerate, therefore, it was switched to be culture in L15 culturing plate with 10% FBS. This made the cell grew better.
Since 108 was a large cell number, it was time consuming and resource wasting. Therefore, the cell number of 5*107 was used for the later experiments. The first ultrasound result was shown in Figure 2, the tumor image was not very clear. In order to study the angiogenesis process in side a solid tumor, a tumor with diameter larger than 5mm must be formed. Reasons such as cells attaching to the surface of the container when dissolving in PBS cause the tumor to have a slower growth rate and made the tumor harder to form. Therefore, we mixed the PBS in 1:1 Matrigel (BD) in order to provide a more stable environment for tumor growth. Matrigel is a water-soluble gelatinous protein mixture secreted by mouse tumor cells, the main components are laminin, gelatinous protein IV, and entactin. It also has growth factors such as TGF-β, FGF, and tPA. At 37°C, Matrigel will agglomerate similar cell lamin materials in order to provide better cell survival and growth environment. Figure 3 and Table 1 showes the injection using Matrigel. The size of the tumor grown from cells injection with Matrigel is shown in Figure 4. Two weeks after the injection, tumor was formed with faster rate; three to four weeks after the tumor grew to an estimated 100mm3 size (Figure 5) and it was ready for further experiments.
Tumors grew with time, and nude mice might start to initiate mating two weeks after the injection. The tumor xenograft was possible to cause physiological change, for example, the mice was found to have better appetite. Therefore, when the tumor start to develop, it is very important to observe the physiological change in the mice in order to avoid mice attaching each other which would result in the failure of experiments.
Table 1. Sizes of Tumor after the Injection of MAD.MB.231. The number indicated the
external tumor diameter measured in mm.
Figure 1. Three weeks after the injection with PBS. The red circle indicates the position of
the tumor.
Figure 2. Ultrasound result showing the position of the tumor. The red circle is the position
Figure 3. The comparison of Injection using PBS and Matrigel. A) injection using PBS. B)
injection using Matrigel. The scale bar is 5mm.
Figure 4. The change of tumor appearance. A) One week after injection. B) Two weeks
after injection. C) Three weeks after injections. The number of cells being injected was 5*107 per mice.
B5. Future plan
We have constructed the xenograft model of nude mice injected with human breast cancer cell line, MDA.MB.231 in the first year of the experiment. The next step is to apply the anti-cancer drug TW01 (30mg/body-weight) in order to evaluate the outcome of combine chemotherapy and radiation treatments. In addition to combine with the ultrasound imaging to study the tumor in vivo condition with TW01 treatment, to use immuno-staining to affirm the angiogenesis marker αvβ3 protein expression in the tumor, and to match the similarity of the angiogenesis status with the ultrasound image. After the ultrasound image analysis, the tumor will be removed and it RNA will be extracted, reversely transcribed for cDNA microarray to study the effect of TW01 and radiation treatment on the gene expression profile, in order to screen the treatment molecular marker to study the tumor cell anti-cancer mechanism. With the co-investigations of drug effect discovery and computer model analysis, a new drug modification and development method will be underway.
The specific goals for the future are described as followed.
In the second year, the therapeutic effect of TW01-like compounds selected from sub-project 1 in the breast cancer cell line, MAD.MB.231, and xenografted tumors will be studied to discover the therapeutic new drug for different breast cancer. We will apply different TTA1-like compounds which are selected or found by sub-project 1 combined with/without radiotherapy to MCF-7 cells and mice. In addition to examine the curative effect of new compounds, the cytotoxicity of the treatments of newly discovered TW01-like compounds combined with/without radiotherapy in MAD.MB.231 cells will be studied by estimating the surviving fraction of cells. Gene expression profiles after the treatments of newly discovered TW01-like compounds combined with/without radiotherapy in MCF-7 cells will be studied using microarray. The modulation of gene expression profiles following the treatments of newly discovered TW01-like compounds combined with/without radiotherapy in xenografted tumors will be investigated using microarray analysis.
In the third year, the most effective TW01-like compound identified in the study of the second year will be selected to treat other breast cancer cell lines. This study will help us to estimate the therapeutic effect of new drug in different breast cancer types. Based on results of the second year, the most effective TW01-like compound will be chosen to treat other 3 different breast cancer cell lines. The curative effect of the most effective compound will be estimate by detecting cytotoxicity and examining molecular characterization using microarray analysis.
Reference
1. Shen, Y.C., et al., Significant difference in the trends of female breast cancer
incidence between Taiwanese and Caucasian Americans: implications from age-period-cohort analysis. Cancer Epidemiol Biomarkers Prev, 2005. 14(8): p. 1986-90.
2. Chen, C.J., et al., Cancer epidemiology and control in Taiwan: a brief review. Jpn J Clin Oncol, 2002. 32 Suppl: p. S66-81.
3. Lee, M.M., et al., Breast cancer and dietary factors in Taiwanese women. Cancer Causes Control, 2005. 16(8): p. 929-37.
4. Cheng, S.H., et al., Unique features of breast cancer in Taiwan. Breast Cancer Res Treat, 2000. 63(3): p. 213-23.
5. Maity, A., et al., Potential molecular targets for manipulating the radiation
response. Int J Radiat Oncol Biol Phys, 1997. 37(3): p. 639-53.
6. Ward, J.F., DNA damage produced by ionizing radiation in mammalian cells: identities, mechanisms of formation, and reparability. Prog Nucleic Acid Res Mol Biol,
1988. 35: p. 95-125.
7. Kelland, L.R., S.M. Edwards, and G.G. Steel, Induction and rejoining of DNA
double-strand breaks in human cervix carcinoma cell lines of differing radiosensitivity.
Radiat Res, 1988. 116(3): p. 526-38.
8. Schwartz, J.L., et al., Faster repair of DNA double-strand breaks in
radioresistant human tumor cells. Int J Radiat Oncol Biol Phys, 1988. 15(4): p. 907-12.
9. Wlodek, D. and W.N. Hittelman, The repair of double-strand DNA breaks
correlates with radiosensitivity of L5178Y-S and L5178Y-R cells. Radiat Res, 1987. 112(1):
p. 146-55.
10. Yacoub, A., et al., MAPK dependence of DNA damage repair: ionizing
radiation and the induction of expression of the DNA repair genes XRCC1 and ERCC1 in DU145 human prostate carcinoma cells in a MEK1/2 dependent fashion. Int J Radiat Biol,
2001. 77(10): p. 1067-78.
11. Hagan, M., et al., Ionizing radiation-induced mitogen-activated protein (MAP)
kinase activation in DU145 prostate carcinoma cells: MAP kinase inhibition enhances radiation-induced cell killing and G2/M-phase arrest. Radiat Res, 2000. 153(4): p.
371-83.
12. Moustacchi, E., DNA repair pathways and dose responses to ionizing
radiations. C R Acad Sci III, 1999. 322(2-3): p. 139-41.
13. Yacoub, A., et al., Epidermal growth factor and ionizing radiation
up-regulate the DNA repair genes XRCC1 and ERCC1 in DU145 and LNCaP prostate carcinoma through MAPK signaling. Radiat Res, 2003. 159(4): p. 439-52.
14. Artuso, M., et al., The role of the Ataxia telangiectasia gene in the p53,
WAF1/CIP1(p21)- and GADD45-mediated response to DNA damage produced by ionising radiation. Oncogene, 1995. 11(8): p. 1427-35.
transcription of p21waf/cip1/sdi1 in SCID mice following gamma-irradiation. Biochimie,
1997. 79(9-10): p. 607-12.
16. Shan, B., et al., Induction of p53-dependent activation of the human
proliferating cell nuclear antigen gene in chromatin by ionizing radiation. J Biol Chem,
2003. 278(45): p. 44009-17.
17. Kharbanda, S., et al., Activation of the pp90rsk and mitogen-activated
serine/threonine protein kinases by ionizing radiation. Proc Natl Acad Sci U S A, 1994.
91(12): p. 5416-20.
18. Woloschak, G.E., P. Felcher, and C.M. Chang-Liu, Expression of cytoskeletal
and matrix genes following exposure to ionizing radiation: dose-rate effects and protein synthesis requirements. Cancer Lett, 1995. 92(2): p. 135-41.
19. Eichholtz-Wirth, H. and D. Sagan, Altered signaling of TNFalpha-TNFR1
and SODD/BAG4 is responsible for radioresistance in human HT-R15 cells. Anticancer
Res, 2002. 22(1A): p. 235-40.
20. Legue, F., et al., IL-6 a key cytokine in in vitro and in vivo response of Sertoli
cells to external gamma irradiation. Cytokine, 2001. 16(6): p. 232-8.
21. Hallahan, D.E., et al., The interaction between recombinant human tumor
necrosis factor and radiation in 13 human tumor cell lines. Int J Radiat Oncol Biol Phys,
1990. 19(1): p. 69-74.
22. Haimovitz-Friedman, A., et al., Protein kinase C mediates basic fibroblast
growth factor protection of endothelial cells against radiation-induced apoptosis. Cancer
Res, 1994. 54(10): p. 2591-7.
23. Haimovitz-Friedman, A., et al., Autocrine effects of fibroblast growth factor
in repair of radiation damage in endothelial cells. Cancer Res, 1991. 51(10): p. 2552-8.
24. Uckun, F.M., et al., Effects of recombinant growth factors on radiation
survival of human bone marrow progenitor cells. Int J Radiat Oncol Biol Phys, 1989.
16(2): p. 415-35.
25. Kasid, U., et al., Effect of antisense c-raf-1 on tumorigenicity and radiation
sensitivity of a human squamous carcinoma. Science, 1989. 243(4896): p. 1354-6.
26. Pirollo, K.F., et al., raf involvement in the simultaneous genetic transfer of the
radioresistant and transforming phenotypes. Int J Radiat Biol, 1989. 55(5): p. 783-96.
27. Samid, D., et al., Increased radiation resistance in transformed and
nontransformed cells with elevated ras proto-oncogene expression. Radiat Res, 1991.
126(2): p. 244-50.
28. Pardo, F.S., et al., Transfection of rat embryo cells with mutant p53 increases
the intrinsic radiation resistance. Radiat Res, 1994. 140(2): p. 180-5.
29. Russell, K.J., et al., Abrogation of the G2 checkpoint results in differential
radiosensitization of G1 checkpoint-deficient and G1 checkpoint-competent cells. Cancer
Res, 1995. 55(8): p. 1639-42.
target in cancer chemotherapy and radiotherapy. Pathol Biol (Paris), 2006. 54(4): p.
185-93.
31. Baluna, R.G., T.Y. Eng, and C.R. Thomas, Adhesion molecules in
radiotherapy. Radiat Res, 2006. 166(6): p. 819-31.
32. Cordes, N., et al., Irradiation differentially affects substratum-dependent
survival, adhesion, and invasion of glioblastoma cell lines. Br J Cancer, 2003. 89(11): p.
2122-32.
33. Cordes, N. and C. Beinke, Fibronectin alters cell survival and intracellular
signaling of confluent A549 cultures after irradiation. Cancer Biol Ther, 2004. 3(1): p.
47-53.
34. Park, C.C., et al., Ionizing radiation induces heritable disruption of epithelial
cell interactions. Proc Natl Acad Sci U S A, 2003. 100(19): p. 10728-33.
35. Barcellos-Hoff, M.H., Integrative radiation carcinogenesis: interactions
between cell and tissue responses to DNA damage. Semin Cancer Biol, 2005. 15(2): p.
138-48.
36. von Essen, C.F., Radiation enhancement of metastasis: a review. Clin Exp Metastasis, 1991. 9(2): p. 77-104.
37. Chiquet-Ehrismann, R. and M. Chiquet, Tenascins: regulation and putative
functions during pathological stress. J Pathol, 2003. 200(4): p. 488-99.
38. Erickson, H.P. and M.A. Bourdon, Tenascin: an extracellular matrix protein
prominent in specialized embryonic tissues and tumors. Annu Rev Cell Biol, 1989. 5: p.
71-92.
39. Ioachim, E., et al., Immunohistochemical expression of extracellular matrix
components tenascin, fibronectin, collagen type IV and laminin in breast cancer: their prognostic value and role in tumour invasion and progression. Eur J Cancer, 2002. 38(18):
p. 2362-70.
40. Jahkola, T., et al., Expression of tenascin in invasion border of early breast
cancer correlates with higher risk of distant metastasis. Int J Cancer, 1996. 69(6): p.
445-7.
41. Huang, W., et al., Interference of tenascin-C with syndecan-4 binding to
fibronectin blocks cell adhesion and stimulates tumor cell proliferation. Cancer Res, 2001.
61(23): p. 8586-94.
42. Ruiz, C., et al., Differential gene expression analysis reveals activation of
growth promoting signaling pathways by tenascin-C. Cancer Res, 2004. 64(20): p.
7377-85.
43. Eferl, R. and E.F. Wagner, AP-1: a double-edged sword in tumorigenesis. Nat Rev Cancer, 2003. 3(11): p. 859-68.
44. Giles, R.H., J.H. van Es, and H. Clevers, Caught up in a Wnt storm: Wnt
signaling in cancer. Biochim Biophys Acta, 2003. 1653(1): p. 1-24.
radioimmunotherapy of high-grade malignant glioma--phase I and II study. Acta Oncol,
1999. 38(3): p. 351-9.
46. Reardon, D.A., et al., Phase II trial of murine (131)I-labeled antitenascin
monoclonal antibody 81C6 administered into surgically created resection cavities of patients with newly diagnosed malignant gliomas. J Clin Oncol, 2002. 20(5): p. 1389-97.
47. Hicke, B.J., et al., Tenascin-C aptamers are generated using tumor cells and
purified protein. J Biol Chem, 2001. 276(52): p. 48644-54.
48. Moran, C.J., et al., RANTES expression is a predictor of survival in stage I
lung adenocarcinoma. Clin Cancer Res, 2002. 8(12): p. 3803-12.
49. Nakamura, H., et al., cDNA microarray analysis of gene expression in
pathologic Stage IA nonsmall cell lung carcinomas. Cancer, 2003. 97(11): p. 2798-805.
50. Beer, D.G., et al., Gene-expression profiles predict survival of patients with
lung adenocarcinoma. Nat Med, 2002. 8(8): p. 816-24.
51. Garber, M.E., et al., Diversity of gene expression in adenocarcinoma of the
lung. Proc Natl Acad Sci U S A, 2001. 98(24): p. 13784-9.
52. Bauerle, T., et al., Bevacizumab inhibits breast cancer-induced osteolysis,
surrounding soft tissue metastasis, and angiogenesis in rats as visualized by VCT and MRI. Neoplasia, 2008. 10(5): p. 511-20.
53. O'Neill, C.F., et al., Notch2 signaling induces apoptosis and inhibits human
MDA-MB-231 xenograft growth. Am J Pathol, 2007. 171(3): p. 1023-36.
54. Song, C., et al., Thermographic assessment of tumor growth in mouse
xenografts. Int J Cancer, 2007. 121(5): p. 1055-8.
55. Chang, Y., et al., Secretion of pleiotrophin stimulates breast cancer
progression through remodeling of the tumor microenvironment. Proc Natl Acad Sci U S
A, 2007. 104(26): p. 10888-93.
56. Fournier, L.S., et al., MR monitoring of cyclooxygenase-2 inhibition of
angiogenesis in a human breast cancer model in rats. Radiology, 2007. 243(1): p. 105-11.
57. Franch, R., et al., Differential availability/processing of decorin precursor in
arterial and venous smooth muscle cells. J Anat, 2006. 209(3): p. 271-87.
58. Gazzaniga, P., et al., Tenascin C and epidermal growth factor receptor as
markers of circulating tumoral cells in bladder and colon cancer. Oncol Rep, 2005. 14(5):
p. 1199-202.
59. Schirner, M., et al., Molecular imaging of tumor angiogenesis. Ann N Y Acad Sci, 2004. 1014: p. 67-75.
60. Bauman, J.E., K.D. Eaton, and R.G. Martins, Antagonism of platelet-derived
growth factor receptor in non small cell lung cancer: rationale and investigations. Clin
Cancer Res, 2007. 13(15 Pt 2): p. s4632-6.
61. Lim, E.H., et al., A review: Integrin alphavbeta3-targeted molecular imaging
and therapy in angiogenesis. Nanomedicine, 2005. 1(2): p. 110-4.
cells following single versus fractionated doses of radiation. Cancer Res, 2007. 67(8): p.
AACR ANNUAL MEETING 2008
April 12-16,2008
San Diego Convention Center
San Diego,California
Presentation Title: Identification of genomic signatures in African-American and
Caucasian-American early-onset breast cancer.
1. Although the incidence of breast cancer in the U.S. is highest overall in
Caucasian-American (CA) women, breast cancer in young women occurs at a higher frequency in African-Americans (AA). AA women present with more aggressive disease and, as a consequence, the mortality rates due to breast cancer in this population are higher than those of their CA counterparts across all age groups. AA tumors are more likely to be hormone receptor negative, have higher nuclear and histological grade, exhibit p53 mutations and present at an advanced stage. Tumors in young AA women are more often characterized as basal ‘triple negative’ breast tumors, the breast cancer subtype most difficult to treat.
2. Many factors have been proposed to contribute to breast cancer disparities in AA women. To begin to understand the genetic component of breast cancer disparities, we are investigating genomic signatures of breast tumors from Alabama women. We hypothesized that the differences in tumor phenotype observed between AA and CA early onset breast tumors correlate with specific patterns of genomic aberrations. Our initial study includes 25 AA and 47 CA patients diagnosed with breast cancer at or below the age of 50. Compared to CA women, AA women were significantly more likely to present with grade 3 tumors and tumors of the basal subtype.
3. Immunohistochemical analysis of expression of the tumor suppressors p53 and p27 showed a trend towards a poor prognostic profile in AA women. Using high
resolution, whole genome array comparative genomic hybridization, age and grade matched tumors were analyzed for genomic aberrations. Both CA and AA tumors demonstrated complex genomic profiles. A subset of loci was identified that are differentially altered based on ethnicity. In addition, copy number variations have been identified that discriminate breast tumors based on tumor subtype. These studies may lead to the identification of loci that contribute to the increased incidence and aggressiveness of early onset breast cancer in AA women.
Presentation Title: Molecular profile of Mantle Cell Lymphoma revealed by
microRNA , mRNA and CGH analysis.
1. Mantle Cell Lymphoma (MCL) represents the 5-10% of Non-Hodgkin lymphomas. Originated from mantle-lymph node cells, it is characterized by a t(11;14)
translocation, which leads to Cyclin D1 overexpression.
2. MCL shows a quite homogeneous morphology, a characteristic expression profile and a relatively low proliferation rate. The survival probability at 5-yrs is lower than 30%, but it has been reported a better prognosis in a small group of cases, which means that a certain heterogeneity among patients can be identified.
3. In the last few years, a growing number of microRNAs are being found to be deregulated in different types of lymphomas and other malignancies, in which they are thought to act as tumor suppressors inhibiting the expression of different oncogenes. Moreover, microRNA profiling has been described as a useful tool for classifying human tumors.
4. Here we explored the miRNA expression profile of 20 MCL cases and 5 reactive tonsils using the miRNA microarray platform from Agilent Technologies that contains 15K spots corresponding to 470 human miRNAs and 64 human viral miRNAs. We also studied the gene expression and chromosomal status of these samples using Agilent microarrays (gene expression and CGH) platforms.
5. MCL presents a unique miRNA signature revealing overexpression of 15 miRNAs and downregulation of 50 miRNAs in at least 50% of the cases, when compared with the average expression level of the controls. Some of these miRNAs have already been described in other tumor types, such as miR-143 and miR-145 downregulated in B-cell malignancies.
6. Moreover, an integrated analysis of miRNA expression data with gene expression data revealed an inverse correlation between the expression level of some miRNAs and their potential target genes, some of them constituting the characteristic gene expression signature of MCL. That is the case of overexpression of genes from NFkB family (Rel, RelA, NFkB1, and NFkB2) and downregulation of miR-184, miR-133a, and miR-138 (which potentially regulate these genes); and overexpression of AKT vs. downregulation of miR-200b, miR-200c, miR-184, and miR-429. Chromosomal status in MCL is more heterogeneous than miRNA and mRNA expression profiles and could be only partially correlated. Nevertheless, several chromosomal losses could explain the downregulation of some groups of miRNAs located at the same chromosomal region, such as miR-200a, miR200b, and miR-429 at 1p36.33, or miR-622 and miR-623 at 13q31-32.
7. Taken together, MCL seems to combine a disease-specific miRNA signature that correlates with different sets of genes whose expression is associated with this lymphoma. This could reveal miRNAs as new important players in MCL development.
amplification in the human chromosomal region 13q34 in familial and sporadic breast cancer.
1. Chromosomal region 13q34 is targeted for high-level DNA amplifications in hepatocellular (Yasui et al., Hepatology 2002), adrenocortical (Dohna et al., Genes Chromosomes and Cancer 2000), and squamous cell carcinomas (Shinomiya et al., Genes Chromosomes and Cancer 1999), but also in breast cancer (Chen et al., Cancer Research 1998; Abba et al., Cancer Research 2007). Recently, a study based on array-comparative genomic hybridization (aCGH) in mouse breast cancer reported the amplification of a chromosomal region syntenic to human region 13q34. The authors described the over-expression of genes included in this region, and included a
meta-analysis of previous expression studies to emphasize the role of candidate genes such as TFDP1 (Abba et al., Cancer Research 2007), which has been previously proposed in other cancers (Shinomiya et al., Genes Chromosomes and Cancer 1999; Yasui et al., Hepatology 2002).
2. We have reported this amplification to be specific in a set of familial basal-like tumors with a frequency around 5% (Melchor et al., Oncogene in press). Our aim was to characterize this chromosomal region in sporadic and familial breast cancer from different perspectives. We wanted: first, to confirm this amplified region in a set of sporadic breast cancer; second, to narrow the minimal amplification site using a 1Mb-aCGH platform; third, to analyze the mRNA expression of the candidate genes located in the minimal region using quantitative retro-transcriptase polymerase chain reaction (qRT-PCR); and fourth, to quantify the protein expression of the main candidate genes located in the region using immunohistochemical (IHC) assays. We have observed a similar amplification rate in our breast cancer classes (9% in
BRCA1-associated cancers, 4.5% in BRCAX-associated cancers, and 4.2% in sporadic breast cancer). Our aCGH analyses in 7 cases (both familial and sporadic) showed that a minimal amplification site expands over 4 Mb (from BAC clone RP11-375A8 to 13q telomere), and contains 8 out of 42 genes related to different cancer processes. Currently, we are performing qRT-PCR and IHC analyses over these candidate genes and preliminary results highlights an
amplification-overexpression association with TFDP1, which encodes a transcription factor that promotes the expression of cell cycle promoters (e.g. cyclin E).
3. Our results describe the frequency of this amplification in familial and sporadic breast cancer and narrows the minimal region to 4 Mb. This region could be crucial in the breast tumor development (specially in basal-like tumors) and could include target genes for therapy.
lung cancer.
1. Lung cancer, of which 85% is non-small cell, is the leading cause of cancer-related death in the United States. Most of the genome-wide association studies were done with SNPs in germline DNA which did not take into account loss of heterozygosity and copy number variation in tumor DNA. No study has been published using
genome-wide tumor SNP discovery analysis in cancer survival. Our goal in this study is to identify candidate SNPs that predict survival in NSCLC using genome-wide SNP data from resected tumors.
2. A series of 100 early stage NSCLC patients were studied from cases diagnosed between 1992 and 2001 at the Massachusetts General Hospital (MGH), Boston, MA. Another series of 89 NSCLC patients diagnosed between 1988 and 1998 collected by National Institute of Occupational Health in Norway was used for validating the finding in MGH cohort. DNA was extracted from flash frozen lung tissues collected during surgery. SNPs were evaluated in genomic DNA extracted from
micro-dissected tumor tissue with at least 70% tumor cellularity. Genome-wide genotyping was done using Affymetrix® 250K Nsp GeneChip®. Univariate Cox proportional hazard model in additive mode was used to screen significant SNPs with false discovery rate (FDR) adjustment for multiple testing. Hazard ratios (HR) were derived by multivariate Cox model adjusting for the demographic and clinical information, and copy number variation inferred by dCHIP.
RESULTS: Median survival time was 6.3 and 3.7 years, and there were 43 and 55 deaths in MGH and Norway cases, respectively. There were more male patients and squamous cell carcinoma but lower smoking pack-years in Norway cases than MGH cases. After excluding those with genotype call rate less than 95%, with variant homozygous plus heterozygous alleles less than 10% and with variant homozygous less than 3%, 74,666 SNPs were used for analysis in MGH discovery set. There were 19 SNPs significantly associated with patients’ survival with FDR < 0.2 in additive mode (p < 4.6 x 10⁻⁵) on univariate analysis. Multivariate analyses revealed the similar results in these 19 SNPs (p < 8.5 x 10⁻⁵). Among the 19 significant SNPs, 5 were validated by Norway cases with the same direction of prediction: rs9290781 (HR (95% C.I.): 1.6 (1.0-2.5), p=0.05), rs10517215 (2.1 (1.1-4.0), p=0.01), rs16931907 (1.5 (0.8-3.0), p=0.08), rs12446308 (2.9 (1.4-6.0), p=0.005) and
rs13041757 (1.9 (1.2-3.1), p=0.008). rs10517215, rs12446308 and rs13041757 were within the intron of known genes: protocadherin 7, ataxin 2-binding protein 1 and eyes absent homolog 2, respectively.
3. Using genome-wide survival analysis, 19 SNPs were identified to be associated with survival and 5 of them were validated in an independent cohort. A small panel of