1
Department of Business Administration
I-Shou University
Master Thesis
Factors Effecting Employee Job Satisfaction of
Manufacturing Enterprise: The Case of Nghe An Rubber
Company (NRC)
Student: Pham Trung Thu Advisor: Ph.D. Wanching Chang
2 Table of Contents
Acknowledgment ... 4
Abstact ... 5
Chapter I Introduction ... 6
1.1
Background ... 6
1.2
Research objective ... 7
1.3
Research question ... 7
1.4
Implication of research ... 7
Chapter II Literature review ... 8
2.1
Overview of Vietnam rubber industry ... 8
2.2
Overview of Nghe An Ruber Company ... 8
2.3
Employee satisfaction ... 9
2.3.1
Two-factor theory ... 9
2.4
The factors that relation with the job satisfaction ... 10
2.5
Research framework and hypothesis ... 11
Chapter III: Methodology ... 13
3.1
Questionnaire design ... 13
3.2
Sampling ... 15
3.3
Data analysis ... 15
3.3.1
Reliability analysis ... 15
3.3.2
Exploratory factor analysis ... 15
3.3.3
Linear regression ... 16
3.3.4
ANOVA and t-test ... 16
Chapter IV Data Analysis ... 17
4.1
Respondent profile ... 17
4.2
Item scaling ... 18
4.3
Reliability test ... 20
4.4
Factor analysis ... 21
3
4.5.1
Evaluate the fit of the linear regression model ... 23
4.5.2
Regression model analysis ... 24
4.5.3
T-test and ANOVA ... 26
Chapter V Conclusion and recommendation ... 32
5.1
Conclusion ... 32
5.2
Recommendation ... 32
5.3
Research contribution ... 33
5.4
Research limitation ... 33
Reference: ... 34
4
Acknowledgment
After 2 years of study and research. First of all, allow me to wish to send sincere thanks and deepest gratitude for your school teachers College of Business and Technology in Hanoi, I-Shou University - Taiwan.
From the first day until the end of training courses specialized Master of Business Administration I always received enthusiastic interest in the teaching of the professor, who has communicated to me and students with extensive knowledge - with high availability for Business Administration.The baggage of knowledge and learning in the school, I continue to firmly confident on current career path and future. Besides, during the learning process, I also learned a lot of valuable life experience extremely valuable at home and abroad. It remains in me is the dedication and enthusiasm the profession, the students of the professor.Especially the feelings of professors: Pb Wanching Chang, Dr. Nguyen Quang Vinh and Mr Nguyen Van Diep was always interested, companion, guide and create favorable conditions to complete my thesis this graduation. Again, I would respectfully submit to the management board, to you the professor, to the center staff training cooperation with foreign partners University of Business and Technology in Hanoi, I-Shou University sincere thanks. I wish all of you a good health, happiness and success!
5
Abstact
The level of employee satisfaction is one of the criteria for evaluating the success of the business. The aim of this paper is study the factor effect the employee satisfaction at Nghe An Rubber Company (NCR). Among 250 questionnaires sent to employee who is working in Nghe An Rubber Company on May, 2016 to ask about their satisfaction with the job. 235 questionnaires were returned and in this 207 questionnaires is considered as valuable for analysis counted for 88% of valid rate. This study shows that employee satisfaction is impacted by 6 factor: Working environment, Salary, Colleague, Training and promotion, Welfare, Reward policy in case of NRC. The anova and t-test result show that there is not significant difference between male and female in job satisfaction. The result indicates that employee in different age group, education level, working experience and postion have different level of satisfaction. From the result, recomendation, limitation and sugesstion for further research also dicussted in this study.
Keywords: Human resource management, job satisfaction, Herzberg's two-factor theory, Nghe An Rubber Company
6
Chapter I Introduction
1.1 Background
Vietnam has been signed, negotiated many international economic agreements. This has created many opportunities to expand the market for these occupations, local products, including rubber industry (Weatherbee, 2014). However, besides the great opportunities for export, the South Vietnamese rubber has the potential not small challenges.
One of the greatest difficulties of rubber manufacturing enterprises today is the quality and technical. This comes from the familiar corporate internal and supply of products selected for easy market is China. Therefore, when Vietnam joins the bilateral trade agreement with the tougher market, the advantage of high export tax incentives whereas domestic enterprises do not meet the specifications. Vietnam enterprises face many challenges when they wish to export to foreign markets such as USA, Japan, Korea. (Weatherbee, 2014). The market requires the technical requirements of the product are very high. For example, the company wants to sell raw materials SVR 10 and SVR 20 for tire manufacturers, the plant must meet several requirements, such as raw materials without contamination, without rubber particles live, love quality requirements must be uniform and stable during supply (Li and Fox, 2012). If companies meet the above requirements, the company must send a sample of material supplied to partners for testing and trial production. When the results of testing and trial production samples met the requirements, the company received new contracts for raw material supply partners.
Along with the advances of science and technology and especially in the context of the economy switched toward knowledge-based development, the human resources become competitive factors for leading organizations and enterprises. Many organizations and businesses are having problems when manpower gradually works motivation; job-hopping leads to risk or decrease performance (Ovalle, Alvarado and Martínez, 2004). How to remedy this situation is a major concern of the human resources management and organizational leadership?
Present, the rubber industry is severely lacking in the workforce have the knowledge and skills intensive industrial rubber processing. Meanwhile, a team of scientist’s knowledgeable rubber processing depth at the hospital, the school is also very meager. This is a major influence on the development of this sector as the demand for industrial rubber growing market.
7
Currently, many enterprises in Vietnam have conducted periodic surveys the satisfaction of employees, the information obtained from this activity have been recognized as useful resources to improve the environment work, improve work efficiency. However, there are limited the research related to employee in the rubber industry. There for this study is investigated the relationship of factor on employee satisfaction.
1.2 Research objective
This study has the flowing objectives:- To identify factors that relationship with employee satisfaction for Rubber industry - To evaluate job satisfaction of employee for Rubber industry
- To provide the solution for improving the job satisfaction of employee in Rubber industry
1.3 Research question
To obtain the research objective the research questions were listed in below.
- What are the factors of job satisfaction for the employees in the NRC, Vietnam?
- What are relationship among factors and employee job satisfaction in the NRC, Vietnam? - What are the differences between Socio-demographics (gender, age, education) and job satisfaction for the employees in the NRC, Vietnam?
- What are the differences between job behaviors (working experience, working position, and the type of contract) and job satisfaction for the employees in the NRC, Vietnam?
1.4 Implication of research
This research will help managers to evaluate job satisfaction of employee for Rubber industry and improving the job satisfaction of employee in Rubber industry.
8
Chapter II Literature review
2.1 Overview of Vietnam rubber industry
Vietnam continues to hold third place in the world and fourth volume of exports of natural rubber. As one of the manufacturing powerhouse, rubber exports, but Vietnam rubber industry is facing many difficulties and challenges. Reporter Vietnam News Agency has had a talk with Mr. Vo Hoang An, secretary general of the Vietnam Rubber Association on this issue.
Rubber plantation area of about 977 700 hectares. Rubber production is estimated at 953 700 tonnes in 2014, up 0.7% over the previous year. Vietnam rubber production accounts for about 8.1% of the total world rubber production, behind Thailand (34.1%) and Indonesia (26.9%). Five years is a very difficult and challenging for the rubber industry, especially in the field of natural rubber as prices fell to the lowest level in 5-year period (2010-2014) through. The reason is that the world economic recovery is weak, demand for natural rubber rose more slowly than the supply, leading to higher inventories, as prices decline continuously from 2012, affecting revenue, profit corporate earnings and incomes of workers in the rubber industry.
In addition, falling oil prices from mid-2014 to make synthetic rubber increased competitiveness with natural rubber and brake pressure natural rubber prices. This can make the rubber industry continues more difficult in 2015 because rubber prices too low.
Besides the biggest difficulty about prices down too low, Vietnam rubber industry also faces stiff competition from other countries due to the structure of inappropriate species, quality of natural rubber has been uneven, stable crude exports as a proportion higher than 80%.
In addition, businesses are still facing problems related to the declaration and payment of value added tax in the trading of commodity trade natural rubber latex processing application.
2.2 Overview of Nghe An Ruber Company
Investment Joint Stock Company Rubber develop Nghe An was established in 2007. Nghe An is one of the provinces receiving the rubber tree for a long time but not so proper attention should be given to economic efficiency is not high. However, until now, Nghe An has placed rubber correct range and began to create a new vitality for the development of this plant.
9
Most of this area ever mainly developing this type of acacia, eucalyptus, linden So after Communism advocated by the Group of Vietnam, Nghe An made the project of planting rubber, DARD has advised the provincial master plan to develop 30,600 hectares of rubber, in that the rubber area in the mountainous districts and farms of 7,000 hectares, the province now focus drastically to 23,000 hectares planted to rubber are on between now and 2020. to achieve this goal , DARD will create the most favorable conditions for the planning, land conversion, restructuring timely crop for planting 1,000 hectares businesses and rubber Nghe An JSC (of the Group CNCSVN) planting 2,000 hectares in the districts of Nghia Dan, Quy Hop, Tan Ky, Que Phong, Quynh Luu, Yen Thanh and Anh Son in 2010.
Department has reported to the PPC on the request for return of 2 land Forestry Company Yen Thanh Anh Son and to allocate to investment and development JSC Rubber Technology police receive new reclamation plant, while forestry Cty Anh Son offered 6843.8 hectares of forest Yen Thanh Co. offered intact area of scope 1 and the 4 teams with 2,700 hectares. Total land originally allocated to Nghe An will use 9543.8 hectares for Corporation. Accordingly tens of thousands of hectares of forest land asleep a long time, since this will be awakened by species dubbed "white gold".
2.3 Employee satisfaction
There are many different definitions of employee satisfaction in the job. In general, job satisfaction is that people simply feel like their work and other aspects of their work (Spector, 1997). Vroom (1964) pointed out that "job satisfaction is a state in which the employee has effectively clear direction for the work of the organization, really excited to work". Besides, Kreitner and Kinicki (2007) defines "job satisfaction as the emotional reactions and feelings towards different aspects of the job."
2.3.1 Two-factor theory
Two-factor theory was developed by American psychologist Frederick Herzberg (1959). Herzberg's findings have created a large surprise because it overturns the conventional wisdom. Managers often assume that the opposite of satisfaction is discontent, and vice versa. But, Herzberg says the opposite of dissatisfaction is not satisfied that is not discontent and opposition to meet not the discontent that is not satisfied.
10
This theory is divided in to two factors in clouding 1) Group motivating factors: Features of this group is that if not satisfied, leading to discontent, if satisfied, will have motivational effects .2) Group maintains factors: It is the element belongs to the working environment of the employees, the policy regimes of enterprise governance, salary, job instruction, human relations, working conditions. These factors are well organized when it has the effect to prevent the dissatisfaction with the work of employees
Herzberg said that five elements bring typical "job satisfaction" is: the satisfaction of the completion itself a task, solve a problem and see the fruits of his efforts. (People are motivated when he has the ability to make their intentions are.) The job itself: the positive influence from work to everyone. for example, a job can be exciting, diverse, creative and challenging.
2.4 The factors that relation with the job satisfaction
Salary and welfare: income and benefits expressed in physiological needs and safety needs in Maslow's theory (1943), As a study of Artz (2008) welfare has a significant role in determining the job satisfaction level.Working condition: Environment safety, have all the tools to work, reasonable working hours, workplace fun and well organized according to research by Kennett S.Kovach (1987).
Training and development: According to Tran Kim Dung (2009) for training opportunities that meet the needs for staff development. Equipped with the expertise needed to stimulate employees do the job better, achieve more trophies, wanted to be given the task of challenging higher chances of advancement. According to Maslow's theory, the elements are in demand, the elements in the group of environmental factors potentially causing not satisfied.
Relations with colleagues: as Hill (2008) employees need to get the support from co-worker during working. Bellingham (2004) agree that employees need the commitment of colleagues to get the best result.
Reward and recognize the achievements of outstanding work not only nature motivate, evaluate individual physical and mental, but also encourage other individuals trying to follow the example of those individuals success to improve themselves. However, to perform well this measure, should develop evaluation criteria reflect an increase operational efficiency. It is also the basis to ensure fairness between individuals in the organization, avoid depression, loss of motivation of
11
individuals working good and the moral hazard of individuals with low working efficiency.
2.5 Research framework and hypothesis
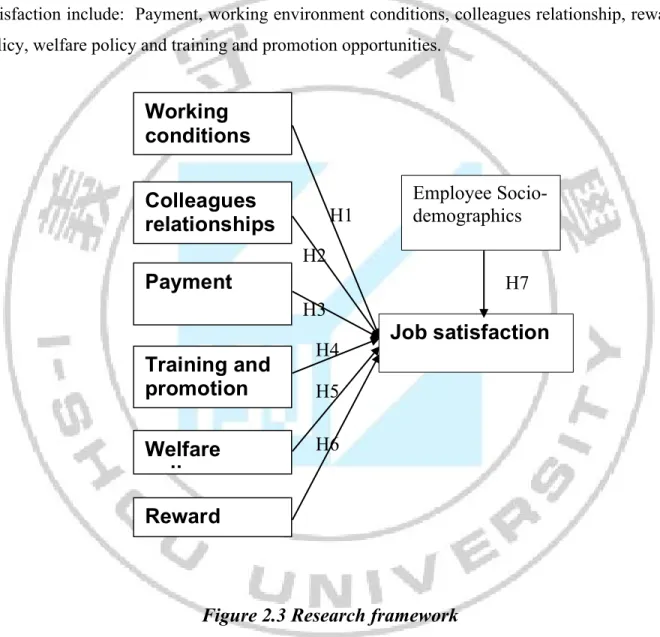
From the literature gathered for the study, based on the Herzberg's two-factor theory and the context of Nghe An Ruber company. This thesis propose the factors that enhance employee satisfaction include: Payment, working environment conditions, colleagues relationship, reward policy, welfare policy and training and promotion opportunities.
Figure 2.3 Research framework
Hypothesis
H1: Working conditions have positive relationship with Job satisfaction H2: Colleagues have positive relationship with Job satisfaction
H3: Payment have positive relationship with Job satisfaction
Training and
promotion
Working
conditions
Colleagues
relationships
Payment
Welfare
policy
Reward
policy
Job satisfaction
Employee Socio-demographics H1 H2 H3 H4 H5 H6 H712
H4: Training and promotion have positive relationship with Job satisfaction H5: Welfare policy have positive relationship with Job satisfaction
H6: Reward policy have positive relationship with Job satisfaction
H7: There are the differences between Socio-demographics (gender, age, education) and job satisfaction for the employees who work in who work in the NRC, Vietnam
13
Chapter III: Methodology
The basic objective of the survey activities of employee satisfaction is to know the needs of staff to apply consistent personnel policy; knowing the views of staff about the activities of the organization; Rate the deciding factor to employee engagement; improve the existing problems in the operation of institutions, human resources policies, labor relations (Chang and Lee, 2007). This activity started from the design of the survey sample. This form is often based on the desire to take the opinion of employees on the job and working conditions, these coupons are sent to employees through various channels.
The aim of this research is to test the theoretical model of factors affecting the satisfaction of employees to organize. Research is carried out at Nghe An Rubber Company, through survey employees of the company on a questionnaire used by five- Likert scale.
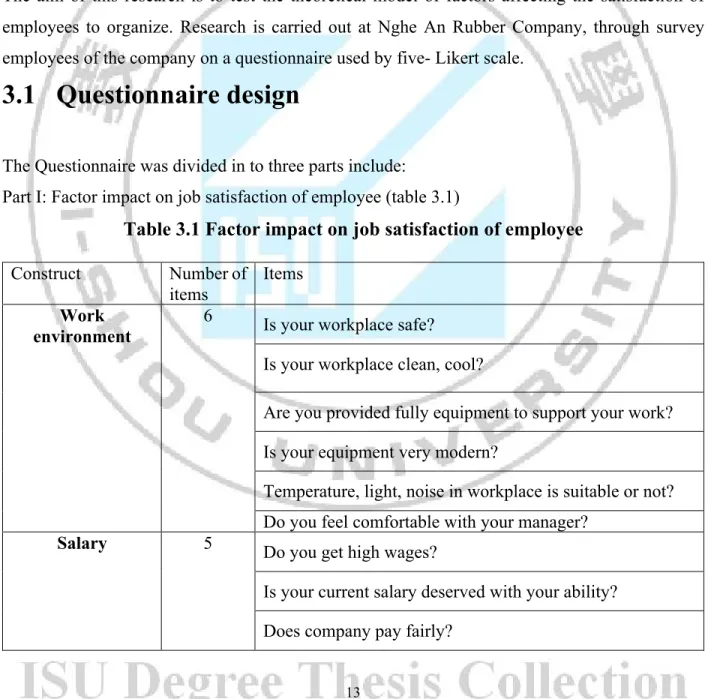
3.1 Questionnaire design
The Questionnaire was divided in to three parts include: Part I: Factor impact on job satisfaction of employee (table 3.1)
Table 3.1 Factor impact on job satisfaction of employee
Construct Number of items
Items Work
environment
6 Is your workplace safe?
Is your workplace clean, cool?
Are you provided fully equipment to support your work? Is your equipment very modern?
Temperature, light, noise in workplace is suitable or not? Do you feel comfortable with your manager?
Salary 5 Do you get high wages?
Is your current salary deserved with your ability? Does company pay fairly?
14
Can you live well based on income from company?
Do you think your income higher than the other company? Colleagues 5 Do you feel comfortable with your colleagues?
Are colleagues willing to help you at work?
Do you have good teamwork with your colleagues? Does your manager always listen idea of employees?
Training and promotion
5 The company is very interested in the training of staff?
You participate in annual training program of the company? The training program suit with your ability
You have chances to get promoted in the company?
Do you know the conditions are necessary to get promoted? Welfare 4 Does company have social insurance, good health
insurance?
Are you satisfied with the allowance as subsidized lunches, gifts as a birthday gift?
Is welfare program of company attractive?
Is welfare of company lower than the other companies? Reward 4 Is your achievement recognized and evaluate well?
Do you get reward worthily with your contributions and dedication?
Do you get reward fairly when you completed well your work?
15 Part II: Job satisfaction factor
The variables measuring employee satisfaction was also measured in 5-point Likert scale as above and used for the following three observation variables: (1) In general I likes this job; (2) In general I am satisfied with the company; (3) I will stay at the company as long as I can.
Part III: Personal information
In this part, the author is going to ask some information related to Socio-demographics (gender, age, education) and job behaviors (working experience, working position)
3.2 Sampling
There are 250 samples of the target population for this study is the staffs who are working for NRC. Therefore, the question will be sent to the leaders as well as workers in NRC, the data collected will be analyzed by using SPSS analysis software to collate and verify data.
3.3 Data analysis
3.3.1 Reliability analysis
The meaning of the evaluation Cronbach’s alpha scale considers it a red flag or not the same concept. In other words, in an index scale has demonstrated high Cronbach alpha of the respondents were asked to understand the same concept. And the answer homogenous - similar - each observed variable of scale. As recommended the cronbach’s alpha should be greater than .7 for variable consistence index.
3.3.2 Exploratory factor analysis
When exploring factor analysis EFA (Exploratory Factor Analysis) in addition to ensuring "value convergence" (convergence of the items on the first factor), they must ensure "value distinction" (belonging to and factors must be distinguished from other factors).
As an illustration, when one load items at the same time to 2 or more factors, to ensure "value distinction" is the same load factor of 1 items such as load factors up to a difference of 0.3 the last time that you retain this item and it will belong to that load factors are highest (of course, to the terms and conditions load factor> 0.5). Otherwise, you consider this type of item because it did not meet the guarantee "distinct value".
16
3.3.3 Linear regression
In the semi-experimental study (quasi-experiment), k hip researchers may be able to change (manipulate) the independent variable, so there is often noise variables appear. We tried to remedy this situation with specific statistical methods that use multiple regression. In multivariate regression relationship of the dependent variable (outcome) and independent variables (effects) are evaluated in the control variables other noise. The purpose of regression: 1) prediction: learn / discover the factors that could predict a phenomenon (outcome variable); 2) explain: learn / detection systems / processes or causes a phenomenon.
3.3.4 ANOVA and t-test
For the test of the difference between the overall research expertise this study use t-test and analysis of variance (ANOVA).
17
Chapter IV Data Analysis
4.1 Respondent profile
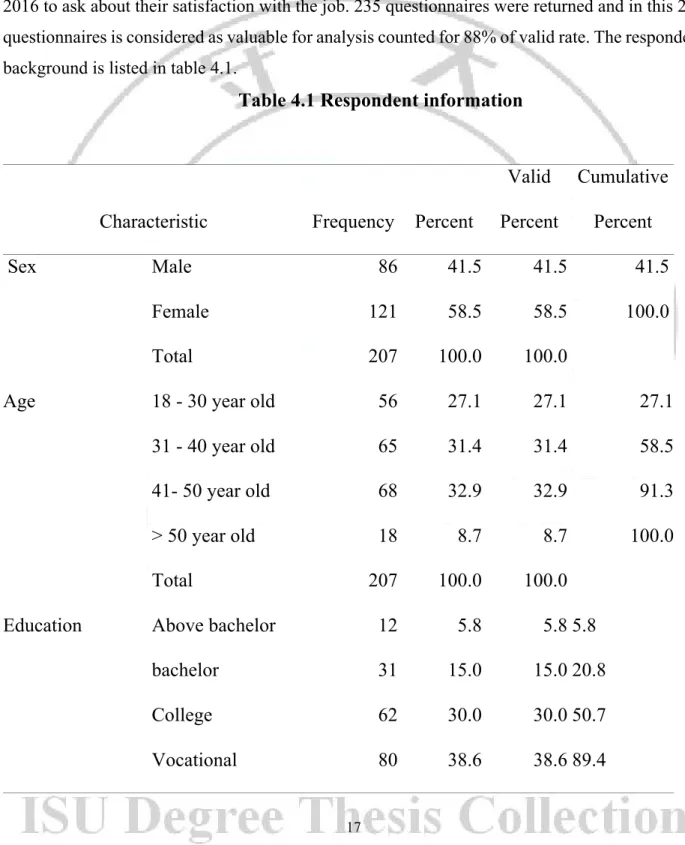
Among250 questionnairessent to employee who is working in Nghe An Rubber Company on May, 2016 to ask about their satisfaction with the job. 235 questionnaires were returned and in this 207 questionnaires is considered as valuable for analysis counted for 88% of valid rate. The respondent background is listed in table 4.1.
Table 4.1 Respondent information
Characteristic Frequency Percent
Valid Percent Cumulative Percent Sex Male 86 41.5 41.5 41.5 Female 121 58.5 58.5 100.0 Total 207 100.0 100.0
Age 18 - 30 year old 56 27.1 27.1 27.1 31 - 40 year old 65 31.4 31.4 58.5 41- 50 year old 68 32.9 32.9 91.3 > 50 year old 18 8.7 8.7 100.0
Total 207 100.0 100.0
Education Above bachelor 12 5.8 5.8 5.8 bachelor 31 15.0 15.0 20.8 College 62 30.0 30.0 50.7 Vocational 80 38.6 38.6 89.4
18
From the table 4, the result indicates that, among 207 employees, there are 41.5% is male and 58.5 is female. The age of respondent is asked from 18 to 60-year-old in which, employee is in the group of 18 – 30 is 27.1%, from 31-40 is 31.4%, 41-50 is 32.9 and employee who is over 50 years old counted only 8.7% in this study.
Related to education level of employee in this study, the result shows that for employee who have the higher bachelor degree in this study is just 5.8%, employee who is graduated from university is 15%. While employee who have the College and Vocational degree count as the major number in this study (College is 30% and Vocational degree is 38.6%). For the experience of employee who are working for NRC the result shows that employee who have less than 5 years’ experience is 32%, employee with 5-15 years experience is 39.6% and more than 15 year is 28% indicate the high experience of respondent in this study. Total 207 employees were surveyed there are 19.8 % is working as staff office and 80.2% who is worker.
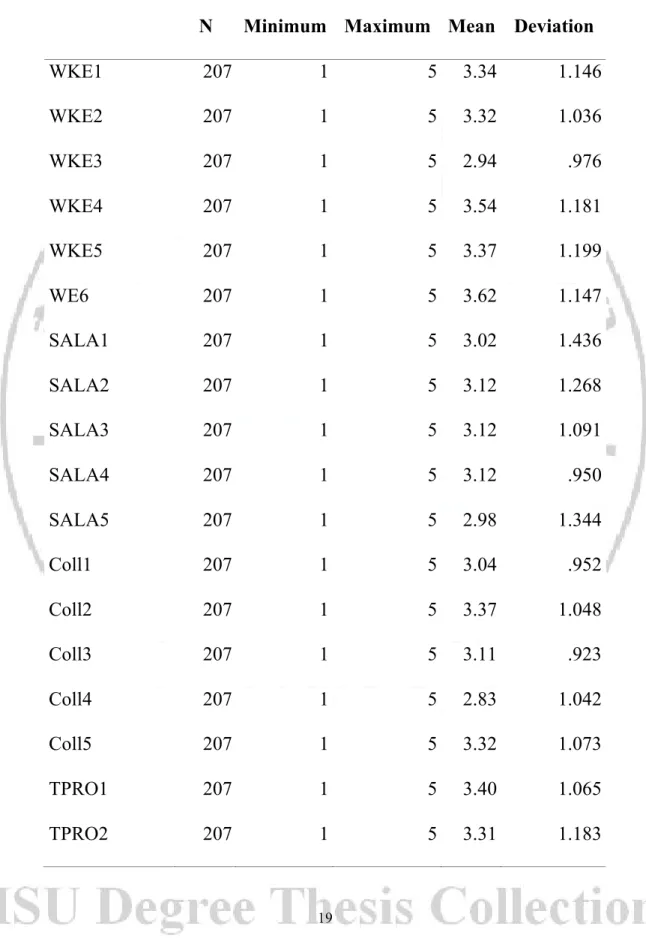
4.2 Item scaling
To see the center tendency of observation variable, this study is used the Descriptive statistics method to test all the observation variable in this study. Table 4.2 shows the descriptive statistics of observation variable High school 22 10.6 10.6 100.0 Total 207 100.0 100.0 Experience < 5 year 67 32.4 32.4 32.4 5 - 15 year 82 39.6 39.6 72.0 >15 year 58 28.0 28.0 100.0 Total 207 100.0 100.0
Position Staff office 41 19.8 19.8 19.8 Worker 166 80.2 80.2 100.0
19
Table 4.2 Descriptive statistics
N Minimum Maximum Mean
Std. Deviation WKE1 207 1 5 3.34 1.146 WKE2 207 1 5 3.32 1.036 WKE3 207 1 5 2.94 .976 WKE4 207 1 5 3.54 1.181 WKE5 207 1 5 3.37 1.199 WE6 207 1 5 3.62 1.147 SALA1 207 1 5 3.02 1.436 SALA2 207 1 5 3.12 1.268 SALA3 207 1 5 3.12 1.091 SALA4 207 1 5 3.12 .950 SALA5 207 1 5 2.98 1.344 Coll1 207 1 5 3.04 .952 Coll2 207 1 5 3.37 1.048 Coll3 207 1 5 3.11 .923 Coll4 207 1 5 2.83 1.042 Coll5 207 1 5 3.32 1.073 TPRO1 207 1 5 3.40 1.065 TPRO2 207 1 5 3.31 1.183
20 TPRO3 207 1 5 3.58 1.171 TPRO4 207 1 5 3.60 1.161 TPRO5 207 1 5 3.70 1.149 Welf1 207 1 5 3.62 1.059 Welf2 207 1 5 3.53 1.032 Welf3 207 1 5 3.54 1.032 Welf4 207 1 5 3.56 1.059 Rewa1 207 1 5 3.90 1.149 Rewa2 207 1 5 3.87 1.184 Rewa3 207 1 5 3.49 1.153 Rewa4 207 1 5 3.62 1.077 SATI1 207 1 5 3.18 1.116 SATI2 207 1 5 2.95 1.025 SATI3 207 1 5 2.88 1.106 Valid N (listwise) 207
From the table 4.2, the results show that almost variables have the mean value above 3 score indicate the good center tendency of this surveyed.
4.3 Reliability test
To check the reliability and internal consistency of each factor, Cronbach alpha test was conducted. The result of Cronbach alpha of each item and varable is shown in table 4.3
21
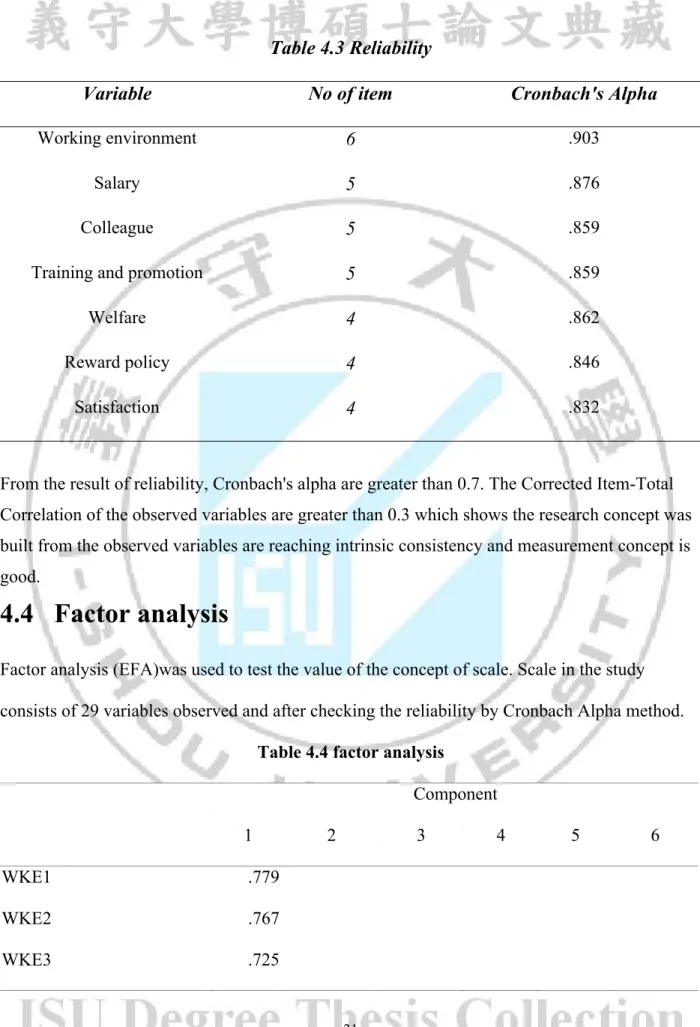
Table 4.3 Reliability
Variable No of item Cronbach's Alpha
Working environment 6 .903
Salary 5 .876
Colleague 5 .859
Training and promotion 5 .859
Welfare 4 .862
Reward policy 4 .846
Satisfaction 4 .832
From the result of reliability, Cronbach's alpha are greater than 0.7. The Corrected Item-Total Correlation of the observed variables are greater than 0.3 which shows the research concept was built from the observed variables are reaching intrinsic consistency and measurement concept is good.
4.4 Factor analysis
Factor analysis (EFA)was used to test the value of the concept of scale. Scale in the study consists of 29 variables observed and after checking the reliability by Cronbach Alpha method.
Table 4.4 factor analysis
Component
1 2 3 4 5 6
WKE1 .779
WKE2 .767
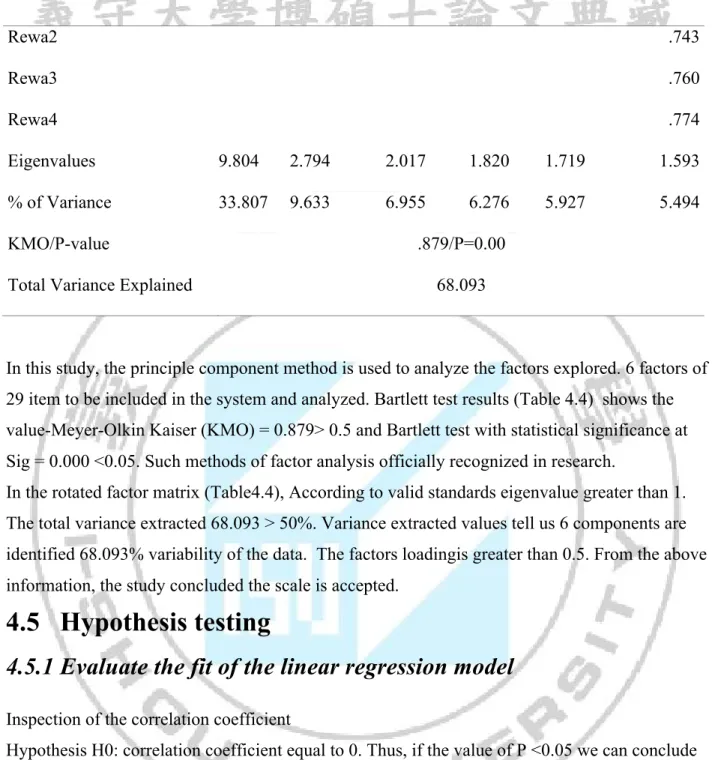
22 WKE4 .730 WKE5 .727 WE6 .820 SALA1 .764 SALA2 .786 SALA3 .720 SALA4 .663 SALA5 .864 Coll1 .766 Coll2 .677 Coll3 .807 Coll4 .701 Coll5 .711 TPRO1 .750 TPRO2 .656 TPRO3 .602 TPRO4 .754 TPRO5 .845 Welf1 .888 Welf2 .762 Welf3 .770 Welf4 .734 Rewa1 .830
23 Rewa2 .743 Rewa3 .760 Rewa4 .774 Eigenvalues 9.804 2.794 2.017 1.820 1.719 1.593 % of Variance 33.807 9.633 6.955 6.276 5.927 5.494 KMO/P-value .879/P=0.00
Total Variance Explained 68.093
In this study, the principle component method is used to analyze the factors explored. 6 factors of 29 item to be included in the system and analyzed. Bartlett test results (Table 4.4) shows the value-Meyer-Olkin Kaiser (KMO) = 0.879> 0.5 and Bartlett test with statistical significance at Sig = 0.000 <0.05. Such methods of factor analysis officially recognized in research.
In the rotated factor matrix (Table4.4), According to valid standards eigenvalue greater than 1. The total variance extracted 68.093 > 50%. Variance extracted values tell us 6 components are identified 68.093% variability of the data. The factors loadingis greater than 0.5. From the above information, the study concluded the scale is accepted.
4.5 Hypothesis testing
4.5.1 Evaluate the fit of the linear regression model
Inspection of the correlation coefficient
Hypothesis H0: correlation coefficient equal to 0. Thus, if the value of P <0.05 we can conclude is that the two variables are correlated with each other. The correlation coefficient greater correlation tighter. if the value P> 0.05, the two variables are not correlated with each other.
Table 4.5 Correlation coefficient
WKE SALA COLL TPRO WELF REWA SATI
24 SALA .526** 1 COLL .484** .412** 1 TPRO .488** .437** .498** 1 WELF .290** .248** .408** .343** 1 REWA .293** .253** .374** .424** .324** 1 . SATI .728** .684** .610** .669** .439** .473** 1 **. P<0.05
According to the correlation matrix in table above, the variable input factor:Working environment, Salary, Colleague, Training and promotion, Welfare, Reward policyand Satisfactionarecorrelated with a correlation coefficient r > 0.3 with a significance level Sig <5%, which was statistically significant.
4.5.2 Regression model analysis
To assess the impact of factors affecting job satisfaction authors used multiple regression model. From the analysis above factors have identified six actors that affect the job satisfaction. This is the six explanatory variables included in the regression model corresponding notation: X1- Working environment, X2- Salary, X3- Colleague, X4- Training and promotion, X5- Welfare, X6- Reward policyand job satisfaction is the dependent variable is denoted Y. regression model is written as follows:
25
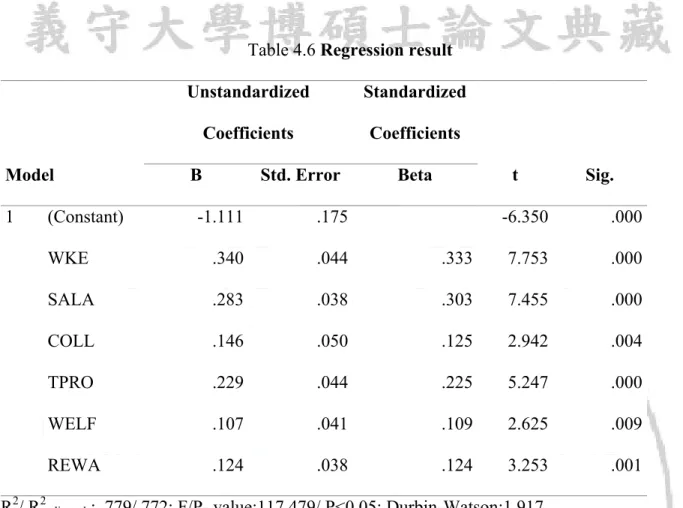
Table 4.6 Regression result
Model Unstandardized Coefficients Standardized Coefficients t Sig. B Std. Error Beta 1 (Constant) -1.111 .175 -6.350 .000 WKE .340 .044 .333 7.753 .000 SALA .283 .038 .303 7.455 .000 COLL .146 .050 .125 2.942 .004 TPRO .229 .044 .225 5.247 .000 WELF .107 .041 .109 2.625 .009 REWA .124 .038 .124 3.253 .001 R2/ R2
adjusted : .779/.772; F/P- value:117.479/ P<0.05; Durbin-Watson:1.917
Regression results in Table 4.6 shows that, adjusted R Square = 0.772, means a linear regression model was built multiples are in line with data and 77.2%.
The results of testing according to table 4.6 (ANOVA) with significance level Sig. = 0.000 <0.01 show a multiple regression model just built is consistent with the overall study and can be used for further testing. Beside the Durbin-Watson <2, which measured multicollinearity problem no significant influence on the regression results.
The regression equation showing the relationship expressed job satisfaction with the dependent factors is written as follows:
YSATI=-1.111+.333XWKE+.303XSALA+125XCOLL+.225XTPRO+.109XWELF+.124XREWA
The order level of the influential factors in the model to job satsifaction of employee in NRP from high to low, as follows:
1. Working environment (beta = 0.333) 2. Salary (beta = 0.303)
3. Training and promotion (beta = 0.225) 4. Colleague (beta= 0.125)
26 5. Reward policy (beta = 0.124)
6. Welfare (beta = 0.109)
This means, in the context of other factors constant, then: when Factors " Working environment" improved by 1 unit, the rate of job satisfaction in NRC improved further 0.340 units; when factors " Salary " is improved by 1 unit, the rate of job satisfaction in NRC is improved further 0.283 units; the factor " Training and promotion " improved further by 1 unit, job satisfaction in NRC is improved further 0.229 unit, Factor “Colleague " improved further by 1 unit, job satisfaction in NRC is improved further 0.146 unit, Factor “Reward policy " improved further by 1 unit, job satisfaction in NRC is improved further 0.124 unit andFactor “Welfare " improved further by 1 unit, job satisfaction in NRC is improved further 0.107 unit.. So it is concluded that hypothesis 1to hypothesis 6 is supported by the model.
4.5.3 T-test and ANOVA
For testing the hypothesis 7 and 8 this study uses t-test and Anova test the differences between Socio-demographics (gender, age, education) and job satisfaction for the employees who work in who work in the NRC, Vietnam and the differences between job behaviors (working experience and working position) and job satisfaction for the employees who work in the NRC, Vietnam? H0: µ1 - µ2 = 0
H1:µ1 # µ2
- The differences between Socio-demographics (gender, age, education) and job
satisfaction for the employees who work in who work in the NRC
+ The differences between gender and job satisfaction
To test the The differences betweengender and job satisfaction, t-test is used. Using the alpha of 0.05, the independent t-test indicate the that the average level of satisfaction of male (M= 2.9961, SD=.97081) is not difference from female (M= 3.0055, SD=.91589), t (1) = 205, p>0.05. It can be concluded that there is no significant difference between male and female in job satisfaction.
Table 4.7 t-test of gender and job satisfaction
Sex N Mean Std. Deviation Std. Error Mean t Sig. (2-tailed)
27
SATI Male 86 2.9961 .97081 .10468 205 .944
Female 121 3.0055 .91589 .08326 176.521 .944
+ The differnent of employee satisfaction among age group
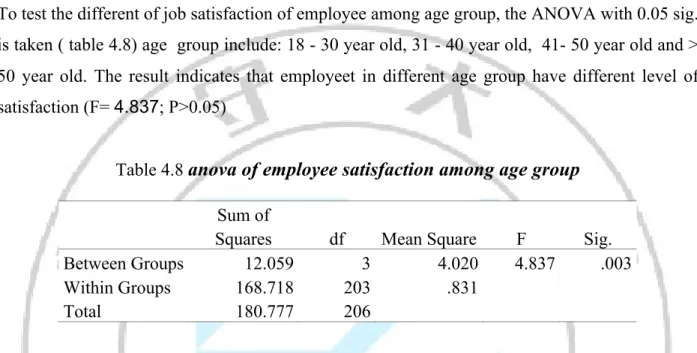
To test the different of job satisfaction of employee among age group, the ANOVA with 0.05 sig. is taken ( table 4.8) age group include: 18 - 30 year old, 31 - 40 year old, 41- 50 year old and > 50 year old. The result indicates that employeet in different age group have different level of satisfaction (F= 4.837; P>0.05)
Table 4.8 anova of employee satisfaction among age group
Sum of
Squares df Mean Square F Sig.
Between Groups 12.059 3 4.020 4.837 .003
Within Groups 168.718 203 .831
Total 180.777 206
To find the detail of different of employee satisfaction among age group, post hoc test with Tukey HSDa
- method is used. The result indicates that employee who are more than 50-year-old have
more satisfaction than other group (p<0.05). This may be come from the experience working in NRC and they are the people who is getting older, they do not have much need as the younger.
Table 4.9 Post hoc test of employee satisfaction among age group
(I) Age (J) Age
Mean
Difference (I-J) Std. Error Sig.
95% Confidence Interval Lower
Bound Upper Bound 18 - 30 year old 31 - 40 year old .13022 .16622 .434 -.1975 .4580 41- 50 year old -.10364 .16451 .529 -.4280 .2207 > 50 year old -.78175* .24701 .002 -1.2688 -.2947 31 - 40 year old 18 - 30 year old -.13022 .16622 .434 -.4580 .1975
28 41- 50 year old -.23386 .15814 .141 -.5457 .0780 > 50 year old -.91197* .24282 .000 -1.3907 -.4332 41- 50 year old 18 - 30 year old .10364 .16451 .529 -.2207 .4280 31 - 40 year old .23386 .15814 .141 -.0780 .5457 > 50 year old -.67810* .24165 .006 -1.1546 -.2016 > 50 year old 18 - 30 year old .78175* .24701 .002 .2947 1.2688 31 - 40 year old .91197 * .24282 .000 .4332 1.3907 41- 50 year old .67810* .24165 .006 .2016 1.1546 *P<0.05.
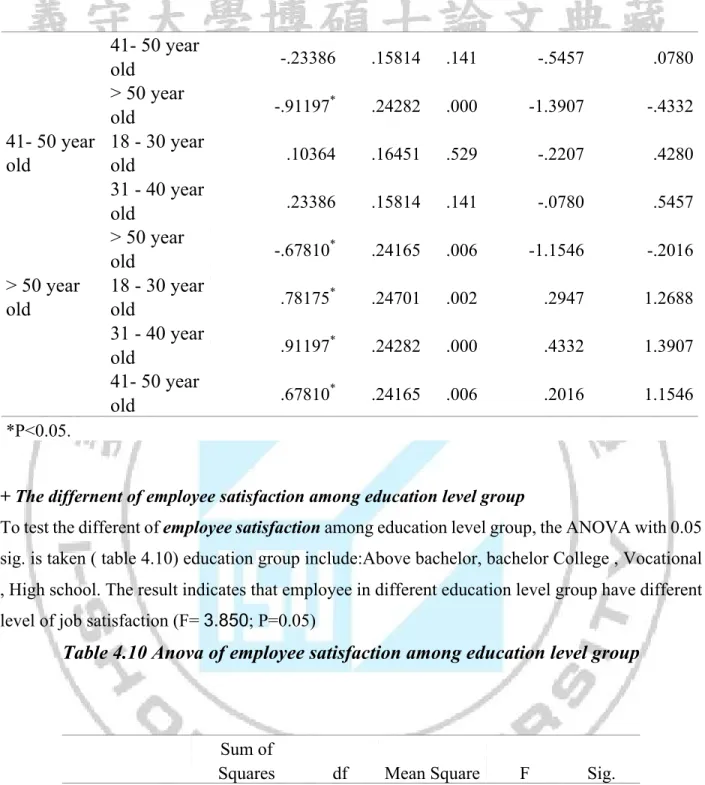
+ The differnent of employee satisfaction among education level group
To test the different of employee satisfaction among education level group, the ANOVA with 0.05 sig. is taken ( table 4.10) education group include:Above bachelor, bachelor College , Vocational , High school. The result indicates that employee in different education level group have different level of job satisfaction (F= 3.850; P=0.05)
Table 4.10 Anova of employee satisfaction among education level group
Sum of
Squares df Mean Square F Sig.
Between Groups 12.807 4 3.202 3.850 .005
Within Groups 167.971 202 .832
Total 180.777 206
To find the detail of different of employee satisfaction among education group, post hoc test with Tukey HSDa
- method is used. The result indicates that employee who have high schoolhave more
satisfaction than other group (p<0.05). This is reasonable since that people have lower education so thay do not have much purpose in working and they just need the sustainable job and have
29 enough income to server their life.
Table 4.11 Post hoc test of employee satisfaction among education group
(I) Education (J) Education
Mean Difference
(I-J) Std. Error Sig.
95% Confidence Interval
Lower Bound Upper Bound Above bachelor Bachelor .02867 .31003 .926 -.5826 .6400 College -.08961 .28759 .756 -.6567 .4775 Vocational -.00694 .28229 .980 -.5636 .5497 High school -.82323* .32725 .013 -1.4685 -.1780
Bachelor Above bachelor -.02867 .31003 .926 -.6400 .5826
College -.11828 .20059 .556 -.5138 .2772 Vocational -.03562 .19292 .854 -.4160 .3448 High school -.85191* .25421 .001 -1.3531 -.3507 College Above bachelor .08961 .28759 .756 -.4775 .6567
Bachelor .11828 .20059 .556 -.2772 .5138
Vocational .08266 .15429 .593 -.2216 .3869 High school -.73363* .22629 .001 -1.1798 -.2874
Vocational Above bachelor .00694 .28229 .980 -.5497 .5636
Bachelor .03562 .19292 .854 -.3448 .4160
College -.08266 .15429 .593 -.3869 .2216 High school -.81629* .21953 .000 -1.2491 -.3834 High school Above bachelor .82323* .32725 .013 .1780 1.4685
Bachelor .85191* .25421 .001 .3507 1.3531
College .73363* .22629 .001 .2874 1.1798 Vocational .81629* .21953 .000 .3834 1.2491 *. P<0.05.
- The differences among job behaviors (working experience and working position) and job
satisfaction for the employees who work in the NRC, Vietnam
+ The differences amongworking experience and job satisfaction
To test the different of employee satisfaction among working experience group, the ANOVA with 0.05 sig. is taken ( table 4.12) working experience group group include:< 5 year, 5 - 15 year and >15 year. The result indicates that employee in different working experience have different level of job satisfaction (F= 8.047; P=0.00)
30
Table 4.12Anova of working experience and job satisfaction
Sum of
Squares df Mean Square F Sig.
Between Groups 13.220 2 6.610 8.047 .000
Within Groups 167.558 204 .821
Total 180.777 206
To find the detail of different of employee satisfaction among working experience, post hoc test with Tukey HSDa- method is used. The result indicates that employee who are more than 15
year working experience in NRChave more satisfaction than other group (P<0.05). This may be come from the workingexperience in NRC and they are the people who is getting older, they do not have much need as the younger.
Table 4.13 Post hoc test of employee satisfaction among experienc group
(I) Experienc (J) Experienc
Mean Difference
(I-J) Std. Error Sig.
95% Confidence Interval
Lower Bound Upper Bound < 5 year 5 - 15 year -.23705 .14925 .114 -.5313 .0572 >15 year -.64720* .16254 .000 -.9677 -.3267 5 - 15 year < 5 year .23705 .14925 .114 -.0572 .5313 5 - 15 year -.41015* .15549 .009 -.7167 -.1036 5 - 15 year < 5 year .64720* .16254 .000 .3267 .9677 5 - 15 year .41015* .15549 .009 .1036 .7167 *. The mean difference is significant at the 0.05 level.
+ The differences between Position and job satisfaction
To test the The differences between Position and job satisfaction, t-test is used. Using the alpha of 0.05, the independent t-test indicate the that the average level of satisfaction of Staff office (M= 2.6911, SD=.66829) is significant difference from Worker (M= 3.0783, SD=.97850), t (1) = -2.398, p<0.05. It can be concluded that employee who is Worker have more satisfaction than Staff office, it is reasonable and consistent with above analysis since worker who is get the lower education, even the fact that they are almost older than Staff office.
31 Position N Mean Std. Deviation Std. Error Mean t Sig. (2-tailed) SATI Staff office 41 2.6911 .66829 .10437 -2.398 .017
Worker 166 3.0783 .97850 .07595 -3.000 .004 From the t-test and anova result, there is only gender is do not have the differences between male and female related to job satisfaction. Other has significant difference. So it cat be concluded that H7 and H8 is supported by the analysis result.
32
Chapter V Conclusion and recommendation
5.1 Conclusion
The aim of this paper is study the factor effect the employee satisfaction. This study shows that employee satisfaction is impacted by 6 factor: X1- Working environment, X2- Salary, X3- Colleague, X4- Training and promotion, X5- Welfare, X6- Reward policy in case of NRC. This result consistent with the other result when study the employee satisfaction such as: Tran Kim Dung (2005), Duong (2009) and Ha (2011), in her studies, the Salary and Colleague have positive relationship with employee satisfaction. The order level of the influential factors in the model to job satisfaction of employee in NRP from high to low, as follows:1. Working environment (beta = 0.333), 2. Salary (beta = 0.303), 3. Training and promotion (beta = 0.225), 4. Colleague (beta= 0.125), 5. Reward policy (beta = 0.124), 6. Welfare (beta = 0.109).
For testing the hypothesis 7 and 8 this study uses t-test and Anova to test the differences between Socio-demographics and job behaviors. The result shows that there is not significant difference between male and female in job satisfaction. The result indicates that employee in different age group, education level, working experience and postion have different level of satisfaction
5.2 Recommendation
1) Regarding the salary, the company should have a wage policy distinguish between two objects: administrative office staff and worker. With these allowances are being applied, the need to make full and accurate, especially for the new allowances. The company need to develop specific criteria for reward and clear, there is a discussion of the staff in the NRC so that the policies provide adequate reward. NRC need to reduce paperwork in the process of implementation of welfare policies in order to create favorable conditions for employees in the process of approaching
2) To create a working atmosphere is always fun, there must be movement from the employees themselves, because they are the people spend 8 hours a day to go out, touching the face, talk, discuss with your colleagues. However the upper level can also impact the environment and build up the work open to its employees. Superiors should show employees understand the creation of relationships between co-workers together in the
33
company is very important, nobody can cooperate with each other while the people around, superiors as a bridge, locomotive, able to be joyful, open, close to every person, encourage employees to build a friendly working environment.
3) Organizing classes’ necessary professional expertise of staff. Understanding the characteristics and requirements of the job; at the same time, based on the strengths and weaknesses of the employee to the staff entrusted to capable to fulfill the job. Staff assigned to the project and complete challenging tasks, giving them the opportunity to work with a new project or task to help build up more of their skills and give them a chance to shine.
5.3 Research contribution
Through the study of theoretical and practical survey of employee satisfaction on the job at the NRC, the results show that satisfaction with the NRC staff quite high, but still a number of factors are evaluated lower than overall satisfaction, so company need to focus strongly on issues such as wages, bonuses, allowances and with the strengthening of the mounted in the case. This will bring satisfaction for staff, maintenance staff and contribute to the overall development of the company.
5.4 Research limitation
However, the research is also limited, given the model has not been completely explained the satisfaction of employees, especially research not consider the influence of other external factors ( social, cultural ...) affect the satisfaction of employees. Therefore, future studies could add several other influencing factors such as culture, family, society on the model to determine the correlation between these factors to the level of satisfaction at work of employee.
34
Reference:
Chang, S. C., & Lee, M. S. (2007). A study on relationship among leadership, organizational culture, the operation of learning organization and employees' job satisfaction. The Learning Organization, 14(2), 155-185.
Chang, S. C., & Lee, M. S. (2007). A study on relationship among leadership, organizational culture, the operation of learning organization and employees' job satisfaction. The Learning Organization, 14(2), 155-185.
Crossman, A., & Abou-Zaki, B. (2003). Job satisfaction and employee performance of Lebanese banking staff. Journal of Managerial Psychology, 18(4), 368-376.
Cynthia D. Fisher and Anne Xue Ya Yuan (1998), “What motivates employees? A comparison of US and Chinese responses”, The International Journal of Human Resource, Volume 9 Issue 3 1998, tr. 516-528.
Del Rosario González Ovalle, M., Alvarado Márquez, J. A., & Martínez Salomón, S. D. (2004). A compilation of resources on knowledge cities and knowledge-based development. Journal of knowledge management, 8(5), 107-127.
Forman, H. I. (1946). Importance of the American Patent System to the Average Lawyer.
Temp. LQ, 20, 403.
Guidestar Reasearch (2005), Driving Employee Satisfaction, Commitment and Loyalty, New York, NY 10028, USA.
35
tốt nghiệp, Trường Đại học Kinh Tế Tp HCM, Hồ Chí Minh.
Hair Jr., J. F., Anderson, R. E., Tatham, R. L., Black, W. C. (1992), Multivariate Data Analysis with Readings, 3rd ed., Macmillan Publishing Company, London, UK.
Harter, J. K., Schmidt, F. L., & Hayes, T. L. (2002). Business-unit-level relationship between employee satisfaction, employee engagement, and business outcomes: a meta-analysis. Journal of applied psychology, 87(2), 268.
Herzberg, F. (1959). MAUSNER. B.; SNYDERMAN, B. The motivation to work. New
York: Willy.
Hoàng Trọng, Chu Nguyễn Mộng Ngọc (2008), Phân tích dữ liệu nghiên cứu với SPSS (Tập 1), Nxb Hồng Đức, Tp.HCM.
Hoàng Trọng, Chu Nguyễn Mộng Ngọc (2008), Phân tích dữ liệu nghiên cứu với SPSS (Tập 2), Nxb Hồng Đức, Tp.HCM.
Hoàng Trọng, Chu Nguyễn Mộng Ngọc (2011), Thống kê ứng dụng trong kinh tế - xã hội, Nxb Lao động – Xã hội, Hà Nội.
Kreitner, R., Kinicki, A., & Cole, N. (2007). Fundamentals of organizational behaviour. Li, Z., & Fox, J. M. (2012). Mapping rubber tree growth in mainland Southeast Asia using time-series MODIS 250 m NDVI and statistical data. Applied Geography, 32(2), 420-432. Luddy, Nezaam. "Job satisfaction amongst employees at a public health institution in the Western Cape." PhD diss., University of the Western Cape, 2005.
36
Man Power Inc. (2002), International Loyalty Survey, Wisconsin, USA. [19]. Susan Dunn (2003), The Top Ten Things Employees Say They Want & How Managers Miss the Mark by Low Emotional Intelligence, The EQ Coach, Califonia, USA.
Nguyễn Hữu Thân (2004), Giáo trình quản trị nhân sự, Nxb Thống kê, Tp.HCM.
Nguyễn Văn Điệp (2007), Các yếu tố ảnh hưởng đến sự thỏa mãn và sự gắn kết của nhân viên hợp tác xã thương mại Thành phố Hồ Chí Minh, Luận văn thạc sĩ kinh tế, Trường Đại học Kinh Tế Tp.HCM, Hồ Chí Minh.
Nguyễn Vũ Duy Nhất (2009), Ảnh hưởng của sự hài lòng đến nỗ lực và lòng trung thành của nhân viên trong ngành dịch vụ viễn thông tại Việt Nam, Luận văn thạc sĩ kinh tế, Trường Đại học Kinh Tế Tp.HCM, Hồ Chí Minh.
Phan Quốc Dũng (2009), Các nhân tố ảnh hưởng đến sự trung thành của nhân viên trong tổ chức, Luận văn thạc sĩ kinh tế, Trường Đại học Kinh Tế Tp.HCM, Hồ Chí Minh.
Rounds, J. B., Dawis, R., & Lofquist, L. H. (1987). Measurement of person-environment fit and prediction of satisfaction in the theory of work adjustment. Journal of Vocational
Behavior, 31(3), 297-318.
Smith, P. C. (1969). The measurement of satisfaction in work and retirement: A strategy for the study of attitudes.
Smith, P. C., Kendall, L. M., & Hulin, C. L. (1985). The job descriptive index. Psychology
Department, Bowling Green State University (Bowling Green, OH).
37
(Vol. 3). Sage publications.
Spector, P. E. (1997). Job satisfaction: Application, assessment, causes, and consequences (Vol. 3). Sage publications.
Trần Kim Dung (2005), Giáo trình quản trị nguồn nhân lực, Nxb Thống kê, Tp.HCM. Trần Kim Dung (2005), Nhu cầu, sự thỏa mãn của nhân viên và mức độ gắn kết đối với tổ chức, Đề tài nghiên cứu khoa học cấp Bộ, Trường Đại học Kinh Tế Tp.HCM.
Trần Kim Dung, Nguyễn Thị Mai Trang (2007), Ảnh hưởng của văn hóa tổ chức và phong cách lãnh đạo đến kết quả làm việc của nhân viên và lòng trung thành của họ đối với tổ chức, Nghiên cứu khoa học cấp Bộ, Trường Đại học Kinh Tế Tp.HCM, Hồ Chí Minh. Trần Thị Thu Trang (2006), Ảnh hưởng của phong cách lãnh đạo mới về chất đến sự thỏa mãn và lòng trung thành của nhân viên đối với tổ chức, Luận văn thạc sĩ kinh tế, Trường Đại học Kinh Tế Tp.HCM, Hồ Chí Minh.
Vroom, V. H. (1964). Work and motivation.
Vũ Khắc Đạt (2009), Các yếu tố tác động đến lòng trung thành của nhân viên tại Văn phòng Khu vực miền Nam Vietnam Airlines, Luận vănn thạc sĩ kinh tế, Trường Đại học Kinh tế Tp.HCM, Hồ Chí Minh.
Weatherbee, D. E. (2014). International relations in Southeast Asia: the struggle for
38
Appendix: Questionnaire (English Version)
Part I . Motivation and Its effecting factors
Please read the following statements and tick the level agreed under your personal opinion 1 = Strongly Disagree
2= Disagree 3= Neutral 4= Agree
5= Strongly Agree
Statements level agreed
1 Your workplace is safe? 1 2 3 4 5
2 Your workplace is clean and cool? 1 2 3 4 5
3 You are provided fully equipment to support your work? 1 2 3 4 5
4 Your equipment is very modern? 1 2 3 4 5
5 Temperature, light, noise in workplace is suitable 1 2 3 4 5
6 You feel comfortable with your manager? 1 2 3 4 5
7 You get high wages? 1 2 3 4 5
I am a Vietnamese graduate student of International Master of Business of Administration program I-Show University, Taiwan. My master thesis is about Factors Effecting Employee Job Satisfaction of Nghe An Rubber Company” Please take about 10 to 15 minutes to answer all of the questions in my survey. The answers will only be used for academic purposes and will be strictly confidential. Thank you in advance for your time and help.
39
8 Your current salary is deserved with your ability? 1 2 3 4 5
9 Company is fair payment 1 2 3 4 5
10 You live well based on income from company? 1 2 3 4 5
11 You think your income is higher than the other company? 1 2 3 4 5
1 You feel comfortable with your colleagues? 1 2 3 4 5
2 Colleagues are willing to help you at work? 1 2 3 4 5
3 You have a good teamwork with your colleagues? 1 2 3 4 5
4 Your manager always listen idea of employees? 1 2 3 4 5
5 Your manager always prove to be a friendly, respect for employees? 1 2 3 4 5
6 The company is very interested in the training of staff? 1 2 3 4 5
7 You participate in annual training program of the company? 1 2 3 4 5
8 The training program suit with your ability 1 2 3 4 5
1 You have chances to get promoted in the company? 1 2 3 4 5
2 You know the conditions are necessary to get promoted?
1 2 3 4 5
3 Company have social insurance, good health insurance?
1 2 3 4 5
4 You satisfied with the allowance as subsidized lunches, gifts as a birthday gift?
40 5 Welfare program of company is attractive?
1 2 3 4 5
6 Welfare of company is lower than the other companies?
1 2 3 4 5
7 Your achievement is recognized and evaluate well?
1 2 3 4 5
You get reward worthily with your contributions and dedication? 1 2 3 4 5
You get reward fairly when you completed well your work? 1 2 3 4 5
The company have clear policies and reward effective? 1 2 3 4 5
In general he / she likes this job; 1 2 3 4 5
In general he / she satisfied with the company;
1 2 3 4 5
He / she will work in the company long term. 1 2 3 4 5
Part II Demographic Information
1. Gender: £ Male £ Female
2. Age: £ 18-29 £ 30-39 £ 40-49 £ 50-59 £ 60 or over 3. Education: £ Middle School £ High School £ Under Bachelor (Associate Degree) £ Bachelor degree £ Master’s degree or higher
£Other__________________ 4. Your position at CMI Stone:
£ worker £ Office staff £ Other__________________
5. Your work experience at CMI Stone: