On IPO Market Anomalies through the Emerging Stock Market in Taiwan
20
0
0
全文
(2) 58. International Journal of Business and Economics. explain the two phenomena. For short-term IPO underpricing, Rock (1986) and Benveniste and Spindt (1989) suggest that if some investors are better informed than others then underpricing becomes a form of compensation by which underwriters attract uninformed investor participation in the IPO market. The general consensus in the IPO literature is that uncertainty is costly for IPO firms. Derrien and Kecskes (2007) examined the UK market, where issuers can choose between an IPO and a new listing unaccompanied by the issue of new shares, and found that IPO underpricing is considerably lower if firms undergo a listing period before offering new shares to the public. This two-stage offering strategy can reduce valuation uncertainty, thus reducing the underpricing necessary when firms sell new shares. Unlike the listing market in the UK, the new issue market in Taiwan has undergone a unique market reform implemented by government officials, which is ideal for examining the two-part IPO puzzle. The introduction of this regulatory reform also involves a two-stage offering strategy. Firms wishing to raise equity capital may choose to list and trade via brokerage houses in the first stage and to sell new shares to the public in the second stage. From January 2002, the Taiwanese Financial Supervisory Commission (TFSC) established a pre-IPO market, the Emerging Stock Market (ESM), to protect investors from being deceived by underground brokers while trading unlisted stocks. The initial objective of ESM was to provide investors with a “more transparent” market environment and to offer issuers the option of registering their equity shares as “emerging stocks” and trading at brokerage houses before an IPO. Subsequently, the issuers could go public by filing an application with one of the two listing markets: the Taiwan Stock Exchange (TWSE) or the Gre Tai Securities Market (GTSM). Firms that completed the two-stage offering strategy are termed ESM firms below. Alternatively, firms that went public on either the TWSE or the GTSM markets without participating in the ESM are termed direct listing firms below. Restated, issuers can select between direct and two-stage listings. Following January 2005, a mandatory policy was introduced requiring all issuers to attend ESM for at least six months before going public. This study investigates the short-term underpricing and long-term performance of IPO firms in Taiwan. Similar to Derrien and Kecskes (2007), we first examine short-term IPO underpricing by comparing the IPO abnormal returns between ESM and direct listing firms; we propose that firms that select to complete ESM listing may reduce the cost of information production borne by the issuers. The implication is that ESM firms should have smaller IPO underpricing than direct listing firms. Second, the two-stage listing policy allows issuers to build market expectations during the first offering stage. Jain and Kini (1994) argue that managers of issuing firms may time their issues to coincide with periods of strong performance, which they know is unsustainable. Manager timing activities are termed the window-of-opportunity hypothesis. Managers may also attempt to window-dress financial statements by overstating performance levels during the pre-IPO period. Either manager timing or window-dressing action will lead investors to develop optimistic expectations regarding future earnings growth of the issuing firm during.
(3) Yi-Shuan Chen and Shin-Herng Michelle Chu. 59. the post-IPO period, which is termed the overly-optimistic-market-expectations hypothesis. The first stage of listing and trading on the ESM prior to offering new shares to the public gives managers an extended period to time their issues and build up investor expectations, and thus the long-term underperformance of IPO firms should be more extreme for ESM firms than direct listing firms. This investigation analyzes the IPO two-part puzzle using the unique ESM two-stage IPO offering process relative to a direct IPO. In Taiwan, IPOs can be listed either on the Taiwan Stock Exchange Market (TWSE) or the Gre Tai Securities Market (GTSM). According to the Securities Market Regulations, the listing requirements, including those related to length of corporate existence, paid-in-capital, profitability, and decentralization of ownership structure, are more stringent for firms listed on the TWSE than on the GTSM. Consequently, we consider four types of firms: Type 1: From private firm to ESM listing, followed by final listing on the TWSE (ESM-TWSE) Type 2: From private firm to ESM listing, followed by final listing on the GTSM (ESM-GTSM) Type 3: From private firm to direct listing on the TWSE (Direct-Listing-TWSE) Type 4: From private firm to direct listing on the GTSM (Direct-Listing-GTSM) Using the terminology introduced above, Types 1 and 2 are termed ESM firms while Types 3 and 4 are labeled direct listing firms. The sample comprises 465 Taiwanese firms that listed from 1999 to 2004. For all four types of firms, we find that issuing firm operating performance improved markedly during the pre-listing period and then declined during the post-IPO period. Consistent with previous research by Jain and Kini (1994), Loughran and Ritter (1997), and Yan and Cai (2003), the empirical results demonstrate that the post-issue deterioration in operating performance is worse for ESM firms than for directl listing firms. This phenomenon applies to TWSE listed IPOs (Type 1 firms underperformed Type 3 firms) but not GTSM new issues (Type 2 and Type 4 firms both exhibited similar operating performance). Consequently, we attempt to identify factors explaining the more profound operating deterioration of the ESM firms listed on the TWSE by investigating the overly-optimistic-market-expectations and the window-of-opportunity hypotheses. Following paired sample adjustment, the study results support the overly-optimistic-market-expectations hypothesis. We find that market expectations regarding future earnings growth for ESM firms are more optimistic than those for direct listing firms (Type 1 versus Type 3). Additionally, the sales of ESM firms are disproportionably small during the post-IPO period relative to the rapid expansions in sales during the pre-IPO period. This suggests that managers of ESM firms exploit the unusually strong performance levels by entering ESM during the pre-IPO period, which supports the window-of-opportunity hypothesis. The remainder of this paper is organized as follows. Section 2 reports sample statistics and the sample selection procedure. Empirical findings are then presented.
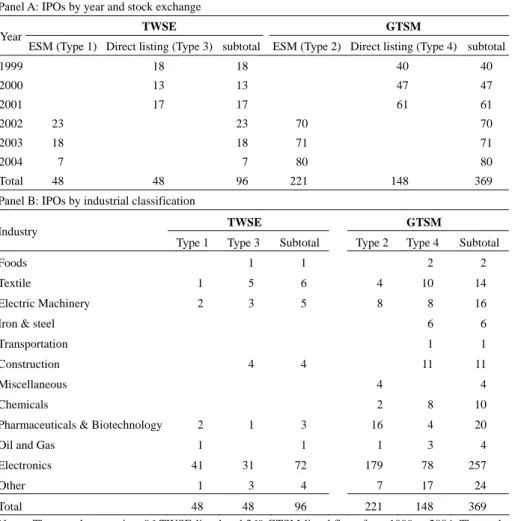
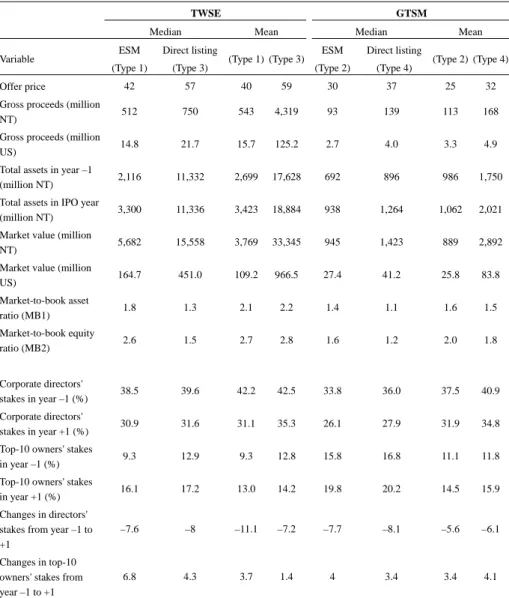
(4) 60. International Journal of Business and Economics. in Sections 3 and 4. Section 5 presents conclusions. 2. Sample The study data are obtained from the Taiwan Economic Journal database. Sample IPO firms must have complete financial information and stock price data for three years before and after the offering date (year 0); additionally, the sample excludes financial industry firms. The final sample comprises 465 IPOs during the 1999–2004 period. Beginning from January 2005, the TFSC added an article that requires issuing firms to attend ESM for at least six months before going public. Therefore, the sample period could not be extended beyond the end of 2004. For ESM firms, the listing period before an IPO can span anything from several months to two years. Afterwards, they have the option of going public on either the TWSE or GTSM. Therefore, the pre-ESM period (from years –3 to –1) is numbered relative to the registration year of ESM, while the post-ESM period (from years +1 to +3) is numbered relative to the IPO year. Panel A of Table 1 summarizes the 465 sample IPO firms, of which 96 are TWSE-listed firms while 369 are GTSM-listed firms. The TWSE-listed sample comprises 48 ESM firms and 48 direct listing firms; meanwhile, the GTSM-listed sample comprises 221 ESM firms and 148 direct listing firms. For the TWSE-listed sample, over 80% (41 out of 48) of the ESM firms are in the electronics industry; however, approximately 65% (31 out of 48) of the direct listing firms are electronic companies. Similar results are found for the GTSM-listed sample, namely that the percentages of the ESM firms and the direct listing firms in the electronics industry are 81% (179 out of 221) and 53% (78 out of 148), respectively. From the industry distribution in sample IPO, electronics industry firms appear more likely to attend ESM before publicly listing on the TWSE or GTSM. Table 2 lists sample descriptive statistics for Taiwanese IPOs issued over 1999–2004. We summarize the sample profile in terms of offer price, gross proceeds, total assets, market value, and market-to-book ratios for the IPO calendar year. The median measures of these variables are greater for direct listing firms than for ESM firms. For example, Type 1 firms appear to have smaller gross proceeds and asset sizes than Type 3 firms. However, the median market-to-book asset ratio is higher for Type 1 firms (1.8) than for Type 3 firms (1.3), implying that the market expects higher growth for ESM firms. Table 2 also lists summary statistics on two ownership structure variables: changes in directors and changes in top-10 owners from year –1 to +1. Contrasting the pre- and post-listing years, director ownership decreases, whereas top-10 ownership stakes increase for all types of sample firms. 3. Empirical Testing on Short-Term Initial Returns of IPOs This section examines whether initial returns are smaller for ESM firms than direct listing firms for each listing market. As discussed above, firms that choose to complete the ESM listing may reduce.
(5) Yi-Shuan Chen and Shin-Herng Michelle Chu. 61. valuation uncertainty during the IPO process, and thus we expect to find a smaller IPO underpricing for ESM firms compared to direct listing firms. In this investigation, the short-term underpricing of an IPO issue is defined as an “initial return” and is calculated as the difference between the offer and closing prices on the offer day divided by the offer price (see Ritter, 1991; Loughran and Ritter, 1995; Chen et al., 2000; and Chan et al., 2004). Table 1. IPO Sample Characteristics Panel A: IPOs by year and stock exchange Year. TWSE. GTSM. ESM (Type 1) Direct listing (Type 3) subtotal. ESM (Type 2) Direct listing (Type 4) subtotal. 1999. 18. 18. 40. 40. 2000. 13. 13. 47. 47. 2001. 17. 17. 61. 61. 2002. 23. 23. 70. 2003. 18. 18. 71. 71. 2004. 7. 7. 80. 80. Total. 48. 96. 221. 48. 70. 148. 369. Panel B: IPOs by industrial classification TWSE. Industry Type 1 Foods. Type 3. GTSM Subtotal. 1. 1. Type 2. Type 4. Subtotal. 2. 2. Textile. 1. 5. 6. 4. 10. 14. Electric Machinery. 2. 3. 5. 8. 8. 16. 6. 6. Iron & steel Transportation Construction. 4. 4. 1. 1. 11. 11. Miscellaneous. 4. Chemicals. 2. 8. 10. 16. 4. 20. Pharmaceuticals & Biotechnology. 2. 1. 3. 4. Oil and Gas. 1. 1. 1. 3. 4. Electronics. 41. 31. 72. 179. 78. 257. 1. 3. 4. 7. 17. 24. Other. Total 48 48 96 221 148 369 Notes: The sample comprises 96 TWSE-listed and 369 GTSM-listed firms from 1999 to 2004. The study data are retrieved from Taiwan Economic Journal database. The sample is partitioned into two sub-samples—ESM and direct listing firms—based on whether or not firms participated in the ESM before its IPO..
(6) 62. International Journal of Business and Economics Table 2. Sample Summary Statistics TWSE. GTSM. Median. Mean. ESM. Direct listing. (Type 1). (Type 3). Offer price. 42. 57. 40. Gross proceeds (million NT). 512. 750. Gross proceeds (million US). 14.8. Total assets in year –1 (million NT). Median. Mean. ESM. Direct listing. (Type 2). (Type 4). 59. 30. 37. 25. 32. 543. 4,319. 93. 139. 113. 168. 21.7. 15.7. 125.2. 2.7. 4.0. 3.3. 4.9. 2,116. 11,332. 2,699. 17,628. 692. 896. 986. 1,750. Total assets in IPO year (million NT). 3,300. 11,336. 3,423. 18,884. 938. 1,264. 1,062. 2,021. Market value (million NT). 5,682. 15,558. 3,769. 33,345. 945. 1,423. 889. 2,892. Market value (million US). 164.7. 451.0. 109.2. 966.5. 27.4. 41.2. 25.8. 83.8. Market-to-book asset ratio (MB1). 1.8. 1.3. 2.1. 2.2. 1.4. 1.1. 1.6. 1.5. Market-to-book equity ratio (MB2). 2.6. 1.5. 2.7. 2.8. 1.6. 1.2. 2.0. 1.8. Corporate directors' stakes in year –1 (%). 38.5. 39.6. 42.2. 42.5. 33.8. 36.0. 37.5. 40.9. Corporate directors' stakes in year +1 (%). 30.9. 31.6. 31.1. 35.3. 26.1. 27.9. 31.9. 34.8. Top-10 owners' stakes in year –1 (%). 9.3. 12.9. 9.3. 12.8. 15.8. 16.8. 11.1. 11.8. Top-10 owners' stakes in year +1 (%). 16.1. 17.2. 13.0. 14.2. 19.8. 20.2. 14.5. 15.9. Changes in directors' stakes from year –1 to +1. –7.6. –8. –11.1. –7.2. –7.7. –8.1. –5.6. –6.1. Changes in top-10 owners' stakes from year –1 to +1. 6.8. 4.3. 3.7. 1.4. 4. 3.4. 3.4. 4.1. Variable. (Type 1) (Type 3). (Type 2) (Type 4). Notes: This table shows summary statistics for primary characteristics of 465 IPO firms issued over 1999–2004. NT denotes the Taiwanese currency unit. Gross proceeds are measured in million NT and US dollars. The foreign exchange between NT and US dollars is based on 34.5 NT = 1 US, the average price on spot market in the year 2002. Total assets are calculated at the end of year –1 and in the IPO year, respectively. The variables of market value and market-to-book ratio are measured at the end of the IPO year. The proxy variables for ownership structure include shareholdings of corporate directors, top-10 shareholders. The last six rows of this table contrast a change in the shareholdings of corporate directors, top-10 owners from years –1 to +1. For the ESM subsample, the pre-ESM period (years –3 to –1) is numbered relative to the year of participation in ESM, while the post-ESM period (year +1 to +3) is numbered relative to the IPO year. For the direct listing subsample, the IPO period (years –3 to +3) is numbered relative to the listing year..
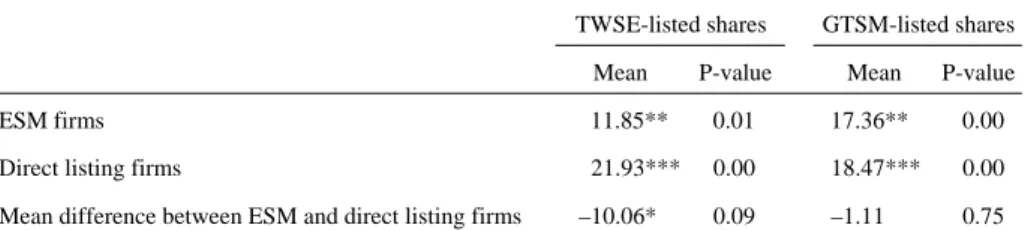
(7) Yi-Shuan Chen and Shin-Herng Michelle Chu. 63. Before 2005, exchange markets in Taiwan required that daily price movements not exceed 7% in either direction. Thus, new issues often enjoyed a period of price rises on and after the offer day. This period is known as the “honeymoon period” for Taiwanese IPOs. Following the honeymoon period, market adjustments were fully reflected and prices were said to be “opened” to the regulated limit and resumed normal fluctuations. This particular market feature modifies the initial return definition by replacing the closing price on the offer day with that at the end of the honeymoon period, that is, on the day where daily price movements no longer exceed the price limit. Within each exchange market, the initial return (IR) is calculated as follows: IR =. Pop P0. −. Indexop Index0. ,. (1). where Pop is the closing price at the end of the honeymoon period, i.e., the closing price on the “price opening” day (day OP), P0 is the underwriter offer price, Indexop is the stock market index at the end of the day OP, and Index0 is the stock market index one trading day before the IPO day (day 0). The mean initial market-adjusted return is calculated as: ARt =. 1 N. N. ∑ IR j =1. jt. ,. (2). where N denotes the number of firms in the IPO sample. Table 3 lists the estimated initial returns for IPOs within each exchange market. For ESM firms, the market-adjusted return is smaller than for direct listing firms, a result that is consistent for both TWSE-listed and GTSM-listed IPOs. However, the test statistic for the mean difference between the ESM and direct listing firms in the GTSM is not significant at the 10% level. The analytical results indicate that initial returns for ESM firms are approximately 50% less than for direct listing IPOs in the TWSE. Initial returns are taken as the indirect cost of issuing equity; thus the two-stage listing procedure appears cheaper for issuers in the TWSE. 4. Empirical Testing on Long-Term Operating Performance of IPO Firms Next, we turn to analyzing the second part of the IPO anomaly: the long-term operating underperformance of IPO firms. Following earlier investigations, we use four profitability ratios to examine changes in corporate operating performance around the time of the listing. The first profitability measure is the ratio of operating income to total assets. To control for the influence of changes in capital structure and accounting methods, we define operating income as income before taxes and interest payments (EBITDA). This definition is consistent with that of Yan and Cai (2003) but differs from that of Loughran and Ritter (1997), which includes interest income in its measure of operating income. Profit margin is calculated as the ratio of net.
(8) 64. International Journal of Business and Economics. income including extraordinary items to sales. Cash-flow margin is computed as the ratio of operating income to sales. Finally, asset turnover ratio, which measures asset utilization, is defined as the ratio of sales to total assets. Table 3. Initial Market-Adjusted Returns for IPOs for Each Exchange Market TWSE-listed shares Mean. GTSM-listed shares. P-value. Mean. P-value. ESM firms. 11.85**. 0.01. 17.36**. 0.00. Direct listing firms. 21.93***. 0.00. 18.47***. 0.00. 0.09. –1.11. 0.75. Mean difference between ESM and direct listing firms. –10.06*. Notes: The initial return within each exchange (TWSE and GTSM) is calculated as the difference between the closing price on the day OP (the day when daily price movements no longer exceed the price limit) and the underwriter offer price divided by underwriter offer price. The market benchmarks for TWSE-listed and GTSM-listed firms are stock exchange index on the corresponding days. The initial market-adjusted returns are calculated as the initial returns minus the market-benchmark returns. t-tests were employed to test the equality of mean differences. ***, **, and * denotes significance at the 1%, 5%, and 10% levels, respectively.. Since the probability distributions of operating performance measures are normally skewed, we use the median rather than mean to measure central tendency. To ensure that the median of the issuers is not a manifestation of mean reversion, it is adjusted by either an industry median or matching firm median in the existing literature. Jain and Kini (1994) adopt the industry-median-adjusted method to measure changes in operating performance by matching each IPO firm against other firms in the same industry then taking the difference between the change in the operating performance of the target firm and the median change in operating performance of all firms in the target industry. Yan and Cai (2003) adopt both the industry median adjustment method and the matching firm adjustment method to determine changes in operating performance before and after the IPO. For each IPO firm, they select the firm with the closest operating-related ratio in the same industry as the benchmark and perform a benchmark-matched comparison. They conclude that the two approaches yield similar results. Since the Taiwanese equity market is relatively small in terms of total capitalization, we adopt the industry median adjustment method to analyze the post-issue operating performance of IPO firms. For each IPO firm in the ESM and direct listing subsamples, we construct the matching sample by selecting firms in the same industry based on the same 2-digit industrial classification codes at the end of year –1. To analyze post-issue operating performance, we follow Nohel and Tarhan (1998) and define abnormal performance as the paired difference of operating measures between issuing firms and corresponding matching firms. To test the statistical significance in these abnormal operating performance variables, we perform matched-paired nonparametric Wilcoxon signed-rank tests under the assumption that sample and matched firms are drawn from the same distribution. If the test statistics for abnormal operating figures are negative and significant, operating performance deteriorates for the IPO firm.
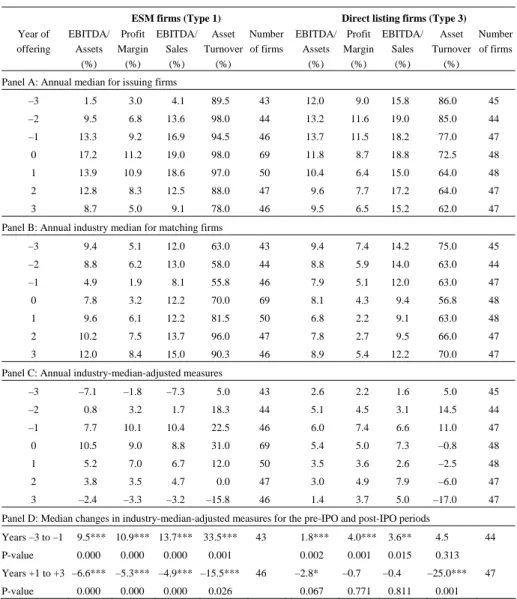
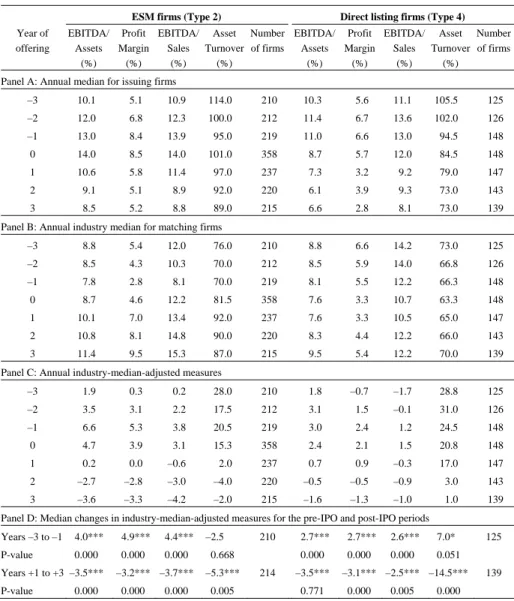
(9) Yi-Shuan Chen and Shin-Herng Michelle Chu. 65. post-IPO. One objective of this study is to investigate whether the two-stage listing policy has a stronger effect on post-IPO operating deterioration relative to direct listing policy; this is achieved by using nonparametric Mann-Whitney U-tests to examine the equality of median changes in industry-median-adjusted operating performance measures over the pre-IPO and post-IPO periods (years –3 to –1 and years +1 to +3) between ESM and direct listing firms. 4.1 Analysis of Post-IPO Operating Performance 4.1.1 Comparison of Operating Performance between ESM and Direct Listing Firms Within each exchange market in Taiwan, we compare operating performance between ESM and direct listing firms three years before and after the IPO year. Tables 4 and 5 present evidence for TWSE and GTSM firms. The four profitability ratios in Panel A of Table 4 show median statistics, indicating that the operating performance of the issuing firms peaks at year 0 and then declines. For example, the ratio of operating income to assets for Type 1 firms rose from 1.5% to 17.2% (the event year), and then dropped to 8.7% in year +3. However, no clear pattern exists for matching firms (see Panel B). Panel C of Table 4 lists the median operating performance measures for the industry-median-adjusted sample. The analytical results demonstrate that the operating performance measures of the issuing firms rise steadily and faster than the median levels of the matching firms during the pre-issue years, while the opposite occurs post-issue. Additionally, for each IPO firm, we calculate the median changes in operating performance measures for the pre-IPO period (year –1 relative to year –3) and post-IPO period (year +1 relative to year +3), then use the nonparametric Wilcoxon signed rank test to examine the equality of medians between the pre- and post-IPO periods. Panel D of Table 4 shows that most of the median changes in operating performance measures for the post-IPO period are negative and significant at the 1% level. We repeat the tests for firms listed on the GTSM (Type 2 versus Type 4 firms). The empirical results listed in Table 5 resemble those listed in Table 4. Thus, we conclude that for all sample IPO firms, regardless of whether they choose the two-stage or direct listing approaches or whether they list on the TWSE or GTSM, operating performance deteriorated over the three years following the offering year. 4.1.2 Performance Comparison: ESM versus Direct Listing Firms by Listing Markets Since the listing criteria for the TWSE are stricter than those for the GTSM, firms that cannot meet the TWSE listing criteria will choose to list on the GTSM. Typically firms that do this are smaller and involved in riskier businesses. Given the nature of the two exchange markets in Taiwan, we compare pre-IPO and post-IPO operating performance between ESM and direct listing firms by listing markets..
(10) 66. International Journal of Business and Economics Table 4. Operating Performance Comparison between TWSE-Listed Firms and Industry-Based Matching Firms. Year of offering. ESM firms (Type 1) EBITDA/ Profit EBITDA/ Asset Number Assets Margin Sales Turnover of firms (%) (%) (%) (%). Direct listing firms (Type 3) EBITDA/ Profit EBITDA/ Asset Number Assets Margin Sales Turnover of firms (%) (%) (%) (%). Panel A: Annual median for issuing firms –3. 1.5. 3.0. 4.1. 89.5. 43. 12.0. 9.0. 15.8. 86.0. 45. –2. 9.5. 6.8. 13.6. 98.0. 44. 13.2. 11.6. 19.0. 85.0. 44. –1. 13.3. 9.2. 16.9. 94.5. 46. 13.7. 11.5. 18.2. 77.0. 47. 0. 17.2. 11.2. 19.0. 98.0. 69. 11.8. 8.7. 18.8. 72.5. 48. 1. 13.9. 10.9. 18.6. 97.0. 50. 10.4. 6.4. 15.0. 64.0. 48. 2. 12.8. 8.3. 12.5. 88.0. 47. 9.6. 7.7. 17.2. 64.0. 47. 3. 8.7. 5.0. 9.1. 78.0. 46. 9.5. 6.5. 15.2. 62.0. 47. Panel B: Annual industry median for matching firms –3. 9.4. 5.1. 12.0. 63.0. 43. 9.4. 7.4. 14.2. 75.0. 45. –2. 8.8. 6.2. 13.0. 58.0. 44. 8.8. 5.9. 14.0. 63.0. 44. –1. 4.9. 1.9. 8.1. 55.8. 46. 7.9. 5.1. 12.0. 63.0. 47. 0. 7.8. 3.2. 12.2. 70.0. 69. 8.1. 4.3. 9.4. 56.8. 48. 1. 9.6. 6.1. 12.2. 81.5. 50. 6.8. 2.2. 9.1. 63.0. 48. 2. 10.2. 7.5. 13.7. 96.0. 47. 7.8. 2.7. 9.5. 66.0. 47. 3. 12.0. 8.4. 15.0. 90.3. 46. 8.9. 5.4. 12.2. 70.0. 47. 45. Panel C: Annual industry-median-adjusted measures –3. –7.1. –1.8. –7.3. 5.0. 43. 2.6. 2.2. 1.6. 5.0. –2. 0.8. 3.2. 1.7. 18.3. 44. 5.1. 4.5. 3.1. 14.5. 44. –1. 7.7. 10.1. 10.4. 22.5. 46. 6.0. 7.4. 6.6. 11.0. 47. 0. 10.5. 9.0. 8.8. 31.0. 69. 5.4. 5.0. 7.3. –0.8. 48. 1. 5.2. 7.0. 6.7. 12.0. 50. 3.5. 3.6. 2.6. –2.5. 48. 2. 3.8. 3.5. 4.7. 0.0. 47. 3.0. 4.9. 7.9. –6.0. 47. 3. –2.4. –3.3. –3.2. –15.8. 46. 1.4. 3.7. 5.0. –17.0. 47. Panel D: Median changes in industry-median-adjusted measures for the pre-IPO and post-IPO periods Years –3 to –1. 9.5*** 10.9*** 13.7***. P-value. 0.000. 0.000. 0.000. 33.5***. Years +1 to +3 –6.6*** –5.3*** –4.9*** –15.5*** P-value. 0.000. 0.000. 0.000. 43. 0.001. 0.026. 46. 1.8***. 4.0***. 3.6**. 4.5. 0.002. 0.001. 0.015. 0.313. –2.8* 0.067. –0.7 0.771. –0.4 0.811. –25.0***. 44. 47. 0.001. Notes: This table shows median operating performance measures of 96 TWSE-listed firms three years before and after issuance. It comprises 48 ESM firms and 48 direct listing firms. Operating performance measures include EBITDA (earnings before depreciation, interest, and taxes) to asset ratio, profit margin (net income to sales), cash-flow margin (EBITDA to sales), and asset turnover (sales to beginning-of-year market value of assets). Panels A and B reports the medians of operating performance for issuing firms and matching firms based on the same industrial classification codes at the end of year –1. Panel C shows the median of annual industry-median-adjusted measures, defined as performance of each IPO firm minus the median of its matching firms. Panel D displays the median changes in industry-median-adjusted measures for the pre-IPO and post-IPO periods. Paired nonparametric Wilcoxon tests are employed to test the equality of medians. P-values of Wilcoxon tests are presented under corresponding medians. ***, **, and * denote significance at the 1%, 5%, and 10% levels, respectively..
(11) Yi-Shuan Chen and Shin-Herng Michelle Chu. 67. Table 5. Operating Performance Comparison between GTSM-listed Firms and Industry-Based Matching Sample ESM firms (Type 2) Year of offering. Direct listing firms (Type 4). EBITDA/ Profit EBITDA/ Asset Number EBITDA/ Profit EBITDA/ Asset Number Sales Turnover of firms Margin Assets Sales Turnover of firms Margin Assets (%) (%) (%) (%) (%) (%) (%) (%). Panel A: Annual median for issuing firms –3. 10.1. 5.1. 10.9. 114.0. 210. 10.3. 5.6. 11.1. 105.5. 125. –2. 12.0. 6.8. 12.3. 100.0. 212. 11.4. 6.7. 13.6. 102.0. 126. –1. 13.0. 8.4. 13.9. 95.0. 219. 11.0. 6.6. 13.0. 94.5. 148. 0. 14.0. 8.5. 14.0. 101.0. 358. 8.7. 5.7. 12.0. 84.5. 148. 1. 10.6. 5.8. 11.4. 97.0. 237. 7.3. 3.2. 9.2. 79.0. 147. 2. 9.1. 5.1. 8.9. 92.0. 220. 6.1. 3.9. 9.3. 73.0. 143. 3. 8.5. 5.2. 8.8. 89.0. 215. 6.6. 2.8. 8.1. 73.0. 139. 125. Panel B: Annual industry median for matching firms –3. 8.8. 5.4. 12.0. 76.0. 210. 8.8. 6.6. 14.2. 73.0. –2. 8.5. 4.3. 10.3. 70.0. 212. 8.5. 5.9. 14.0. 66.8. 126. –1. 7.8. 2.8. 8.1. 70.0. 219. 8.1. 5.5. 12.2. 66.3. 148. 0. 8.7. 4.6. 12.2. 81.5. 358. 7.6. 3.3. 10.7. 63.3. 148. 1. 10.1. 7.0. 13.4. 92.0. 237. 7.6. 3.3. 10.5. 65.0. 147. 2. 10.8. 8.1. 14.8. 90.0. 220. 8.3. 4.4. 12.2. 66.0. 143. 3. 11.4. 9.5. 15.3. 87.0. 215. 9.5. 5.4. 12.2. 70.0. 139. Panel C: Annual industry-median-adjusted measures –3. 1.9. 0.3. 0.2. 28.0. 210. 1.8. –0.7. –1.7. 28.8. 125. –2. 3.5. 3.1. 2.2. 17.5. 212. 3.1. 1.5. –0.1. 31.0. 126. –1. 6.6. 5.3. 3.8. 20.5. 219. 3.0. 2.4. 1.2. 24.5. 148. 0. 4.7. 3.9. 3.1. 15.3. 358. 2.4. 2.1. 1.5. 20.8. 148. 1. 0.2. 0.0. –0.6. 2.0. 237. 0.7. 0.9. –0.3. 17.0. 147. 2. –2.7. –2.8. –3.0. –4.0. 220. –0.5. –0.5. –0.9. 3.0. 143. 3. –3.6. –3.3. –4.2. –2.0. 215. –1.6. –1.3. –1.0. 1.0. 139. 125. Panel D: Median changes in industry-median-adjusted measures for the pre-IPO and post-IPO periods Years –3 to –1. 4.0***. 4.9***. 4.4***. P-value. 0.000. 0.000. 0.000. Years +1 to +3 –3.5*** P-value. 0.000. –3.2*** –3.7*** 0.000. 0.000. –2.5. 210. 0.668 –5.3*** 0.005. 214. 2.7***. 2.7***. 2.6***. 7.0*. 0.000. 0.000. 0.000. 0.051. –3.5*** 0.771. –3.1*** –2.5*** –14.5*** 0.000. 0.005. 139. 0.000. Notes: This table shows median operating performance measures of GTSM-listed firms three years before and after issuance. It consists of 221 ESM firms and 148 direct listing firms. Operating performance measures include EBITDA (earnings before depreciation, interest, and taxes) to assets ratio, profit margin (net income to sales), cash-flow margin (EBITDA to sales), and asset turnover (sales to beginning-of-year market value of assets). Panels A and B report the medians of operating performance for issuing firms and matching firms based on the same industrial classification codes at the end of year –1. Panel C shows the median of annual industry-median-adjusted measures, defined as performance of each IPO firm minus the median of its matching firms. Panel D displays the median changes in industry-median-adjusted measures for the pre-IPO and post-IPO periods. Paired nonparametric Wilcoxon tests are employed to test the equality of the medians. P-values of Wilcoxon tests are presented under the corresponding medians. ***, **, and * denote significance at the 1%, 5%, and 10% levels, respectively..
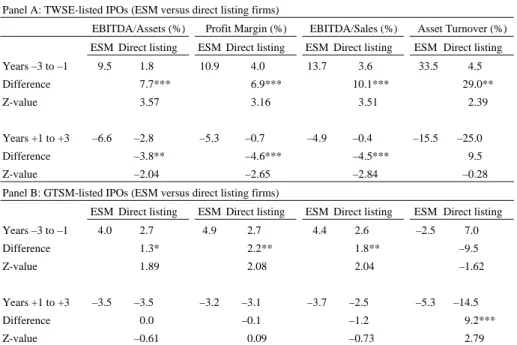
(12) 68. International Journal of Business and Economics. For each of the operating performance ratios, we first calculate median changes between years –3 and –1 (pre-listing period) and between years +1 and +3 (post-listing period). The difference in these median ratios is then taken over the pre-listing and post-IPO periods for the ESM and direct listing firms. Nonparametric Mann-Whitney statistic is used to test the hypothesis that the post-IPO performance for ESM firms does not differ from that for direct listing firms. Panel A of Table 6 shows that for TWSE-listed firms the median difference in operating income to asset ratio between ESM firms (Type 1) and direct listing firms (Type 3) is statistically significant and positive (7.7%) for the pre-listing period but statistically significant and negative (–3.8%) for the post-listing period. Table 6. Statistical Tests on Industry-Median-Adjusted Operating Performance Difference between ESM and Direct Listing Firms Panel A: TWSE-listed IPOs (ESM versus direct listing firms) EBITDA/Assets (%) ESM Direct listing Years –3 to –1. 9.5. 1.8. Profit Margin (%). ESM Direct listing. 10.9. 13.7. 4.0. Difference. 7.7***. 6.9***. Z-value. 3.57. 3.16. Years +1 to +3. –6.6. –2.8. EBITDA/Sales (%). ESM Direct listing. –5.3. –0.7. –4.9. 3.6. Asset Turnover (%) ESM Direct listing 33.5. 4.5. 10.1***. 29.0**. 3.51. 2.39. –0.4. Difference. –3.8**. –4.6***. –4.5***. Z-value. –2.04. –2.65. –2.84. –15.5. –25.0 9.5 –0.28. Panel B: GTSM-listed IPOs (ESM versus direct listing firms) ESM Direct listing Years –3 to –1. 4.0. 2.7. ESM Direct listing 4.9. 2.7. ESM Direct listing 4.4. 2.6. ESM Direct listing –2.5. 7.0. Difference. 1.3*. 2.2**. 1.8**. –9.5. Z-value. 1.89. 2.08. 2.04. –1.62. Years +1 to +3 Difference Z-value. –3.5. –3.5 0.0 –0.61. –3.2. –3.1 –0.1 0.09. –3.7. –2.5. –5.3. –14.5. –1.2. 9.2***. –0.73. 2.79. Notes: This table shows the median difference of industry-median-adjusted operating measures between ESM and direct listing firms during pre- and post-listing periods. The pre-ESM period (year –3 to–1) is numbered relative to year of participation in the ESM, while the post-ESM period (years +1 to +3) is numbered relative to the IPO year. Nonparametric Mann-Whitney U-tests are employed to test the equality of median differences. Z-values of Mann-Whitney U-tests are presented under the estimated differences. ***, **, and * denote significance at the 1%, 5%, and 10% levels, respectively.. This analysis is repeated for the GTSM subsample. Panel B of Table 6 lists the difference in long-term operating underperformance between the ESM (Type 2) and direct listing (Type 4) subsets of GTSM-listed firms. During the post-listing period, the difference in long-term operating performance between the ESM and direct listing firms is not significant for most profitability ratios. For example, the median change in the industry-matched ratio of operating income to assets from years +1 to.
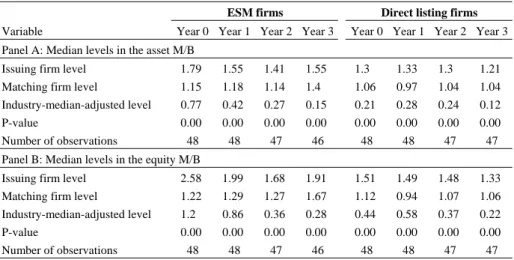
(13) Yi-Shuan Chen and Shin-Herng Michelle Chu. 69. +3 does not differ significantly between Type 2 and Type 4 firms. Therefore, the post-IPO operating performance deterioration for ESM firms does not differ from that for direct listing firms in the GTSM market. The analytical results suggest that regardless of whether issuing firms select the two-stage offering strategy by attending ESM or directly issue new shares, the post-IPO difference in underperformance between ESM and direct listing firms existed for TWSE-listed IPOs (Type 1 and Type 3 firms), but not GTSM-listed IPOs (Type 2 and Type 4 firms). This suggests that for GTSM listed firms, the two-stage offering strategy does not influence the magnitude of post-IPO decline in operating performance. To explain the difference in underperformance between Type 1 and Type 3 firms listed on the TWSE, we describe and test the overly-optimistic-market-expectations and the window-of-opportunity hypotheses. 4.2 Analysis of Operating Underperformance for TWSE-Listed IPOs 4.2.1 Analysis of the Overly-Optimistic-Market-Expectations Hypothesis The market-expectations explanation for long-term underperformance is derived from the heterogeneous expectations model of Miller (1977). Miller argues that investors tend to have divergent opinions on issuers in situations involving significant uncertainty regarding the future cash flow and growth potential of these firms. Jain and Kini (1994) employ market-to-book (M/B) and price-earnings (P/E) ratios as proxy variables for future expectations regarding post-issue earnings. Judging from the decline in M/B and P/E ratios post-listing, they conclude that investors tend to be excessively optimistic regarding firm growth prospects, basing their optimistic forecasts on strong firm performance pre-listing and then becoming disappointed with depressed operating performance post-listing. Mikkelson et al. (1997) found that stock prices fall, reflecting downward revisions in investor expectations, when a firm publishes weak operating performance. These findings imply excessively optimistic expectations regarding IPO activities as a result of ex post operating underperformance. Following earlier studies by Jain and Kini (1994) and Yan and Cai (2003), we use the industry-median-adjusted ratios of asset M/B and equity M/B as proxies for market expectations, then calculate the difference in these proxy variables between IPO firms and their industry counterparts. The asset M/B is defined as the year-end market value of equity plus the book value of debt, divided by the year-end book value of equity plus the book value of debt; the equity M/B is calculated as the year-end market value of equity divided by the year-end book value of equity. Since most sample firms have negative earnings per share during the sample period, the analysis excludes P/E ratios. Panels A and B in Table 7 show annual median levels of asset and equity M/B ratios for issuing firms and industry-median-adjusted levels. Panel C of Table 7 lists the median levels of the paired difference between sample and matched IPO firms for proxies of market expectations. The medians of most proxy variables peak in the.
(14) 70. International Journal of Business and Economics. event year. For ESM firms, most median statistics peak in the listing year and then decline, either before or after industry adjustment. For example, the industry-median-adjusted level of asset M/B peaked at 0.77 in year 0 and then dropped to 0.15 in year +3 for the ESM firms (Type 1); however, the deterioration of asset M/B for the direct listing firms (Type 3) occurs on a smaller scale (from 0.21 to 0.12). This evidence suggests that the market is more optimistic regarding the prosperity for firms that select ESM listing. Table 7. Market Expectations on Earnings Performance for ESM Firms versus Direct Listing Firms Listed on the TWSE after IPO. Variable. ESM firms. Direct listing firms. Year 0 Year 1 Year 2 Year 3. Year 0 Year 1 Year 2 Year 3. Panel A: Median levels in the asset M/B Issuing firm level. 1.79. 1.55. 1.41. 1.55. 1.3. 1.33. 1.3. Matching firm level. 1.15. 1.18. 1.14. 1.4. 1.06. 0.97. 1.04. 1.04. Industry-median-adjusted level. 0.77. 0.42. 0.27. 0.15. 0.21. 0.28. 0.24. 0.12. P-value. 0.00. 0.00. 0.00. 0.00. 0.00. 0.00. 0.00. 0.00. 48. 48. 47. 46. 48. 48. 47. 47 1.33. Number of observations. 1.21. Panel B: Median levels in the equity M/B Issuing firm level. 2.58. 1.99. 1.68. 1.91. 1.51. 1.49. 1.48. Matching firm level. 1.22. 1.29. 1.27. 1.67. 1.12. 0.94. 1.07. 1.06. Industry-median-adjusted level. 1.2. 0.86. 0.36. 0.28. 0.44. 0.58. 0.37. 0.22. P-value. 0.00. 0.00. 0.00. 0.00. 0.00. 0.00. 0.00. 0.00. 48. 48. 47. 46. 48. 48. 47. 47. Number of observations. Panel C: Industry-median-adjusted changes in the asset M/B and the equity M/B ratios during the post-IPO period (years 0 to +3). Variable. ESM firms. Direct listing firms. Years 0 to +3. Years 0 to +3. Z–value Difference. (Diff test). Cumulative median level. Cumulative median level. Asset M/B. –0.66. –0.2. –0.46. (–1.54). Equity M/B. –1.05. –0.3. –0.75. (–1.92)*. Number of observations 46 47 Notes: Panel A to C show annual median level in three measures for TWSE-listed IPO firms: asset market-to-book ratios, equity market-to-book ratios, and industry-median-adjusted paired differences between sample and corresponding firms during the post-issue period (years 0 to +3). It consists of 48 ESM and 48 direct listing firms issued from 1999 to 2004. The nonparametric Mann-Whitney U-test is employed to test equality of median differences. Z-values of Mann-Whitney U-tests are presented below the estimated differences. ***, **, and * denote significance at 1%, 5%, and 10% levels, respectively.. Panel C in Table 7 summarizes the industry-median-adjusted difference in M/B ratios over years 0 to +3. Nonparametric Mann-Whitney U-tests are used to test the equality of the median difference between the ESM firms and direct listing firms. We find that equity M/B ratios decrease more for ESM firms than for direct listing firms during this period. Furthermore, we find the difference between ESM firms (Type 1) and direct listing firms (Type 3) during the four-year event window to be.
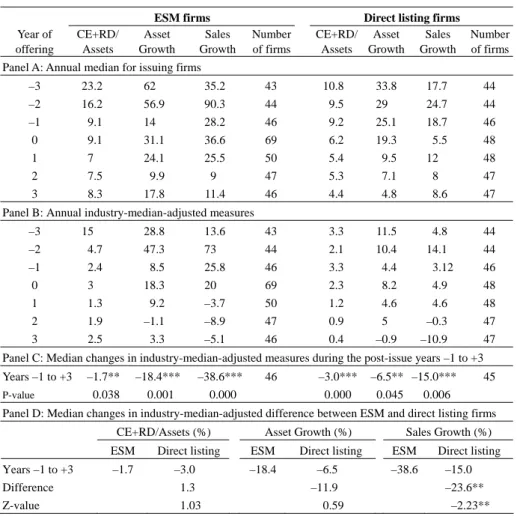
(15) Yi-Shuan Chen and Shin-Herng Michelle Chu. 71. statistically significant. The evidence from the equity M/B ratios supports the overly-optimistic-market-expectations hypothesis. Excessive investor optimism is more extreme for the ESM firms than for the direct listing firms in the event year; however, the difference in asset M/B ratios between the two is insignificant. 4.2.2 Analysis of the Window-of-Opportunity Hypothesis The window-of-opportunity hypothesis contends that managers time IPOs to exploit the temporary prosperity of firms. Loughran and Ritter (1997) and Yan and Cai (2003) used growth rates in sales, assets, and capital expenditures to measure temporary firm overvaluation. Moreover, Chan et al. (2004) examined the long-term performance of IPOs in China, used profitability ratios as proxies for managerial manipulation, and concluded that window dressing can be one explanation for IPO underperformance in China. This investigation uses capital expenditure plus R&D-to-asset ratio, total asset growth ratio, and sales growth ratio as proxies for issuer market timing activities. Panel B of Table 8 shows that industry-median-adjusted growth rates for total assets and net sales reach the highest levels (47.3% and 73%, respectively) pre-listing and then decrease post-listing for ESM firms. Direct listing firms exhibit a similar pattern; however, asset and sales growth peak in the pre-issue year (10.4% and 14.1%, respectively). The changes in industry-median-adjusted ratios over years –1 to +3 in Panel C show that all variables trend downwards following the IPOs for both ESM and direct listing firms. Panel D of Table 8 compares the growth ratios of ESM and direct listing firms. Statistical tests show that the reduction in sales growth is larger and more significant for ESM firms than for direct listing firms but generally is statistically insignificant for the other two growth variables. Restated, rapid sales growth pre-IPO and disappointing sales growth post-IPO suggest that managers of ESM firms tend to take advantage of temporarily favorable operating performance to obtain capital more cheaply than direct listing firms. 4.3 Regression Analysis Since this study is concerned with identifying the explanatory factors for operating underperformance, we fit multiple regressions to look for factors that may explain post-issue deterioration in operating performance. 4.3.1 Response Variable Following Yang and Cai (2003), the response variable in this study, relative operating performance pre- and post-IPO listing, is measured by change in operating income to total assets ratio (EBITDA/Assets) between years +1 and +3. To explain proper assessment of firm productivity, we also perform industry adjustment of the response variable, namely the difference between the EBITDA/Assets ratio of the issuing firm and that of the industry-matched benchmark. Prior studies related IPO long-term underperformance to information asymmetry theory, particularly the.
(16) 72. International Journal of Business and Economics. overly-optimistic-market-expectations and window-of-opportunity hypotheses. The following section discusses the predictor variables chosen for the regression analysis. Table 8. Annual Medians of Four Profitability Ratios for TWSE-Listed Firms. Year of offering. CE+RD/ Assets. ESM firms Asset Sales Growth Growth. Number of firms. Direct listing firms CE+RD/ Asset Sales Number Assets Growth Growth of firms. Panel A: Annual median for issuing firms –3. 23.2. 62. 35.2. 43. 10.8. 33.8. 17.7. 44. –2. 16.2. 56.9. 90.3. 44. 9.5. 29. 24.7. 44. –1. 9.1. 14. 28.2. 46. 9.2. 25.1. 18.7. 46. 0. 9.1. 31.1. 36.6. 69. 6.2. 19.3. 5.5. 48. 1. 7. 24.1. 25.5. 50. 5.4. 9.5. 12. 48. 2. 7.5. 9.9. 9. 47. 5.3. 7.1. 8. 47. 3. 8.3. 17.8. 11.4. 46. 4.4. 4.8. 8.6. 47. Panel B: Annual industry-median-adjusted measures –3. 15. 28.8. 13.6. 43. 3.3. 11.5. 4.8. 44. 47.3. 73. 44. 2.1. 10.4. 14.1. 44. 25.8. 46. 3.3. 4.4. 3.12. 46. 20. 69. 2.3. 8.2. 4.9. 48. 9.2. –3.7. 50. 1.2. 4.6. 4.6. 48. 1.9. –1.1. –8.9. 47. 0.9. 5. –0.3. 47. 2.5. 3.3. –5.1. 46. 0.4. –0.9. –10.9. 47. –2. 4.7. –1. 2.4. 0. 3. 1. 1.3. 2 3. 8.5 18.3. Panel C: Median changes in industry-median-adjusted measures during the post-issue years –1 to +3 Years –1 to +3 P-value. –1.7**. –18.4***. –38.6***. 0.038. 0.001. 0.000. 46. –3.0*** 0.000. –6.5** –15.0*** 0.045. 45. 0.006. Panel D: Median changes in industry-median-adjusted difference between ESM and direct listing firms CE+RD/Assets (%) ESM Years –1 to +3 Difference. –1.7. Direct listing –3.0 1.3. Asset Growth (%). Sales Growth (%). ESM. Direct listing. ESM. –18.4. –6.5. –38.6. –11.9. Direct listing –15.0 –23.6**. Z-value 1.03 0.59 –2.23** Notes: This table shows seven-year median ratios of capital expenditure plus R&D to total assets, total assets growth, and net sales growth around IPO events for ESM firms and direct listing firms. Panel A reports the medians of those variables for issuing firms. Matching firms are chosen from those that were earlier listed on the TWSE with the same industrial classification codes at the end of year –1. Panel B shows yearly industry-median-adjusted median changes in operating ratios that are defined as the median difference between IPO firms and industry-matching firms. Panel C displays median changes in industry-median-adjusted operating performance variables over the years –1 to +3. Paired nonparametric Wilcoxon tests are employed to test the equality of the medians, with p-values presented below corresponding adjusted medians. Panel D reports median changes in industry-median-adjusted differences between 48 ESM and 48 direct listing firms during post-IPO (years –1 to +3). The nonparametric Mann-Whitney U-test was employed to test equality of median differences. Z-values of Mann-Whitney U-tests are presented below the estimated differences. ***, **, and * denote significance at the 1%, 5%, and 10% levels, respectively..
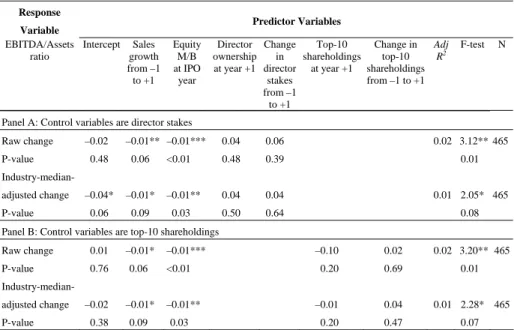
(17) Yi-Shuan Chen and Shin-Herng Michelle Chu. 73. 4.3.2 Predictor Variables Manager market timing activities under the window-of-opportunity hypothesis are proxied by variables such as capital expenditure plus R&D-to-assets ratios, total asset growth ratios, and sales growth ratios. We use the changes in sales growth from years –1 to +1 to examine the influence of sales growth on operating deterioration. Furthermore, yearly average equity M/B ratios in the issuance year are considered proxies for the overly-optimistic-market-expectations of investors. Mikkelson et al. (1997) and Kutsuna et al. (2002) demonstrate that operating underperformance is highly sensitive to managerial ownership. Based on the agency theory proposed by Jensen and Meckling (1976), firms with higher director ownership outperform those with lower inside ownership, whereas underperformance of firms with decreased managerial stakes may be offset by increased monitoring for the firms if institutional ownership or top-10 shareholdings increase. Therefore, we establish two variables, corporate directors and top-10 shareholders, to control for the influence of managerial ownership on the long-term operating underperformance of IPO firms. For these two control variables, we measure both the level effect and change effect; the level effect denotes post-issue inside stakes at year +1 and the change effect denotes changes in inside stakes between years –1 and +1. Table 9 lists the regression results. Panels A and B in Table 9 display a significant and negative relationship between operating performance and the sales growth rate. For example, the coefficient of the sales growth from year –1 to +1 variable is –0.01, which indicates that a 1% increase in the sales growth will cause a 0.01% decrease in operating performance measure post-listing. Consistent with Yan and Cai (2003), these results support the window-of-opportunity hypothesis and suggest that managerial market timing can be one explanation for the observed deterioration in operating performance post-IPO. From column 4 of Table 9, coefficients of the equity M/B ratio variable in all regressions are negative and statistically significant, supporting the overly-optimistic-market-expectations hypothesis. This is consistent with the empirical findings summarized in Tables 7 and 8, which show that for TWSE firms market expectations regarding earning performance (measured by sales growth rate and M/B ratio) are higher for ESM firms than for direct listing firms. These results suggest that the operating underperformance of ESM firms can be driven by excessive market optimism and managerial timing. The overall regression analysis shows that the proxy variables for the window-of-opportunity and the overly-optimistic-market-expectations hypotheses significantly explain operating deterioration; however, the managerial ownership control variables are not statistically significant..
(18) 74. International Journal of Business and Economics Table 9. Regressions Analyses of Long-Run IPO Operating Underperformance Response. Variable EBITDA/Assets Intercept Sales ratio growth from –1 to +1. Predictor Variables Equity M/B at IPO year. Adj Change in Top-10 Director Change R2 top-10 shareholdings in ownership at year +1 director at year +1 shareholdings from –1 to +1 stakes from –1 to +1. F-test. N. Panel A: Control variables are director stakes Raw change. –0.02. P-value. –0.01** –0.01***. 0.04. 0.06. 0.02 3.12** 465. <0.01. 0.48. 0.39. 0.01. –0.01*. –0.01**. 0.04. 0.04. 0.01 2.05* 465. 0.09. 0.03. 0.50. 0.64. 0.08. 0.48. 0.06. –0.04* 0.06. Industry-medianadjusted change P-value. Panel B: Control variables are top-10 shareholdings Raw change. 0.01. –0.01*. P-value. 0.76. 0.06. –0.02. –0.01*. 0.38. 0.09. –0.01*** <0.01. –0.10. 0.02. 0.02 3.20** 465. 0.20. 0.69. 0.01. –0.01. 0.04. 0.01 2.28* 465. 0.20. 0.47. 0.07. Industry-medianadjusted change P-value. –0.01** 0.03. Notes: This table presents the ordinary least squares regression results. The response variable operating income over total assets (EBITDA/Assets) is measured in two ways: raw change over the years +1 to +3 and industry-median-adjusted change over the years +1 to +3. The predictor variables include: sales growth from years –1 to +1, equity M/B at IPO year, directors and top-10 owners stakes in year +1, change in inside stakes from years –1 to +1. P-values are presented below estimated raw changes. ***, **, and * denote significance at the 1%, 5%, and 10% levels, respectively.. 5. Conclusion We investigate short-term underpricing and long-term operating performance of IPO firms in Taiwan. Taiwan implemented a unique market reform, introducing a two-stage offering strategy. New issuers can choose to list directly or to list on the ESM during the first stage, and to sell new shares to the public during the second stage. The information asymmetry theory predicts that IPO firms that select the two-stage offering strategy should have smaller IPO underpricing and a worse long-term operating underperformance than comparable IPO firms. With the two exchange markets in Taiwan having different listing requirements, we analyze the types of firms listing on the two markets. First, we find that initial returns are approximately 50% lower for two-stage firms (ESM firms) than for direct listing IPOs in the TWSE. Since initial returns are considered the indirect cost of issuing equity, the test results support the assertion that the two-stage offering procedure reduces issuing costs; however, this result only applies to one of the two listing markets. Second, we find that both ESM firms and direct listing firms exhibit long-term post-IPO deterioration in operating performance. An interesting finding is that in.
(19) Yi-Shuan Chen and Shin-Herng Michelle Chu. 75. TWSE, but not in GTSM, the post-issue operating performance deteriorated more for ESM firms than direct listing firms. Two hypotheses were proposed to explain this phenomenon: the overly-optimistic-market-expectations hypothesis and the window-of-opportunity hypothesis. The analytical results support both the overly-optimistic-market-expectations hypothesis and the window-of-opportunity hypothesis as explanations for long-term underperformance of ESM firms relative to direct listing firms. This implies that firms with more volatile operating performance may choose the two-stage offering strategy by attending ESM before going public. We provide evidence supporting the January 2005 ESM policy amendment that made ESM listing mandatory for all new issues. References Benveniste, L. and P. Spindt, (1989), “How Investment Bankers Determine the Offer Price and Allocation of New Issues,” Journal of Financial Economics, 24, 343-362. Chan, K., J. Wang, and K. C. J. Wei, (2004), “Underpricing and Long-Term Performance of IPOs in China,” Journal of Corporate Finance, 10, 409-430. Chen, G., M. Firth, and J. B. Kim, (2000), “The Post-Issue Market Performance of Initial Public Offerings in China’s New Stock Markets,” Review of Quantitative Finance and Accounting, 14, 319-339. Derrien, F. and A. Kecskes, (2007), “The Initial Public Offerings of Listed Firms,” Journal of Finance, 62, 447-479. Jain, B. A. and O. Kini, (1994), “The Post-Issue Operating Performance of IPO Firms,” Journal of Finance, 49, 1699-1726. Jensen, M. and W. Meckling, (1976), “Theory of the Firm: Managerial Behavior, Agency Costs and Ownership Structure,” Journal of Financial Economics, 3, 305-360. Kutsuna, K., H. Okamura, and M. Cowling, (2002), “Ownership Structure Pre- and Post-IPOs and the Operating Performance of JASDAQ Companies,” Pacific-Basin Financial Journal, 10, 163-181. Loughran, T. and J. Ritter, (1995), “The New Issues Puzzle,” Journal of Finance, 50, 23-51. Loughran, T. and J. Ritter, (1997), “The Operating Performance of Firms Conducting Seasoned Equity Offerings,” Journal of Finance, 52, 1823-1850. Loughran, T., J. Ritter, and K. Rydqvist, (1994), “Initial Public Offerings: International Insights,” Pacific-Basin Finance Journal, 2, 165-199. Mikkelson, W. H., M. M. Partch, and K. Shah, (1997), “Ownership and Operating Performance of Companies That Go Public,” Journal of Financial Economics, 44, 281-307. Miller, E. M., (1977), “Risk, Uncertainty, and Divergence of Opinion,” Journal of Finance, 32, 1151-1168. Nohel, T. and V. Tarhan, (1998), “Share Repurchases and Firm Performance: New.
(20) 76. International Journal of Business and Economics. Evidence on the Agency Costs of Free Cash Flow,” Journal of Financial Economics, 49, 187-222. Ritter, J., (1991), “The Long-Run Performance of Initial Public Offerings,” Journal of Finance, 46, 3-27. Rock, K., (1986), “Why New Issues Are Underpriced,” Journal of Financial Economics, 15, 187-212. Yan, D. and J. Cai, (2003), “Long-Run Operating Performance of Initial Public Offerings in Japanese Over-the-Counter Market (1991–2001): Evidence and Implications,” Asia-Pacific Financial Markets, 10, 239-274..
(21)
數據
+6
相關文件
This paper aims to study three questions (1) whether there is interaction between stock selection and timing, (2) to explore the performance of "timing and stock
The objective is to evaluate the impact of personalities balance in a project management team on the team’s performance.. To verify the effectiveness of this model, two
Therefore, the purpose of this study is to investigate the hospitality students’ entrepreneurial intentions based on theory of planned behavior and also determine the moderating
Therefore, the purpose of this study is to perform a numerical analysis on the thermal effect of shape-stabilized PCM plates as inner linings on the indoor air temperature
C., 2004b, The Market Microstructure and Relative Performance of Taiwan Stock Index Futures a Comparison of the Singapore Exchange and The Taiwan Futures Exchange, Journal of
The purpose of this study is to analyze the status of the emerging fraudulent crime and to conduct a survey research through empirical questionnaires, based on
Through the investigation of the coating deterioration of existing buildings, this study has organized a variety of the deterioration phenomena and the degree of
Baruch said: "a fluctuation in the stock market fluctuations is not the real significance of this matter, because people want to see the future; but also it
