行政院國家科學委員會專題研究計畫 期中進度報告
中心顆粒體之蛋白質交互作用網路--(子計畫一)以比較基
因體學探討中心顆粒體之蛋白質交互作用網絡(2/3)
期中進度報告(精簡版)
計 畫 類 別 : 整合型 計 畫 編 號 : NSC 96-2627-B-002-005- 執 行 期 間 : 96 年 08 月 01 日至 97 年 07 月 31 日 執 行 單 位 : 國立臺灣大學資訊工程學系暨研究所 計 畫 主 持 人 : 高成炎 處 理 方 式 : 本計畫可公開查詢中 華 民 國 97 年 05 月 30 日
行政院國家科學委員會補助專題研究計畫
□ 成 果 報 告
■期中進度報告
中心顆粒體之蛋白質交互作用網路--(子計畫一)以比較基因
體學探討中心顆粒體之蛋白質交互作用網絡(2/3)
計畫類別:□ 個別型計畫 ■ 整合型計畫
計畫編號:NSC 96-2627-B-002-005-
執行期間:96 年 8 月 1 日至 97 年 7 月 31 日
計畫主持人:高成炎
共同主持人:
計畫參與人員:詹鎮熊
成果報告類型(依經費核定清單規定繳交):■精簡報告 □完整報告
本成果報告包括以下應繳交之附件:
□赴國外出差或研習心得報告一份
□赴大陸地區出差或研習心得報告一份
□出席國際學術會議心得報告及發表之論文各一份
□國際合作研究計畫國外研究報告書一份
處理方式:除產學合作研究計畫、提升產業技術及人才培育研究計畫、
列管計畫及下列情形者外,得立即公開查詢
□涉及專利或其他智慧財產權,□一年□二年後可公開查詢
執行單位:國立台灣大學資訊工程系
中 華 民 國 97 年 5 月 31 日
I
摘要
本計畫本年度重點工作為 POINeT 網站及生物網路檢視器,透過瀏覽器技術,使用者查詢 蛋白質交互作用資料後,能夠立即在瀏覽器上檢視交互作用網路,並進行分析。該檢視器 不僅能檢視網路,也能夠針對網路拓樸進行分析,提供多種蛋白質中心性質及排比方式。 使用者也能夠下載查詢到的生物網路,並利用外部程式進行後續的研究。應用 POINeT 網 站,可以找尋出疾病生物標記之間的潛在關係。 另外,我們也發展一個描述動態網路變化的方法,可以量化時間序列基因表現資料與蛋白 質交互作用網路結合後,網路節點與交互作用改變對於網路/子網路的影響。 最後,我們發現某些病毒與中心顆粒體成員之間有交互作用存在。我們整理一份人類-病 毒交互作用資料,這些資料顯示,病毒-中心顆粒體-癌症之間,有非常密切的關係存在, 對於後來的癌症致病機制研究,可能會帶來新的方向。 關鍵詞:蛋白質交互作用、生物網路檢視器、中心顆粒體、量化網路變化、病毒、癌症Abstract
This year we have focused on POINeT website and a network viewer. Using browser technology, users may examine the interaction network in the browser right after they queried protein-protein interactions. This viewer not only enables the visualization of the network, but is also capable to perform network topology analysis. Several protein centralities and ranking scores are provided to evaluating the importance of the nodes in networks. The networks can also be downloaded and analyzed using external programs. With POINeT website, it is possible to infer potential links among disease markers. Two examples are provided, and potential novel markers are revealed. We also developed a method to describe dynamic network perturbations. This method is able to quantify the dynamic changes of nodes/interactions in an integrated time-series microarray/protein-protein interaction network.
Finally, we have found that some virus proteins interact with midbody proteins. We have collected a set of human-virus protein-protein interactions. These data suggests there exists a close relationship among virus-midbody-cancer. This may shed new lights to the study of cancer developments.
Keywords: Protein-protein interaction, biological network viewer, midbody, quantified network
POINeT: Protein Interactome with Tissue Specific Expression and Sub-network
Analysis
Sheng-An Lee, Cheng-hsiung Chan, Chia-Ying Yang, Kuo-chuan Huang, Cheng-Yan Kao, Kun-Mao Chao, Jin-Mei
Lai, Feng-Sheng Wang, and Chi-Ying F. Huang (submitted)
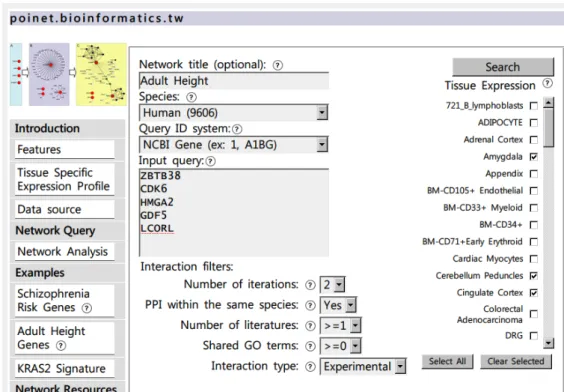
The POINeT web service contains a straight-forward user inter-face (Figure 1). Users may input queries composed of official gene symbols and/or gene ids into the text field; UniProt ids can be used as well. Aliases and other designators of genes can also be used. Several examples are provided, including schizophrenia risk genes, adult height, and the KRAS2 signature. PPI datasets for seven species are available for query, including human (H. sapiens), mouse (M. musculus), fruit fly (D. melanogaster), worm (C. elegans), yeast (S. cerevisiae), A. thaliana and malaria parasite (P. falciparum) datasets. Tissue specific expression profiles from the Genomic Institute of the Novartis Research Foundation (Su, et al., 2004)are available for humans and mice, making expression in selected tissues available as attributes for the nodes in the network. PPIs can be filtered based on the number of publications reporting these PPIs, the number of shared GO terms and whether the PPIs in a network have been verified experimentally, derived through orthologs or both.
Figure 1. The interface of POINeT network analysis and visualization tool.
POINeT will convert the input official gene symbols and ids automatically. Descriptions of the genes are provided as the next step and enable the user to verify their inputs. Next, the network formed by the queries and their neighbors is retrieved and the statistics of the network provided to
the user. Finally, the resulting network along with various attributes can be downloaded in different for-mats. There is also an online network viewer for visualization of the resulted network. The proteins and interactions within a net-work can also be browsed; furthermore, external links to NCBI Gene and PubMed databases are also provided. If tissue specific expression has been selected for the human or mouse interactions, these become node attributes and are included in the downloadable zip archive.
POINeT will also perform network analysis on the resulting networks. For each isolated sub-network, basic statistics on the numbers of interactors, the interactions, the queries, the interactions with shared GO terms, the interactions with interologs and the interactions within queries (QQ-PPI) are given. The lengths of the shortest path, average distances, clustering coefficients and indices of aggregation are also calculated based on the approach described in (Platzer, et al., 2007). We believe these and other topological measurements along with the biological attributes will facilitate the visualization and analysis of the underlying network.
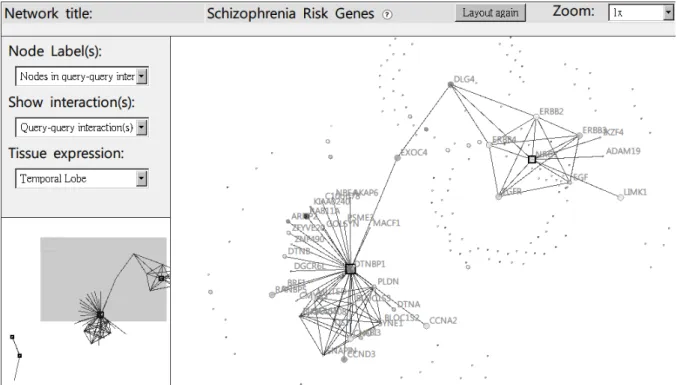
Figure 2. Network viewer of POINeT.
The network viewer implemented in POINeT is able to visualize various types of interactions, zoom in the network, and overlay user-selected tissue expression profiles on the nodes (using different levels of grey). The viewer is implemented with platform independent JavaScript, Cascade Style Sheet (CSS) and AJAX technology. Users do not need to install any extra packages in their computers, such as Java virtual machine or flash player. Using the concept of layers, information related to the network can be visualized dynamically and efficiently. In this way, the
viewer can be easily extended to display any new information selected by the user. For example, the centrality values could become node attributes in the future. User may select nodes in the viewer. Links to NCBI gene database and PubMed links for associated interactions will be provided. Gene Ontology annotations for each node are also available. Currently, POINeT does not support editing of nodes/edges. However, networks and their associated node attributes can be imported into external network visualization programs, such as Cytoscape (Shannon, et al., 2003).
Quantitative assessment of the dynamic modularity in a protein interaction
sub-network based on the perturbation of edges
Chen-hsiung Chan, Cheng-Yan Kao, I-Ming Chu and Kuan-Yeu Pan (submitted)
Evaluation of State Change
State changes obtained from microarray data are the changes in expression levels. Using a baseline time point and the original cell state, the rest of the microarray states can be compared with this reference state. We use the stage 0 (day 3) data for the temporal microarray sets, as well as the primary cell microarray data for the different cultivated conditions, as the reference sets. We define the states of nodes as follows:
ٛ ٛ ٛ ٛ ٛ − = regulated down is gene if , 1 unchanged is gene if , 0 regulated up is gene if , 1 i i i si
where si is the state of node i. A gene (node) is considered as up regulated if its expression level is 2 times higher than baseline. If the expression level is under 1/2 of the baseline, the gene is considered as down regulated. A gene is considered as unchanged if the above two conditions were not met.
Perturbation Coefficient
Here, we define the perturbation coefficient (PC) as follows:
components total compoments perturbed PC _ _ =
Accordingly, the PC of nodes in a network is
N s PC N i i node
ٛ
= ,where N is the number of nodes of a network.
follows: ٛ ٛ ٛ = network in the gene to connected not is gene if , 0 network in the gene to connected is gene if , 1 j i j i Cij
Thus, the PC of edges in a network is
L c s s c c s s PC ij N j i j i N j i ij ij N j i j i edge 2 , , , ٛ + = ٛ + =
ٛ
ٛ
ٛ
,where L is the number of links (edges) of a network.
The PC of edges would not be zero when the states of genes with edges are changed. According to this definition, mutually interacting nodes changing their states together within a
protein-protein interaction network lead to higher PC value. With the definitions of PCnode and
PCedge, the networks can be seen as a collection of nodes and edges in different states. The
distributions of these states can be used to estimate the changes between different time points or conditions.
The ratio of PCedge to PCnode is calculated as follows:
> < > < = ٛ ٛ ٛ ٛ ٛ ٛ ٛ ٛ ٛ ٛ ٛ ٛ ٛ ٛ ٛ ٛ ٛ ٛ ٛ ٛ ٛ ٛ + = ٛ ٛ ٛ ٛ ٛ ٛ ٛ ٛ ٛ ٛ ٛ ٛ ٛ ٛ ٛ ٛ ٛ ٛ ٛ ٛ ٛ ٛ ٛ ٛ ٛ ٛ ٛ ٛ + =
ٛ
ٛ
ٛ
ٛ
k k N L s c s s N s L c s s PC PC p N i i ij N j i j i N i i ij N j i j i node edge 2 2 , , N L k>= 2 <where <k> is the average degree of the network's links (2L/N) and N is the total number of it's nodes. <kp> can be defined as the average perturbation degree of the network. <k> is a constant
for the same protein interaction subnetworks, therefore the ratio of PCedge to PCnode could be used
to describe (might be used to represent) the perturbation property of a network.
Figure 3. The network perturbations (top) can be quantified with perturbation coefficients (bottom).
We have applied the concept of perturbation coefficient (PC) to chondrocyte differentiation process (James, et al., 2005). The changes in networks can be quantified with PC (Figure 3), and cluster of genes (and their interactions) instead of isolated genes can be identified.
Human-Virus Interaction Database
In previous year, we have identified several virus proteins involved in midbody interactome, including tat of HIV, F and H of measles virus (Bolt, 2001), etc. Based on our ranking criteria, there virus proteins are significant to the midbody interactome but filtered out due to their non-human origins. Recently, other study has found parallels between cytokinesis (notably midbody) and retrovirus budding (Carlton and Martin-Serrano, 2007). The connections between viruses and human cancers have also been observed in numerous cases (Abdel-Aziz, et al., 2007; Benharroch, et al., 2004; Cheng, et al., 2007; Feng, et al., 2008; Hajdu and Ali, 2008; Mok, et al., 2008).
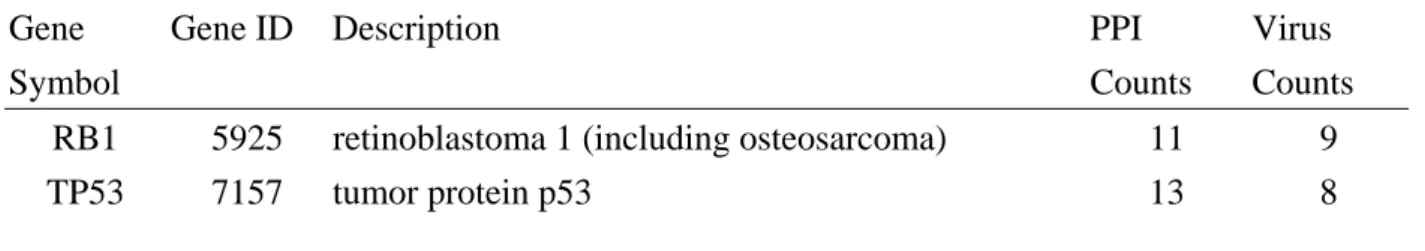
Based on data from POINT and POINeT, we have collected 2,725 human-virus interactions. Preliminary analysis has been performed on this database. One hundred and eleven (111) proteins from 52 viruses interact with 1,577 human proteins. Human proteins are ranked with number of virus protein partners (Table 1). It is interesting to note that RB1 and TP53 are ranked first and second, respectively. Most of the top 20 genes are involved in transcription regulation, cell proliferation and cell cycle; and some are directly involved in cancers, including RB1 and TP53.
Table 1. Human proteins ranked with number of virus partners.
Gene Symbol
Gene ID Description PPI Counts
Virus Counts RB1 5925 retinoblastoma 1 (including osteosarcoma) 11 9 TP53 7157 tumor protein p53 13 8
6
EP300 2033 E1A binding protein p300 13 8 DLG1 1739 discs, large homolog 1 (Drosophila) 6 6 TBP 6908 TATA box binding protein 9 6 SP1 6667 Sp1 transcription factor 9 5 PCAF 8850 p300/CBP-associated factor 8 5 CDK2 1017 cyclin-dependent kinase 2 5 5 GTF2B 2959 general transcription factor IIB 7 5 SUMO1 7341 SMT3 suppressor of mif two 3 homolog 1 (S.
cerevisiae)
5 5
CREBBP 1387 CREB binding protein (Rubinstein-Taybi syndrome)
7 5
GPS2 2874 G protein pathway suppressor 2 5 5 MAGI1 9223 membrane associated guanylate kinase, WW and
PDZ domain containing 1
4 4
UBE2I 7329 ubiquitin-conjugating enzyme E2I (UBC9 homolog, yeast)
4 4
CEBPB 1051 CCAAT/enhancer binding protein (C/EBP), beta 5 4 E2F1 1869 E2F transcription factor 1 5 4 CDC2 983 cell division cycle 2, G1 to S and G2 to M 7 4 RAN 5901 RAN, member RAS oncogene family 5 4 TAF1 6872 TAF1 RNA polymerase II, TATA box binding
protein (TBP)-associated factor, 250kDa
4 4
BAK1 578 BCL2-antagonist/killer 1 4 4
Human-virus interaction (HVI) database is preliminary and not yet opened to the public. There are some biases in this database. For example, HIV alone interacts with thousands of human proteins. Nonetheless, the virus/midbody/cancer triads as revealed in this database may shed new insights to the mechanisms of proliferation, transcription regulation and tumorigenesis.
References
Abdel-Aziz, H.O., Murai, Y., Hong, M., Kutsuna, T., Takahashi, H., Nomoto, K., Murata, S., Tsuneyama, K. and Takano, Y. (2007) Detection of the JC virus genome in lung cancers: possible role of the T-antigen in lung oncogenesis, Appl Immunohistochem Mol Morphol, 15, 394-400. Benharroch, D., Shemer-Avni, Y., Myint, Y.Y., Levy, A., Mejirovsky, E., Suprun, I., Shendler, Y., Prinsloo, I., Ariad, S., Rager-Zisman, B., Sacks, M. and Gopas, J. (2004) Measles virus: evidence of an association with Hodgkin's disease, Br J Cancer, 91, 572-579.
Bolt, G. (2001) The measles virus (MV) glycoproteins interact with cellular chaperones in the endoplasmic reticulum and MV infection upregulates chaperone expression, Arch Virol, 146, 2055-2068.
Carlton, J.G. and Martin-Serrano, J. (2007) Parallels between cytokinesis and retroviral budding: a role for the ESCRT machinery, Science, 316, 1908-1912.
Cheng, Y.W., Wu, M.F., Wang, J., Yeh, K.T., Goan, Y.G., Chiou, H.L., Chen, C.Y. and Lee, H. (2007) Human papillomavirus 16/18 E6 oncoprotein is expressed in lung cancer and related with p53 inactivation, Cancer Res, 67, 10686-10693.
Feng, H., Shuda, M., Chang, Y. and Moore, P.S. (2008) Clonal integration of a polyomavirus in human Merkel cell carcinoma, Science, 319, 1096-1100.
Hajdu, S.I. and Ali, S.Z. (2008) Discovery of human papillomavirus in carcinoma of the lung, Ann Clin Lab Sci, 38, 3-5.
James, C.G., Appleton, C.T., Ulici, V., Underhill, T.M. and Beier, F. (2005) Microarray analyses of gene expression during chondrocyte differentiation identifies novel regulators of hypertrophy, Mol Biol Cell, 16, 5316-5333.
Mok, M.T., Lawson, J.S., Iacopetta, B.J. and Whitaker, N.J. (2008) Mouse mammary tumor virus-like env sequences in human breast cancer, Int J Cancer, 122, 2864-2870.
Shannon, P., Markiel, A., Ozier, O., Baliga, N.S., Wang, J.T., Ramage, D., Amin, N., Schwikowski, B. and Ideker, T. (2003) Cytoscape: a software environment for integrated models of biomolecular interaction networks, Genome Res, 13, 2498-2504.
Su, A.I., Wiltshire, T., Batalov, S., Lapp, H., Ching, K.A., Block, D., Zhang, J., Soden, R., Hayakawa, M., Kreiman, G., Cooke, M.P., Walker, J.R. and Hogenesch, J.B. (2004) A gene atlas of the mouse and human protein-encoding transcriptomes, Proc Natl Acad Sci U S A, 101, 6062-6067.