國際B2B市場工業性品牌權益的決定因素─以台灣扣件產業為例
68
0
0
全文
(2) 致謝 光陰匆匆,兩年的研究所生涯即將畫下完美句點!研究論文得以付梓,首先感謝指 導教授陳一民博士的細心指導,並且給予我極大的思考空間與彈性,不斷的腦力激盪和 答辯,使我獲益良多。感謝口試委員郭英峰教授與劉信賢教授的寶貴建議,使得本研究 更臻完善。感謝如爺爺般溫暖的李博志教授,這兩年對我的提攜與照顧。感謝林杏子教 授總在我為研究方法迷航時,幫我點燃一盞明燈。感謝可愛的郁茹姐,到系辦串門子是 一件很開心的事情。除此之外,感謝個案公司副總與業務部同仁提供寶貴的資訊與幫 助,使得本研究更為順利。 很慶幸我的學生生涯結束在高大亞太這座瑰麗樂園中,感謝宏佳、阿倫、妮妮、雋 心、潮威和小余的搞笑相伴和貼心傾聽;感謝安琪、大哥、大頭、鯰魚、宜璋、阿偉和 阿政的照顧與陪伴。這兩年屬於我們 14 個人的故事,不論喜論哀樂,都將是我最彌足 珍貴的回憶。嶄新的未來,祝福各位都有美好的發展!感謝小新、小 Q、小逸、詩蓉、 宜欣、惠鳳和小趴的幫忙與激勵,祝福可愛又貼心的你們,未來都能順心又如意。感謝 頻頻詢問我論文進度的死忠朋友們,陪伴我走過忙碌又焦慮的研究生涯,人生的旅途一 直有你們的陪伴,是老天爺給我最大的恩賜。 最後,感謝始終給我最大支持的家人、未來二姊夫和蘇仙貝,要不是你們的犧牲與 奉獻,我沒有辦法這麼安逸地當個學生,今天這份小小的榮耀都將歸屬於你們。面對未 來全新的生活與挑戰,我會更用心的經營,一定不讓你們失望。我相信苦日子會過去, 而光明燦爛的未來正等著我們這充滿歡笑的一家子。此時此刻,南台灣正逢「八八惡水」 浩劫,希望這個噩夢能趕緊結束,重建家園的路還很漫長,天佑台灣! 蘇亦凡 謹誌于 高雄大學亞太工商管理學系研究室 民國九十八年八月 I.
(3) 國際 B2B 市場工業性品牌權益的決定因素 ─以台灣扣件產業為例 指導教授:陳一民 博士 國立高雄大學亞太工商管理學系 學生:蘇亦凡 國立高雄大學亞太工商管理學系. 摘要. 對於國際行銷和國際企業而言,了解建立品牌權益的決定因素一直是產業界與學術 界探討的關鍵議題之一。整體而言,許多專注於品牌權益的研究,已經歸納出四個主要 的決定因素:(1)品牌知名度;(2)品牌忠誠;(3)知覺品質;和(4)來源國效應。然而過去 的研究大都以大眾消費者市場為基礎;此外,品牌忠誠度通常被視為建立品牌權益的來 源之一,但本研究依循近期學者的觀點,將品牌忠誠度視為建立工業性品牌權益後的期 望結果。隨著品牌權益的角色愈來愈重要,如何為身處 B2B 市場中的台灣扣件產業建 立品牌權益,成為國際行銷和品牌管理的重要研究議題。本研究延續先前學者對於品牌 權益的研究結果,針對台灣扣件產業提出了工業性品牌權益的的概念性架構,並且研究 在國際 B2B 市場中,如何成功打造工業性品牌權益的關鍵因素。本研究主要透過傳真、 電子郵件與網路問卷的方式獲取研究所需的問卷數據,並且利用結構方程式進行研究分 析。研究發現知覺產品品質和品牌知名度皆與工業性品牌權益呈顯著正相關;同時也發 現,知覺服務品質和來源國效應皆未與工業性品牌權益呈顯著相關。本研究呈現顯著相 關的假說與先前學者的研究結果相互呼應,為工業性產品的品牌經理提供有價值的管理 意涵。 關鍵字:工業性品牌權益、國際 B2B 市場、扣件產業、台灣 II.
(4) Determinants of industrial brand equity in international B2B markets: the case of fastener industry in Taiwan Advisor: Dr. Yi-Min Chen Department of Asia-Pacific Industrial and Business Management National University of Kaohsiung Student: Yi-Fan Su Department of Asia-Pacific Industrial and Business Management National University of Kaohsiung. ABSTRACT. Understanding the determinants of brand equity is a key theoretical and empirical issue in the fields of international marketing and international business. Viewed collectively, research focused on explaining brand equity has emphasized determinants at four primary levels of analysis: (1) brand awareness; (2) brand loyalty; (3) perceived quality; and (4) country-of-origin. However, most of previous studies have been made on customer-based brand equity. In addition, although brand loyalty is often recognized as a source of brand equity, this study following recent research views brand loyalty as a desired outcome of industrial buyer-based brand equity. Acknowledging the increasing important role of brands, how to brand Taiwanese fastener products in international B2B markets is a salient issue in international marketing and brand management research. This study following the research on brand equity proposes a conceptual framework for Taiwanese fastener industry and III.
(5) investigates the sources of industrial brand equity in international B2B markets. Drawing on the results of a survey through fax, e-mail, and online questionnaire, a structural equation modeling (SEM) using partial least squares (PLS) is fitted to a new data set, and findings confirmed the existence of significant relationships between perceived product quality and industrial brand equity, between brand awareness and industrial brand equity, but not between perceived service quality and industrial brand equity, between country-of-origin effects and industrial brand equity in the case of Taiwanese fastener industry. The analysis reconciles some results with those of previous studies. Implications of these findings for brand managers are offered. KEY WORDS: Industrial brand equity; international B2B markets; fastener industry; Taiwan. IV.
(6) Table of Contents. 致謝............................................................................................................................................ I 摘要...........................................................................................................................................II ABSTRACT........................................................................................................................... III Table of Contents ....................................................................................................................V List of Tables ........................................................................................................................VII List of Figures..................................................................................................................... VIII Chapter One: Introduction .....................................................................................................1 1.1 Research background .................................................................................................................... 1 1.2 Research motivation and purposes................................................................................................ 3 1.3 Research process ........................................................................................................................... 5. Chapter Two: Literature review and hypothesis development ...........................................8 2.1 Perceived quality........................................................................................................................... 9 2.2 Brand awareness ......................................................................................................................... 12 2.3 Country-of-origin........................................................................................................................ 14 2.4 Brand loyalty............................................................................................................................... 16. Chapter Three: Research method ........................................................................................19 3.1 Research framework ................................................................................................................... 19 3.2 Survey procedures and sample.................................................................................................... 19 3.3 Measures and measure validation ............................................................................................... 21 3.4 Methodology ............................................................................................................................... 28. Chapter Four: Empirical Results .........................................................................................30 4.1 Demographics ............................................................................................................................. 30 V.
(7) 4.2 Measurement model.................................................................................................................... 31 4.3 Structural model.......................................................................................................................... 34 4.4 Discussion ................................................................................................................................... 36. Chapter Five: Conclusion and implication..........................................................................40 5.1 Conclusion .................................................................................................................................. 40 5.2 Implications................................................................................................................................. 40 5.3 Limitations and research opportunities ....................................................................................... 43. Reference ................................................................................................................................44 Appendix.................................................................................................................................56. VI.
(8) List of Tables Table 1 The fastener exportation amount of Taiwan and China form 1996 to 2008 .................6 Table 2 The measurement of perceived quality .......................................................................23 Table 3 The measurement od brand awareness, brand equity, and brand loyalty....................25 Table 4 The measurement of country-of-origin .......................................................................26 Table 5 Cronbach’s Alpha of each construct............................................................................27 Table 6 Cornbach’s Alpha of perceived service quality if item deleted ..................................27 Table 7 Demographics of the sample.......................................................................................30 Table 8 Composition of measures and item loading................................................................32 Table 9 Discriminant validity...................................................................................................33 Table 10 Results of hypothesis testing.....................................................................................36. VII.
(9) List of Figures Figure 1 The flow chart..............................................................................................................7 Figure 2 The hypothesized model............................................................................................19 Figure 3 The path coefficient ...................................................................................................35. VIII.
(10) Chapter One: Introduction 1.1 Research background Brand equity has been a prevalent topic in business practice as well as in academic research since the early 1990s. Since then, the determinants of brand equity have long been of central interest to international marketing and consumer behaviour researchers, as well as international business managers. Viewed collectively, research focused on explaining brand equity has emphasized determinants at four primary levels of analysis: (1) brand awareness (e.g., Aaker, 1991, 1996; Keller, 1993); (2) brand loyalty (e.g., Aaker, 1991, 1996; Chaudhuri and Holbrook, 2001); (3) perceived quality (e.g., Aaker, 1991, 1996); and (4) country-of-origin (e.g., Pappu, Quester, and Coolsey, 2007; Pecotich and Ward, 2007). For example, Häubl and Elrod (1999) found that consumers’ perception of quality about the Slovenian brand Elan is much higher when the brand is made in Slovenia than made in Germany. However, despite an extensive literature on brand awareness, brand loyalty, perceived quality, and country-of-origin effects, most of previous studies have been made on customer-based brand equity. In other words, a systematic examination based on a conceptual framework for understanding each effect on brand equity for business-to-business (B2B) brands is lacking. In addition, although brand loyalty is often recognized as a source of customer-based brand equity, this study following recent research views brand loyalty as a. 1.
(11) desire outcome of industrial buyer-based brand equity.. In the B2B markets, it is increasingly difficult to gain competitive advantage either based on product quality or price. Recently, industrial companies seek to differentiate themselves from competitors by conducting B2B branding strategies (Mudambi, Doyle, and Wong, 1997; Mudambi, 2002). For example, Boeing, Cisco Systems, Dell, FedEx, General Electrics, HP, IBM, Intel, Microsoft, and SAP are among the most cited best-practice brands in the area of B2B branding. Although most of them also operate in business-to-consumer (B2C) markets, their main business operations are concentrated on B2B. As they do in B2C markets, brands serve exactly the same general purpose in B2B segments by facilitating the identification of products, services and businesses as well as differentiating them from the competition (Anderson and Narus, 2004). Based on systematically examining relationships between brand strategy and performance of global firms, Kotler and Pfoertsch (2007) suggested the need for branding international B2B companies to increase perceived value to customers and reduce risk and complexity involved in the buying decision.. By comparing to abundant B2C studies, international B2B branding research is relatively scarce (Mudambi et al., 1997; Low and Blois, 2002; van Riel et al., 2005). Although only few researchers have recently focused on industrial brand equity or B2B brand equity (e.g., Michell et al., 2001; Mudambi, 2002; Shipley and Howard, 1993), the depth and extensiveness of customer-based brand equity do offer an extensive background to industrial 2.
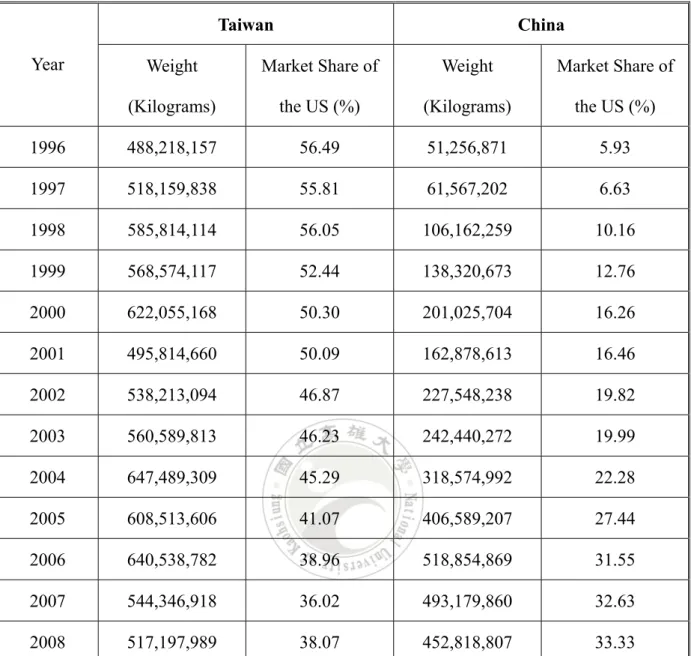
(12) brand equity (Mudambi et al., 2002). In fact, several dimensions in customer-based brand equity can be directly applied and transferable to industrial brand equity (Michell et al., 2001; van Riel et al., 2005). Therefore, this study following previous literature on customer-based brand equity investigates the sources of industrial brand equity in international B2B markets.. 1.2 Research motivation and purposes Taiwanese firms emerged as formidable global B2B market players by successfully transforming themselves from producing mainly low-value, labour-intensive goods to producing many high value-added products that require significant business savvy and expertise (Song et al., 1997). Taiwan was one of the first developing countries to open up to international economic flows, first targeting export markets and then relying on direct investments from foreign multinationals, and the fastener industry 1 played a central role in Taiwan’s economic development. The fastener industry in Taiwan has gained a reputation of “the kingdom of screws” in the world since the 1990s. However, the importance of Taiwanese fastener products to the world has been decreased by the emergence of Chinese products in recent years. Table 1 shows the decrease in the market share of Taiwanese fastener products to the U.S. from 1996 to 2008, while there is an increasing importance of Chinese fastener products in the U.S. market during the same period. To cope with these challenges from. 1. A fastener is a hardware device that mechanically joins or affixes two or more objects together.. 3.
(13) Chinese low-price products, many fastener firms in Taiwan are eagerly to reposition themselves from original equipment manufacturing (OEM) to original design manufacturing (ODM), or even original brand manufacturing (OBM). Therefore, acknowledging the increasing important role of brands, how to brand Taiwanese fastener products in international B2B markets is a salient issue in international marketing and brand management research.. Due to the effect on customer-based brand equity, country-of-origin (COO) has been a key theoretical and empirical issue in international marketing and consumer behavior (Ahmed, 2008). However, most of previous studies on COO have investigated its effect on customer-based brand equity in the B2C markets. Except branding their industrial products, some Taiwanese fastener firms also move their production lines to emerging countries, including China and Vietnam, to reduce production costs to be able to compete with Chinese low-cost suppliers. However, the international outsourcing strategy has led to some problems on how to control product quality across country borders. For example, after the outbreak of SANLU milk powder, one of Chinese top brands, had been founded with toxic chemical melamine causing sixteen infants diagnosed with kidney stones in July 2008, most of customers, including B2C consumers and B2B manufacturers, refuse to buy any milk product from SANLU, and even from China. In fact, due to the use of toxic chemical melamine as a milk powder ingredient previously imported from China, Lipton and Nestle, the world’s 4.
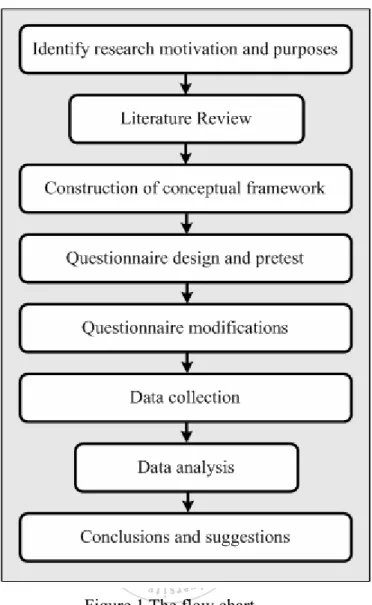
(14) leading instant coffee and milk tea manufacturers, recalled and destroyed all products that had been examined with an ingredient of toxic chemical melamine from markets, especially in Hong Kong, Macau, and Taiwan. This event represents a negative effect of COO on milk powder from China. Thus, with international outsourcing strategy, do fastener products come from different countries cause different industrial buyers’ perceptions of product quality? In other words, being an explorative study, it is valuable to use Taiwanese fastener industry as an example to understand the COO effect on industrial brand equity in international B2B markets.. 1.3 Research process The remainder of this study is organized as follows. The next section provides the conceptual model of how buyer-based equity of an industrial brand might be influenced by perceived quality, brand awareness, and country-of-origin effects, and develops related hypotheses. The ensuing section presents our research design, sample, and method to examine the relationships between the two sets of constructs. We then test our hypotheses against data gathered from international industrial buyers of Taiwanese fastener products, using partial least square regression analysis. The results of empirical part of this study are then presented, followed by the conclusions and implications. The flow chart is depicted in Figure 1.. 5.
(15) Table 1 The fastener exportation amount of Taiwan and China form 1996 to 2008 Taiwan Year. China. Weight. Market Share of. Weight. Market Share of. (Kilograms). the US (%). (Kilograms). the US (%). 1996. 488,218,157. 56.49. 51,256,871. 5.93. 1997. 518,159,838. 55.81. 61,567,202. 6.63. 1998. 585,814,114. 56.05. 106,162,259. 10.16. 1999. 568,574,117. 52.44. 138,320,673. 12.76. 2000. 622,055,168. 50.30. 201,025,704. 16.26. 2001. 495,814,660. 50.09. 162,878,613. 16.46. 2002. 538,213,094. 46.87. 227,548,238. 19.82. 2003. 560,589,813. 46.23. 242,440,272. 19.99. 2004. 647,489,309. 45.29. 318,574,992. 22.28. 2005. 608,513,606. 41.07. 406,589,207. 27.44. 2006. 640,538,782. 38.96. 518,854,869. 31.55. 2007. 544,346,918. 36.02. 493,179,860. 32.63. 2008. 517,197,989. 38.07. 452,818,807. 33.33. Source: Taiwan Industrial Fastener Institute (2009). 6.
(16) Figure 1 The flow chart. 7.
(17) Chapter Two: Literature review and hypothesis development Past studies on the subject of brand equity have often been focused on diverse approaches for the measurement of brand equity (e.g., Keller, 1993; Park and Srinivasan, 1994), and identifying the sources of a brand’s added value to improve the efficiency of marketing activities (e.g., Aaker, 1991; Agarwal and Rao, 1996). In consumer marketing literature, brand equity is generally defined as the added value of a brand or endowed to a product that is created in the mind of consumers on response to past investments in the marketing of the brand (Keller, 1998). Although procurement in industrial markets is often rational and calculative, B2B brands could play a significant role in establishing a consideration set of potential suppliers in the mind of the buyer (van Riel et al., 2005). Customer-based brand equity is generated when the customer is aware of the brand, perceives the overall quality or superiority of a brand relative to alternative products, and associates some favorable, strong, and unique attributes with the brand’s image. While several of these dimensions like brand awareness and perceived quality appear directly transferable to industrial branding, others such as brand associations appear irrelevant in most of B2B markets (e.g., van Riel et al., 2005). For brand associations in the fastener industry, industrial brands are rarely if ever used to evoke non-product related associations. Therefore brand associations are not considered as a determinant of industrial brand equity in this study. 8.
(18) Building on previous studies of conceptualizing how customers evaluate brand equity, we propose industrial brand equity that accrues to a firm, rather than a product, as the relevant dependent variable in the context of B2B markets, and attempt to explain why perceived quality, brand awareness and country-of-origin are considered as sources of industrial brand equity, and establish the relationship between industrial brand equity and industrial brand loyalty for international B2B companies.. 2.1 Perceived quality The importance of perceived quality as a source of customer-based brand equity is well established in B2C market (Aaker, 1991), and recently is also recognized as a driving factor of B2B branding (Bendixen et al., 2004; McQuiston, 2004). The strength of perceived quality is primarily driven by tangible attributes of the product such as product quality, and intangible attributes of the firm such as service quality. Thus in B2B markets, service quality including personal contact and support services, together with the product’s physical quality, increasingly form the basis for competitive advantage (Alvarez and Galera, 2001), and are critical to purchasing decisions and branding (Håkan, 1982; Grönroos, 1984; Rauyruen and Miller, 2007). For example, by investigating how the Finnish steel company Rautaruukki Ojy creates the RAEX LASER brand, McQuiston (2004) finds that consistent product quality, efficient logistics and well-trained employees are important to B2B branding. Viewed in this light, the fastener firms can reap significant industrial brand equity by increasing perceived 9.
(19) product quality and perceived service quality in international B2B markets. Therefore, we hypothesize positive relationships between perceived product quality, perceived service quality and industrial brand equity.. Hypothesis 1: Perceived product quality is positively associated with industrial brand equity.. Hypothesis 2: Perceived service quality is positively associated with industrial brand equity.. In previous studies, both perceived value and distribution performance of industrial products have been identified as the main drivers of perceived product quality (Mudambi et al., 1997). Perceived value of industrial products indicates customers expect to receive more benefits from the purchased product than its payment. Although price is one of the most important criteria for purchasing decisions, customers even in B2B markets are willing to pay more for what they perceive to be superior value. Therefore, industrial firms are eager to have superior value by driving down the cost structure of the business and differentiating their products from competitors, and then creating higher perceived product quality in customers’ minds. In addition, customers are also willing to pay more for the product when it is delivered in their desirable way (McQuiston, 2004). Distribution performance entails customers’ overall satisfaction of all aspects on ordering, availability and delivery of industrial products. 10.
(20) (van Riel et al., 2005). Thus fastener firms can increase their perceived product quality by increasing their distribution performance of industrial goods. Overall, we hypothesize positive relationships between perceived value, distribution performance and perceived product quality.. Hypothesis 3: Perceived value of industrial products is positively associated with perceived product quality.. Hypothesis 4: Distribution performance of industrial products is positively associated with perceived product quality.. Industrial purchase decisions depend not only on the evaluation of functional benefits of the product itself, but also on the assessment of satisfaction of the services the firm provides. Drivers of perceived service quality identified in previous studies were information services and service personnel (van Riel et al., 2005). Although industrial buyers are now able to get more information by various means of online information via the Internet (Sharma et al., 2001), industrial markets are still characterized by asymmetric information: sellers had more information than buyers (van Riel et al., 2005).Therefore, to make good purchase decisions, B2B buyers still need information services provided from sellers. In addition, for many industrial products, good personal contact or fact-to-face interaction between buyer and seller is important to the buyers’ satisfaction. Service personnel entail all aspects of the employees’. 11.
(21) skills, attitudes, behaviors, and modes of communication in all contacts with industrial buyers (Gordon et al., 1993). It is likely that industrial buyers associate employees with superior skills with a higher level of service quality (van Riel et al., 2005). Therefore, the fastener firms can establish stronger perceived service quality by providing more information services and better skilled service personnel in international B2B markets. Thus, we hypothesize positive relationships between information services, service personnel and perceived service quality.. Hypothesis 5: Information services provided by an industrial firm are positively associated with perceived service quality.. Hypothesis 6: Service personnel in an industrial firm are positively associated with perceived service quality.. 2.2 Brand awareness Brand awareness is the customer’s ability to recognize and recall the brand among comparable products in a certain industry under different conditions of complexity and time pressure (Aaker, 1991; Keller, 1998), and is a critical determinant of customer-based brand equity in B2C markets. Since a brand name provides symbolic meanings that aid the customer to recognize and recall the supplier and its product outcome (Janiszewski and Van Osselaer, 2000), brand name is the most fundamental element of brand awareness (Davis et 12.
(22) al., 2008). In many B2B markets brand name is often the company name and a growing number of alternative suppliers can provide similar products to their industrial buyers, how to create an effective brand name that embodies unique values to aid the customer in recognition and recall of the supplier and product is recently becoming important to industrial firms.. Although the brand name, often the company name in B2B markets, may not be one that is particularly memorable or distinctive, and building brand awareness is a long-term process that contributes to increasing brand knowledge, favorability, and sales over time (Keller, 1993), Shipley and Howard (1993) and Michell et al. (2001) find that brand name is important to industrial firm performance, and is a key variable to successful marketing strategy that would like to obtain a competitive position in industrial markets. In addition, recent research shows that brand name and brand awareness explain a significant amount of variance in brand equity in industrial firms (Low and Blois, 2002; Davis et al., 2008). Thus, the fastener firms can reap significant industrial brand equity by building higher level of brand awareness in consumers’ mind. Therefore, we hypothesize positive relationship between brand awareness and industrial brand equity.. Hypothesis 7: Brand awareness is positively associated with industrial brand equity.. 13.
(23) 2.3 Country-of-origin The importance of country-of-origin as a cue in consumer choice behaviour is well established in international business literature and first highlighted by Schooler (1965). Since Schooler (1965) and Reierson (1967), researchers regarding consumers’ perceptions of products from a given country have provided several definitions for country-of-origin. Among these, Nagashima (1970) provides the earliest definition of country-of-origin that is the picture, the reputation, and the stereotype that businessmen and consumers attach to products of a specific country, and created by such variables as national characteristics, economic and political background, history, and traditions, and this definition has had wide acceptance in the following literature (e.g., Terpstra and Han, 1988; Roth and Romeo, 1992). Country-of-origin is also a set of country images or associations organized into groups in a meaningful way (Keller, 1993), and can be categorized as macro and micro perspectives (e.g., Pappu et al., 2007). The macro country-of-origin is the customer perceptions of economic, political, technological, educational or life standards of a country, and the total of all descriptive, inferential and informational beliefs one has about a particular country (Martin and Eroglu, 1993), while the micro country-of-origin refers to the products produced in a country (Nagashima, 1970; Terpstra and Han, 1988; Roth and Romeo, 1992). For example, Bilkey and Nes (1982) classify four main groups of country-of-origin, products in general as macro country-of-origin, and classes of products, specific product items and brands as micro 14.
(24) country-of-origin, and find that country-of-origin has a significant effect on product evaluation for each group. Nevertheless, this study takes a larger, more comprehensive and overall perspective of country-of-origin that has led to the conceptualized measurement of general summary construct about a particular country. In other words, this study uses the term ‘country-of-origin effects’ to include what other research refers to as ‘macro’ and ‘micro’ country-of-origin effects.. Since the 1970s, country-of-origin effects have been found to exist for consumers’ overall perceptions, e.g., perceived quality of products made in a given country (Etzel and Walker, 1974; Bilkey and Nes, 1982; Cattin et al., 1982; Jaffe and Nebenzahl, 1984; Johansson and Thorelli, 1985; Han, 1989; Hong and Wyer, 1989, 1990; Darling and Wood, 1990), for general attitude towards a particular country (Reierson, 1967; Han, 1988; Papadopoulos et al., 1990; Martin and Eroglu, 1993; Klein et al., 1998; Pappu et al., 2007), and for specific brands (Johansson et al., 1985; Terpstra and Han, 1988; Han, 1989; Chao, 1993; Tse and Gorn, 1993; Maheswaran, 1994). Some recent studies have extended this line of research by incorporating new concept country equity: brands from the same country share images or associations (Shimp et al., 1993), or brands originating from a particular country can create intangible assets or liabilities in consumers’ minds, shared by other brands originating from the same country (Kim and Chung, 1997). For example, brands such as Toyota, Mitsubishi and Suzuki could share certain associations, such as “reliability”, because 15.
(25) of their common home country of Japan (Pappu et al., 2007, p. 728). In addition, several researchers have found the important relationship between country-of-origin and brand equity (Hui and Zhoh, 2003; Essoussi and Merunka, 2007; Pappu et al., 2007). Therefore, brands with higher levels of country-of-origin effects are more likely to have higher industrial brand equity for Taiwanese fastener firms in international B2B markets. Therefore, we hypothesize positive relationship between country-of-origin and industrial brand equity.. Hypothesis 8: Country-of-origin is positively associated with industrial brand equity.. 2.4 Brand loyalty Brand loyalty has been an important issue in the field of marketing since 40 years ago (Howard and Sheth, 1969; Jacoby et al., 1978; Tellis, 1988; Aaker, 1991; Keller, 1993; Oliver, 1999; Chaudhuri and Holbrook, 2001; Yoo and Donthu, 2001; Bennetta et al., 2005; Russell-Bennetta et al., 2007). Brand loyalty is defined as a deeply commitment to repurchase or consistently a preference to a product/service, and leads to certain marketing advantages such as reduced cost, profitability, and favorable word of mouth (Aaker, 1991; Dick and Basu, 1994; Oliver, 1999; Ganesh et al., 2000). Marketing researchers, especially from the field of consumer behavior, investigate the importance of brand loyalty from behavioral and attitudinal perspectives. While behavioral brand loyalty indicates repeatable purchasing can capture brand loyalty from customers and then focus on actual actions of customers (e.g., Ehrenberg and Goodhardt, 2000), attitudinal brand loyalty emphasizes 16.
(26) commitments to some unique values such as happenstance purchases or preference for convenience associated with the brand and then focus on customers’ beliefs or attitudes (e.g., Jacoby and Chestnut, 1978; Patterson et al., 1997; Dorsch et al., 2000; Bennett and Rundle-Thiele, 2002). In addition, both behavioral and attitudinal brand loyalty studies find that satisfaction and involvement are the important antecedents of brand loyalty (e.g., Bennetta et al., 2005; Russell-Bennetta et al., 2007). However, previous literature on the determinants of brand loyalty is mostly from the customer-based perspective, and rarely from the industrial buyer-based one.. Brand loyalty is often recognized as a source or determinant of brand equity (Aaker, 1991; Keller, 1993, 1998). However, recent researchers have found brand loyalty as a desired outcome of publishing a brand, or brand equity (Lassar et al., 1995; Mudambi et al., 1997; Riel et al., 2005). For example, Lassar et al. (1995) from customer-based perspective argue that brand equity stems from great confidences or impressive images in customers’ minds, and these confidences or images will translate into customers’ loyalty that makes them willing to pay premium prices for brands. In addition, van Riel et al. (2005) from industrial buyer perspective find a direct positive relationship between industrial brand equity and brand loyalty. Therefore, this study following the conceptual framework of van Riel et al. (2005) view brand loyalty as a desired outcome of industrial brand equity. Thus the fastener firms can reap higher levels of brand loyalty by increasing industrial brand equity, and we 17.
(27) hypothesize positive relationship between industrial brand equity and brand loyalty.. Hypothesis 9: Industrial brand equity is positively associated with brand loyalty.. 18.
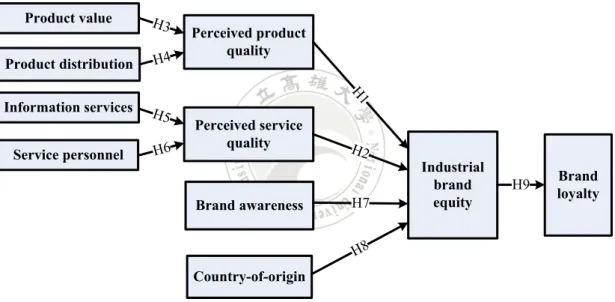
(28) Chapter Three: Research method 3.1 Research framework Our nine hypotheses are summarized in Figure 2. In the following section we shall confront this model with the empirical data.. H3. Product distribution. H4. Information services. H5. Service personnel. H6. Perceived product quality H1. Product value. Perceived service quality. Brand awareness. H2. H7. Industrial brand equity. H9. Brand loyalty. H8. Country-of-origin. Figure 2 The hypothesized model. 3.2 Survey procedures and sample Unlike the industrialization of Japan and South Korea, in which large firms led export-oriented growth, the economic success of Taiwanese fastener industry in international marketplace is mainly led by small and medium-sized enterprises (SMEs), often involved in direct contract relations with U.S. and European clients. Many of Taiwanese fastener SMEs 19.
(29) produce drywall screw, chipboard screw, self-drilling screw, decking screw, and tapping screw for construction purpose, and recently, some firms emerged as formidable global market players by successfully transforming themselves from producing mainly low value, labour-intensive screws to producing many high value-added products that require significant R&D investment and business expertise. Thus these fastener SMEs with outstanding performance are the representatives to investigating the determinants of industrial brand equity in current study. For example, the S fastener company was founded in Taiwan 40 years ago. After upgrading from OEM to ODM and OBM through R&D and marketing investments, the S fastener company has become one of top 10 fastener firms and one of top 1000 enterprises in Taiwan since 20 years ago, and has obtained many national awards like Taiwanese Golden Exporter Award, Taiwanese Rising Star Award, and National Award of Taiwanese Outstanding SMEs.. A review of the literature and a subset of expert interviews provided the input for identifying the items included in the survey instrument used. The questionnaire is designed as a seven-point Likert scale that is from strongly disagree to strongly agree, pretested using a judgment sample of 30 actual industrial buyers, and subsequently revised to improve readability and understanding. The pilot study was made available online and conducted in January 2009 with the help of trained research assistants and IT specialists.. Based on interviews with marketing executives of Taiwanese fastener SMEs who 20.
(30) produce construction-based screws, the population size of foreign industrial buyers is limited to 102. With the support of company sales representatives, an invitation to participate in the survey, started from February to April 2009 through fax, e-mail, and online questionnaire website (www.my3q.com), was sent to these industrial buyers in North America, Europe, Oceania and Asia. Target informants of the sampling frame are managers who regularly interface with customers and are responsible for their firms’ relationships with construction companies. Of the 102 questionnaire distributed, 64 respondents were received with 26 from Europe, 18 from North America, 17 from Oceania, and 3 from Asia.. 3.3 Measures and measure validation As discussed in previous chapter, perceived quality has been viewed an important factor to branding process in both B2C and B2B markets. The strength of perceived quality is primarily driven by tangible attributes of the product such as perceived product quality, and intangible attributes of the firm such as perceived service quality. In previous studies, both perceived value and distribution performance of industrial products have been identified as the main drivers of perceived product quality (Mudambi et al., 1997). Although price is one of the most important criteria for purchasing decisions, customers even in B2B markets are willing to pay more for what they perceive to be superior value. Distribution performance entails customers’ overall satisfaction of all aspects on ordering, availability and delivery of industrial products (van Riel et al., 2005). 21.
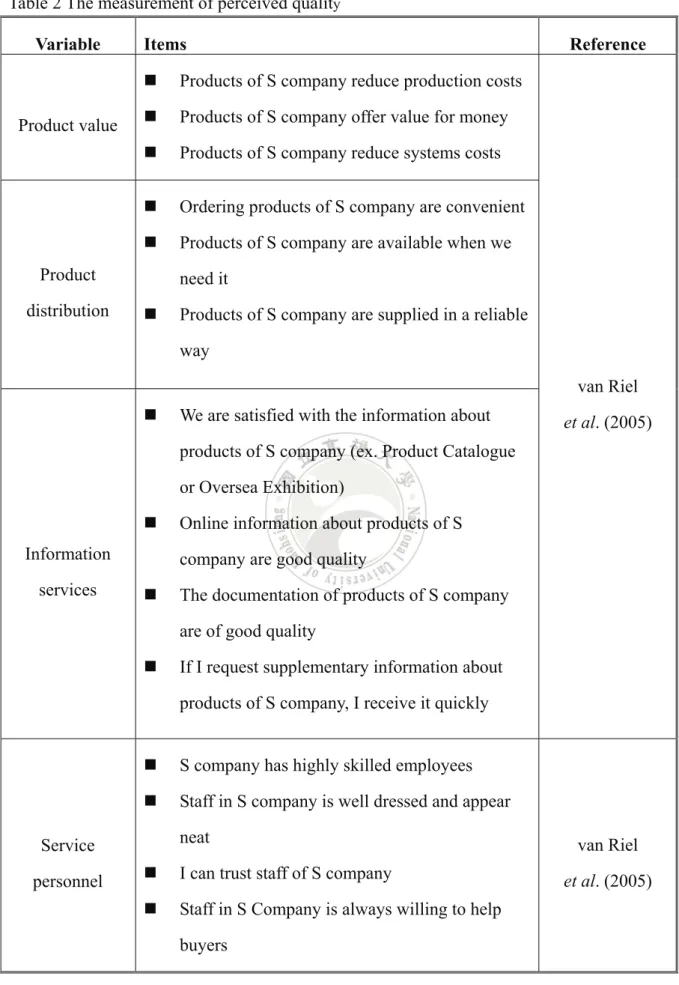
(31) Drivers of perceived service quality identified in previous studies were information services and service personnel (van Riel et al., 2005). Although industrial buyers are now able to get more information by various means of online information via the Internet (Sharma et al., 2001), industrial markets are still characterized by asymmetric information: sellers had more information than buyers (van Riel et al., 2005). Therefore, to make good purchase decisions, B2B buyers still need information services provided from sellers. In addition, for many industrial products, good personal contact or fact-to-face interaction between buyer and seller is important to the buyers’ satisfaction. Service personnel entail all aspects of the employees’ skills, attitudes, behaviors, and modes of communication in all contacts with industrial buyers (Gordon et al., 1993).The construction of measurements for product value, product distribution, information services, service personnel, perceived product quality, and perceived service quality were presented on seven-point scale which is ranging from strongly disagree to strongly agree as depicted in Table 2.. 22.
(32) Table 2 The measurement of perceived quality Variable. Product value. Items . Products of S company reduce production costs. . Products of S company offer value for money. . Products of S company reduce systems costs. . Ordering products of S company are convenient. . Products of S company are available when we. Product distribution. Reference. need it . Products of S company are supplied in a reliable way van Riel. . We are satisfied with the information about. et al. (2005). products of S company (ex. Product Catalogue or Oversea Exhibition) Information services. Online information about products of S company are good quality. . The documentation of products of S company are of good quality. . If I request supplementary information about products of S company, I receive it quickly. . S company has highly skilled employees. . Staff in S company is well dressed and appear neat. Service personnel. van Riel. . I can trust staff of S company. . Staff in S Company is always willing to help buyers. 23. et al. (2005).
(33) . Products that manufactured by S company are high quality. . development lead time are excellent. Perceived product quality. Products that manufactured by S company. . Product that manufactured by S company are dependable and consistent. . Products that manufactured by S company are innovative. . The technical support of products manufactured by S Company are excellent. Perceived. . service quality. We are satisfied with production support for products of S company. . We are satisfied with development support for products of S company. Brand awareness is the customer’s ability to recognize and recall the brand among comparable products in a certain industry under different conditions of complexity and time pressure (Aaker, 1991; Keller, 1998). Since a brand name provides symbolic meanings that aid the customer to recognize and recall the supplier and its product outcome (Janiszewski and Van Osselaer, 2000), brand name is the most fundamental element of brand awareness (Davis et al., 2008). In many B2B markets brand name is often the company name and a growing number of alternative suppliers can provide similar products to their industrial buyers, how to create an effective brand name that embodies unique values to aid the customer in recognition and recall of the supplier and product is recently becoming important 24.
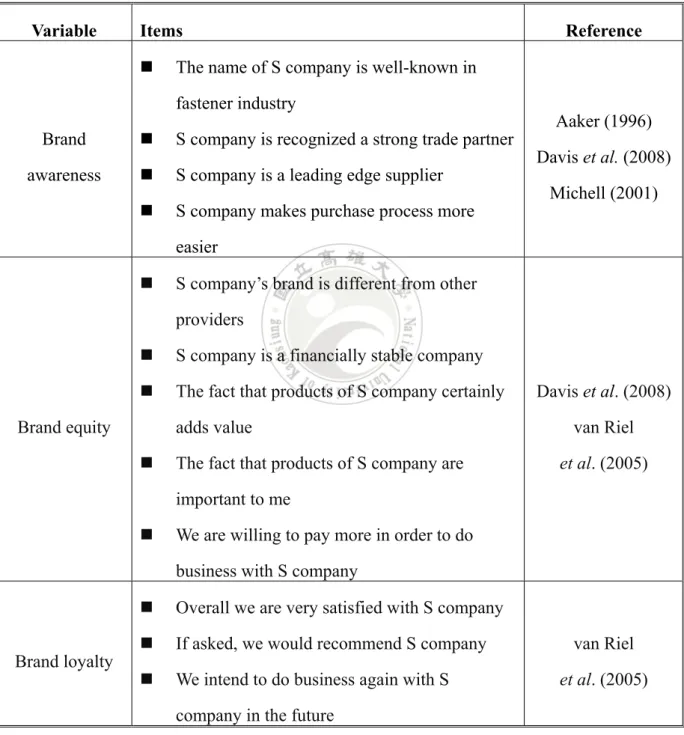
(34) to industrial firms. We employee items form Aaker (1996), Davis et al. (2008), Michell (2001), and van Riel et al. (2005) to measure constructs of brand awareness, industrial brand equity, and brand loyalty. The entire questionnaire items are listed in Table 3. Table 3 The measurement od brand awareness, brand equity, and brand loyalty Variable. Items . Reference. The name of S company is well-known in fastener industry. Brand. . S company is recognized a strong trade partner. awareness. . S company is a leading edge supplier. . S company makes purchase process more. Aaker (1996) Davis et al. (2008) Michell (2001). easier . S company’s brand is different from other providers. . S company is a financially stable company. . The fact that products of S company certainly. Brand equity. adds value . Davis et al. (2008) van Riel. The fact that products of S company are. et al. (2005). important to me . We are willing to pay more in order to do business with S company. Brand loyalty. . Overall we are very satisfied with S company. . If asked, we would recommend S company. . We intend to do business again with S company in the future. 25. van Riel et al. (2005).
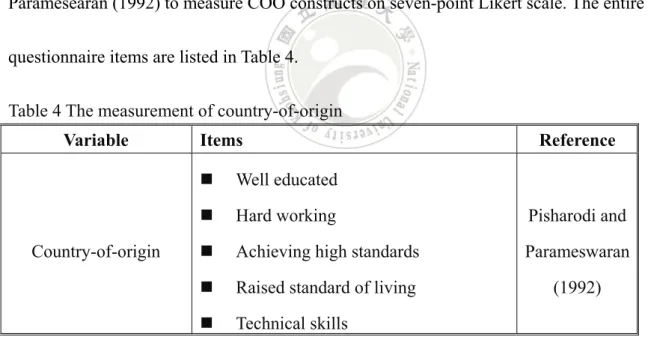
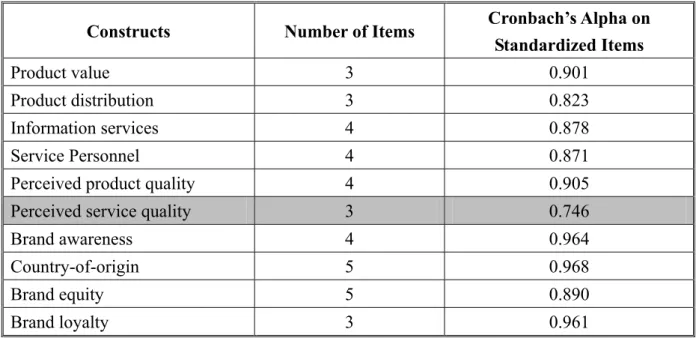
(35) Country-of-origin is the picture, the reputation, and the stereotype that businessmen and consumers attach to products of a specific country, and created by such variables as national characteristics, economic and political background, history, and traditions. As discussed in previous chapter, country-of-origin can be categorized as macro and micro perspectives, and this study takes the macro view of country-of-origin. The macro country-of-origin is the customer perceptions of economic, political, technological, educational or life standards of a country, and the total of all descriptive, inferential and informational beliefs one has about a particular country (Martin and Eroglu, 1993). This study employees items from Pisharodi and Paramesearan (1992) to measure COO constructs on seven-point Likert scale. The entire questionnaire items are listed in Table 4. Table 4 The measurement of country-of-origin Variable. Country-of-origin. Items. Reference. . Well educated. . Hard working. Pisharodi and. . Achieving high standards. Parameswaran. . Raised standard of living. (1992). . Technical skills. All Cronbach’s Alphas shown in Table 5 were over .80 with the exception of one construct on perceived service quality. To increase construct reliability in the pretest step, we deleted an item from the construct of perceived service quality to raise its Cronbach’s Alpha to .832 as shown in Table 6. 26.
(36) Table 5 Cronbach’s Alpha of each construct Number of Items. Cronbach’s Alpha on Standardized Items. Product value. 3. 0.901. Product distribution. 3. 0.823. Information services. 4. 0.878. Service Personnel. 4. 0.871. Perceived product quality. 4. 0.905. Perceived service quality. 3. 0.746. Brand awareness. 4. 0.964. Country-of-origin. 5. 0.968. Brand equity. 5. 0.890. Brand loyalty. 3. 0.961. Constructs. Table 6 Cornbach’s Alpha of perceived service quality if item deleted Scale mean if item deleted. Scale variance if item deleted. Corrected item-total correlation. Squared multiple correlation. Cronbach’s Alpha if item deleted. SQ_5. 11.10. 5.472. 0.410. 0.179. 0.832. SQ_6. 11.00. 4.621. 0.616. 0.521. 0.582. SQ_7. 11.10. 5.059. 0.690. 0.549. 0.518. 27.
(37) 3.4 Methodology Structural equation modeling (SEM) using partial least squares (PLS) was employed to simultaneously estimate hypothesized relationships represented in the following equations: PROD = α0 + β1VAL + β2 DIS + ε1. (1). SERV = α1 + β3 INFO + β 4 PERS + ε 2. (2). BE = α 2 + β5 PROD + β6 SERV + β7 BA + β8COO + ε3. (3). BL = α 3 + β 9 BE + ε 4. (4). In each equation, α represents the intercept, β the coefficient, and ε the error term. SEM is a statistical technique for testing and estimating causal relationships like the above structural framework, and has been widely applied in the fields of social sciences and marketing. The variance-based PLS, rather than the covariance-based LISREL, was chosen for three reasons. First, unlike the minimum requirement of 200 cases for using LISREL, PLS allows the use of small sample size of respondents for estimating the structural models (Chin and Newsted, 1999), and can produce reliable results for sample size as low as 20 (Chin, 1998). Second, given the exploratory and prediction-oriented nature of the research, the flexibility of PLS makes it more convenient than LISREL for the study (Barclay et al., 1995; Fornell and Cha, 1994). Finally, while ordinary least squares (OLS) usually yields unstable results due to high correlations between predictor variables, PLS can avoid the 28.
(38) multicollinearity problem to reduce analysis errors (Ryan et al., 1999). Given these advantages, PLS has become one of popular statistical methods for linear models in recent years, and this study uses the software Visual PLS to implement PLS technique to test our hypotheses. By applying SEM analysis, PLS consists of two procedures: the measurement model and the structural model, which will be discussed in the following sections.. 29.
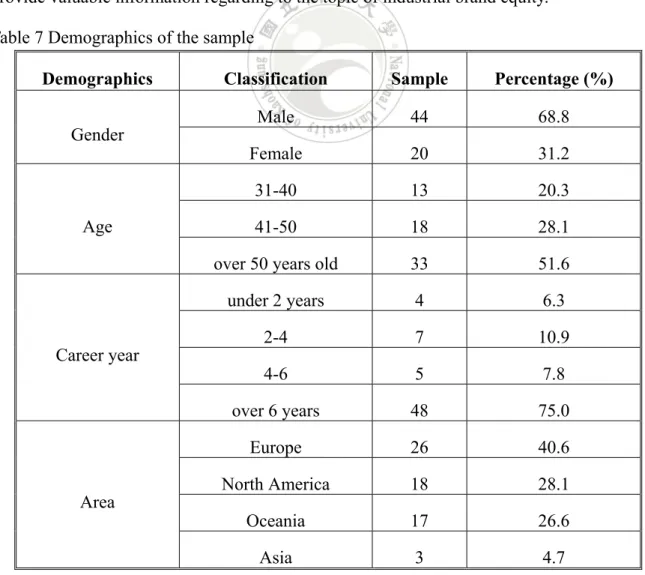
(39) Chapter Four: Empirical Results 4.1 Demographics Demographics of the sample is provided in Table 7. Most of the respondents are male (68.8%), senior (79.7%) who are over 40 years old, and experienced representatives (75.0%) who work for the fastener industry over six years. The companies of respondents are located in Europe (40.6%), North America (28.1%), Oceania (26.6%), and Asia (4.7%). Since most of the respondents are senior and experienced representatives in fastener industry, they can provide valuable information regarding to the topic of industrial brand equity. Table 7 Demographics of the sample Demographics Gender. Age. Career year. Area. Classification. Sample. Percentage (%). Male. 44. 68.8. Female. 20. 31.2. 31-40. 13. 20.3. 41-50. 18. 28.1. over 50 years old. 33. 51.6. under 2 years. 4. 6.3. 2-4. 7. 10.9. 4-6. 5. 7.8. over 6 years. 48. 75.0. Europe. 26. 40.6. North America. 18. 28.1. Oceania. 17. 26.6. Asia. 3. 4.7. 30.
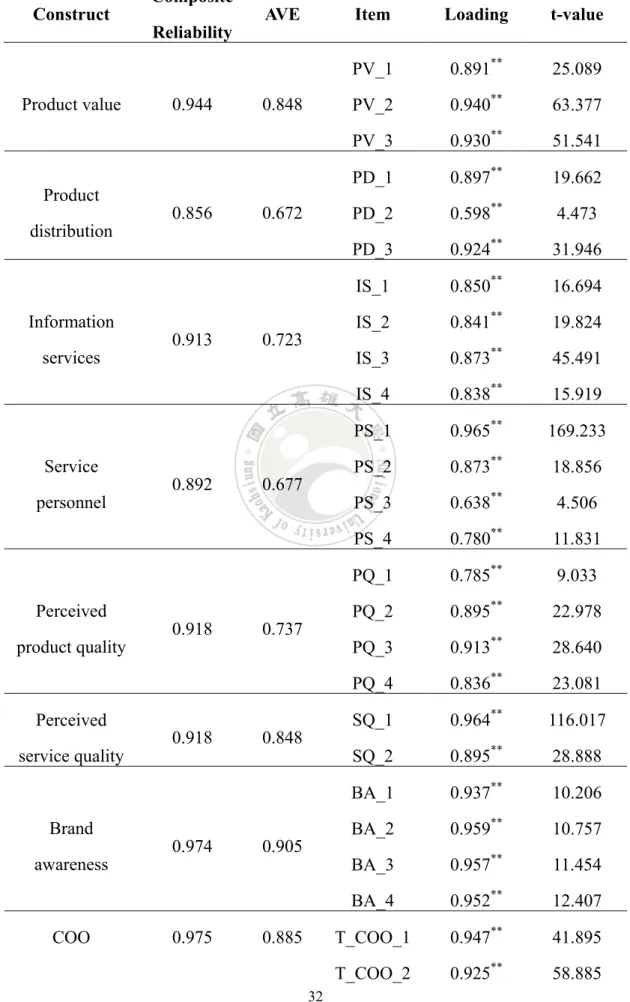
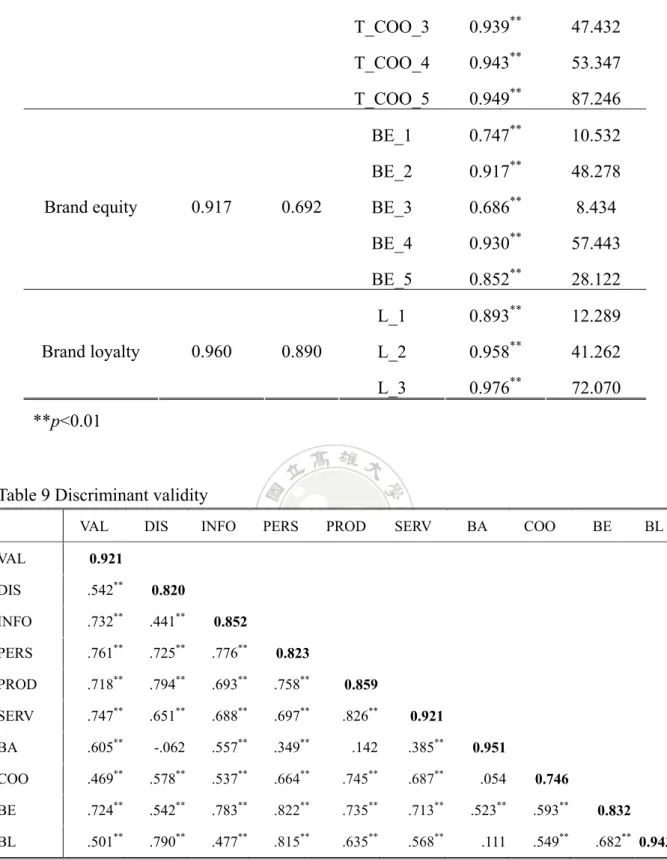
(40) 4.2 Measurement model Measurement model is an analysis that uses confirmatory factor analysis (CFA) to assure indicators of each construct actually measured what they were supposed to measure by testing validity and reliability of each construct. For the validity of the sample, we conducted tests for convergent and discriminant validity. First, convergent validity was assessed by examining construct loadings and average variance extracted (AVE). All constructs’ loadings shown in Table 8 were significant (p<.01) and above the recommended threshold of .50 for AVE (Fornell and Larcker, 1981), which indicates good convergent validity. Second, discriminant validity was examined by comparing the shared variance among indicators of each construct (i.e., AVE) with the variance shared between constructs (i.e., squared correlations) (Davis et al., 2008). The criteria for testing discriminant validity of the model is when AVE for each construct is greater than the squared correlations with other constructs (Fornell and Larcker, 1981). By displaying AVE for each construct and squared correlations between constructs and reading down the columns and/or across the rows, Table 9 shows that AVE for each construct is greater than the squared correlations between constructs, meeting the test for discriminant validity. For the reliability of the model, this study conducted the test for composite reliability (CR). The higher CR means more construct reliability and representativeness of latent variables. All estimated latent variables shown in Table 8 were above the recommended threshold of .60 for CR. 31.
(41) Table 8 Composition of measures and item loading Construct. Product value. Product distribution. Information services. Service personnel. Perceived product quality. Perceived service quality. Brand awareness. COO. Composite Reliability. 0.944. 0.856. 0.913. 0.892. 0.918. 0.918. 0.974. 0.975. AVE. 0.848. 0.672. 0.723. 0.677. 0.737. 0.848. 0.905. 0.885 32. Item. Loading. t-value. PV_1. 0.891**. 25.089. PV_2. 0.940**. 63.377. PV_3. 0.930**. 51.541. PD_1. 0.897**. 19.662. PD_2. 0.598**. 4.473. PD_3. 0.924**. 31.946. IS_1. 0.850**. 16.694. IS_2. 0.841**. 19.824. IS_3. 0.873**. 45.491. IS_4. 0.838**. 15.919. PS_1. 0.965**. 169.233. PS_2. 0.873**. 18.856. PS_3. 0.638**. 4.506. PS_4. 0.780**. 11.831. PQ_1. 0.785**. 9.033. PQ_2. 0.895**. 22.978. PQ_3. 0.913**. 28.640. PQ_4. 0.836**. 23.081. SQ_1. 0.964**. 116.017. SQ_2. 0.895**. 28.888. BA_1. 0.937**. 10.206. BA_2. 0.959**. 10.757. BA_3. 0.957**. 11.454. BA_4. 0.952**. 12.407. T_COO_1. 0.947**. 41.895. T_COO_2. 0.925**. 58.885.
(42) Brand equity. 0.917. Brand loyalty. 0.960. T_COO_3. 0.939**. 47.432. T_COO_4. 0.943**. 53.347. T_COO_5. 0.949**. 87.246. BE_1. 0.747**. 10.532. BE_2. 0.917**. 48.278. BE_3. 0.686**. 8.434. BE_4. 0.930**. 57.443. BE_5. 0.852**. 28.122. L_1. 0.893**. 12.289. L_2. 0.958**. 41.262. L_3. 0.976**. 72.070. 0.692. 0.890. **p<0.01. Table 9 Discriminant validity VAL. DIS. INFO. PERS. PROD. SERV. BA. COO. BE. BL. VAL. 0.921. DIS. .542**. 0.820. INFO. .732**. .441**. 0.852. PERS. .761**. .725**. .776**. 0.823. PROD. .718**. .794**. .693**. .758**. 0.859. SERV. .747**. .651**. .688**. .697**. .826**. 0.921. BA. .605**. -.062. .557**. .349**. .142. .385**. 0.951. COO. .469**. .578**. .537**. .664**. .745**. .687**. .054. 0.746. BE. .724**. .542**. .783**. .822**. .735**. .713**. .523**. .593**. 0.832. BL. .501**. .790**. .477**. .815**. .635**. .568**. .111. .549**. .682** 0.943. Note: Average variance extracted on diagonal in bold. ** Correlation is significant at the 0.01 level (2-tailed). 33.
(43) 4.3 Structural model Structural model is an analysis to use the squared multiple correlation (R2) of the dependent variable to examine the explanatory power of the model. First, for equation (1), 79% of variation in the level of perceived product quality was explained by independent variables (i.e., product value and distribution). Second, for equation (2), 58.5% of variation in the level of perceived service quality was explained by information services and service personnel. Third, for equation (3), 71.1% of variation in the level of industrial brand equity was explained by independent variables (i.e., perceived product quality, perceived service quality, brand awareness, and country-of-origin). Finally, for equation (4), 50.7% of variation in the level of brand loyalty was explained by industrial brand equity. Thus the results shown in Figure 3 demonstrate acceptable explanatory power for each equation, which provides the evidence of good model fit for our sample.. After demonstrating acceptable explanatory power for our conceptual framework, the next step is to test hypotheses by examining the significance level, direction, and magnitude of the standardized estimates of paths that link independent variables with the dependent variable. Results were summarized in Figure 3 and Table 10. Not all hypothesized relationships were significant (p<.01). The findings show support for a positive relationship between product value and perceived product quality (H3, β=0.357**), product distribution and perceived product quality (H4, β=0.631**), information services and perceived service 34.
(44) quality (H5, β=0.326**), service personnel and perceived service quality (H6, β=0.471**), perceived product quality and industrial brand equity (H1, β=0.632**), brand awareness and industrial brand equity (H7, β=0.385**), and industrial brand equity and brand loyalty (H9, β=0.712**). However, the hypothesized relationships between perceived service quality and industrial brand equity (H2, β=-0.058), and between country-of-origin and industrial brand equity (H8, β=0.179) are not supported.. Figure 3 The path coefficient. 35.
(45) Table 10 Results of hypothesis testing Path Model. Hypothesis. Path coefficient. T-value. Conclusion. PROD→BE. H1. 0.632**. 3.604. Significant. SERV→BE. H2. -0.058. 0.333. Insignificant. VAL→PROD. H3. 0.357**. 3.776. Significant. DIS→PROD. H4. 0.631**. 6.121. Significant. INF→SERV. H5. 0.326**. 3.613. Significant. PER→SERV. H6. 0.471**. 2.802. Significant. BA→BE. H7. 0.385**. 3.668. Significant. COO→BE. H8. 0.179. 1.190. Insignificant. BE→BL. H9. 0.712**. 14.195. Significant. **p<0.01. 4.4 Discussion The present study of branding in the fastener industry contributes our understandings of brands and brand management in industrial B2B manufacturing settings. First, hypotheses H1 and H2 stated that both perceived product quality and perceived service quality would be related to industrial buyer-based brand equity. Results of hypotheses testing confirmed the existence of a significant relationship between perceived product quality and industrial brand equity, but not between perceived service quality and industrial brand equity. This insignificant relationship implies service quality of fastener products is not an important factor to build industrial brand equity in customers’ minds. This is a new finding in the literature. One possible explanation for this finding is that although Taiwanese fastener 36.
(46) companies might unavoidably produce defective products, industrial buyers usually do not return these defectives back to their fastener providers to ask for the assistance of services. In addition, Taiwanese fastener companies have upgraded their manufacturing facilities with automatic machines and equipments to increase product quality and lower production costs since the 1990s. These upgraded and automatic production processes build the impression of reliability and high quality of screws in customers’ minds.. Second, our results also show that while the relationship between product value and perceived product quality was significantly positive as well as between product distribution and perceived product quality, supporting both H3 and H4, the relationship between information services and perceived service quality was also significantly positive as well as between service personnel and perceived service quality, supporting both H5 and H6. These significant relationships confirmed the existence of the determinants of each perceived quality dimension on product and service in the case of fastener industry.. Third, hypothesis H7 stated that brand awareness of a company would be related to industrial buyer-based brand equity. Results of hypothesis testing confirmed the contribution of brand awareness to industrial brand equity, supporting H7. This finding implies that brand names can be used to differentiate the offers among fastener firms and to give a firm an advantage over B2B competitors. Traditionally, Taiwanese fastener manufacturers believed that is was impossible to build an international brand for screws because of fastener product 37.
(47) attributes such as small size, low unit price, embedded inside the goods (e.g., buildings, machines and houses). However, the empirical results indicate that B2B customers are willing to pay more to do business with fastener providers with strong, positive brand awareness. This is a new finding in the literature.. Fourth, in order to explore the contribution of country-of-origin to industrial brand equity, hypothesis H8 stated that country-of-origin effects of a country would be associated with industrial brand equity. However, the results show that the relationship between country-of-origin effects and industrial brand equity is insignificant, which implies country-of-origin of fastener products is not an important determinant of industrial brand equity. This is a new finding in the literature. One possible explanation for this finding is that although the fastener sectors in Taiwan have upgraded and automated their production processes with more efficiency and outcomes, it is still difficult for some of Taiwanese fastener companies to compete with counterparts in China exclusively on the basis of more efficient manufacturing facilities. The most important reason is that the fastener industry is still a labour-intensive and price-oriented sector. Confronting the difficult situation that results when more efficient equipments are insufficient to compete in labour-intensive industries against lower wages of a developing country, some Taiwanese fastener companies had reluctantly taken outward foreign direct investment by moving their advanced plants and production equipments into developing countries like China about 15 years ago. With 38.
(48) favorable government industrial policies, most of recent exports of Chinese screws were made by Taiwanese companies in China and increased sharply. In addition, with the imports of advanced production equipments, the quality of screws made in China has been continuously improved as high as made in Taiwan. Therefore, from the results, there is not much evidence to support that country-of-origin effects are critical to building industrial brand equity in the case of Taiwanese fastener products.. Finally, the results of hypothesis H9 testing show that industrial brand equity explained a significant amount of variance in brand loyalty in the international fastener industry. One possible explanation for this finding is that it is difficult to switch fastener providers for loyal industrial buyers because of preference and long-term relationship. In addition, Taiwanese fastener firms with variable innovative products, high response speed and efficient logistics make loyal customers satisfied even with paying high price. To stay ahead of the competition, Taiwanese fastener companies have to realize that building a strong brand or industrial brand equity like Intel’s “Intel Inside” campaign, an ingredient brand approach for increasingly sophisticated customers (Kotler and Pfoertsch, 2007), is a key step to have loyal customers.. 39.
(49) Chapter Five: Conclusion and implication 5.1 Conclusion This study explores the sources of industrial brand equity in international B2B markets with a particular interest in investigating the effects of perceived product quality, perceived service quality, brand awareness and country-of-origin. In the marketing field, researchers have long been interested in understanding the determinants of brand equity. However, much previous studies have been made on customer-based brand equity rather than industrial buyer-based brand equity. Thus the present study examined the relationships between industrial buyers’ perceived quality of screws, awareness of a company, country-of-origin effect, and brand equity in Taiwanese fastener industry provides new findings for the literature and offers support to some existing findings.. 5.2 Implications This study provides an understanding of the application of branding practices in the fastener industry, as well as offering a foundation for future B2B manufacturing branding research. First, industrial brand equity in Taiwanese fastener industry can be conceptualized as the result of past investments in improving product quality and building up brand awareness. Industrial buyers’ perceptions about the fastener products have an influence on the way they perceive and evaluate the brand. This, in turn, has an effect on their purchasing 40.
(50) decisions. By investing in improving product quality, fastener companies create positive industrial brand equity. In addition, the results show that perceived product quality is mostly influenced by physical product attributes and distribution.. Although building brand awareness is a long-term process, brands with higher levels of awareness in Taiwanese fastener industry are more likely to be included in customers’ consideration sets and subsequently selected and valued, compared with unknown brands, which provides similar implications as suggested by Aaker (1991) and Gordon et al. (1993) in consumer contexts. In this way, industrial brand equity and brand loyalty are created. When the fastener firm’s name is the brand, in addition to inputs of physical product attributes and improved product quality, how to build brand awareness through customers’ recall and identification of the brand among competitors is the key to generate industrial brand equity for the firm.. Second, inconsistent with findings in prior research, the current study provides not much evidence to support that perceived service quality and country-of-origin are large contributors to building brand equity in the fastener industry. These new findings imply that industrial characteristics and structures of Taiwanese fastener industry are different from others. For example, although the fastener sectors in Taiwan have upgraded and automated their production processes with more efficiency and outcomes, it is still difficult for some of Taiwanese fastener companies to compete with counterparts in China exclusively on the basis 41.
(51) of more efficient manufacturing facilities. The reason behind this phenomenon is that the fastener industry is still a labour-intensive and price-oriented sector, rather than a country-of-origin- and services-oriented industry. Although country-of-origin is not an important factor to industrial brand equity in the case of fastener products, the imminent rise of China to a world economic power is one of the most remarkable events in recent economic history. Based on the relations between Taiwan and China closely fit the culturalist pattern, a modern institutionalist approach to culture and cultural explanations of observed economic performance have always been popular (Herrmann-Pillath, 2006). Therefore, the current study gives rise to a very peculiar institutional pattern of economic integration to Taiwan and China, and can lead to different conceptual frameworks of brand equity if cognitive models differ across country borders.. Finally, this study provides evidence for the application of customer-based brand equity theory, traditionally used in consumer contexts, in the context of international B2B manufacturing. Findings indicate that Aaker’s (1991) conceptualization of brand equity as a construct comprised of perceived quality and brand awareness provides an appropriate framework for explaining and predicting variance in industrial brand equity among fastener brands. Other research proposes different dimensions of brand equity (Keller, 1993; van Riel et al., 2005). Although the current study recognizes brand loyalty as a desired outcome of industrial brand equity and not considers brand associations as a source of brand equity 42.
(52) because of core market position of Taiwanese fastener firms, it would be informative in future research to see additional dimensions applied to investigating the determinants of brand equity for other industries.. 5.3 Limitations and research opportunities A number of limitations and suggestions pertain to our study. First, it focused exclusively on a single industrial market: the fastener market. Future testing may expand the subject of study to different industries (e.g. service industry) to fully understand the determinants of branding. Secondly, the relative small sample prohibits the full generalization of the conclusion. Therefore, the future studies can employee a large sampling population to obtain numerous responses that make studies more reliable and valid. Finally, because of time limitation, the future studies may add different country examination to make the research context of industrial brand equity more completely.. 43.
(53) Reference Aaker, D.A. 1991. Managing brand equity. New York: Free Press. Aaker, D.A. 1996. Building strong brands. New York: Free Press. Agarwal, M.K. and Rao, V.R.. 1996. “An empirical comparison of consumer-based measures of brand equity.” Marketing Letters 7(3): 237-247. Ahmed, S. A. and d'Astous, A. 2008. “Antecedents, moderators and dimensions of country-of-origin evaluations.” International Marketing Review 25(1): 75-106. Aladwani, A.M. and Palvia, P. C. 2002. ” Developing and validating an instrument for measuring user-perceived web quality.” Information & Management 39(6): 467–476 Alvarez, P. and Galera, C. 2001. “Industrial marketing applications of quantum measurement techniques.” Industrial Marketing Management, 30(1): 13-22. Anderson, J.C. and Narus, J.A. 2004. Business market management: understanding, creating, and delivering value. Pearson Prentice-Hall, Englewood Cliffs, NJ, pp. 136. Barclay, D., Higgins, C., and Thompson, R. 1995. “The Partial Least Squares (PLS) approach to causal modeling: personal computer adoption and use as an illustration.” Technology Studies 2(2): 285-309. Bendixen, M., Bukasa, K. A., and Abratt, R. 2004. “Brand equity in the business-to-business market.” Industrial Marketing Management 33(5): 371-380. 44.
(54) Bennett, R. and Rundle-Thiele, S. 2002. “Measuring attitudinal brand loyalty.” Journal of Brand Management 9(3): 193-209. Bennetta, R., Härtel, C. E. J., and McColl-Kennedy, J. R. 2005. “Experience as a moderator of involvement and satisfaction on brand loyalty in a business-to-business setting 02-314R.” Industrial Marketing Management 34(1): 97-107. Bilkey, W.J. and E. Nes. 1982. “Country-of-origin effects on product evaluations.” Journal of International Business Studies 13(1): 89-99. Brodowsky, G. H., Tan, J., and Meilich, O. 2004. “Managing country-of-origin choices: competitive advantages and opportunities.” International Marketing Review 13(6): 729-748. Cattin, P., Jolibert, A., and Lohnes, C. 1982. “A cross-cultural study of ‘made in’ concepts.” Journal of International Business Studies 13(3): 131-141. Chao, P. 1993. “Partitioning country of origin effects: consumer evaluations of a hybrid product.” Journal of International Business Studies 24(2): 291-306. Chaudhuri, A. and. Holbrook, M. B. 2001. “The chain of effects from brand trust and brand affect to brand performance: the role of brand loyalty.” Journal of Marketing 65(2):81-93. Chin, W. W. 1998. “Issues and opinions on structural equation modeling.” MIS Quarterly 22 (1):7-16. 45.
(55) Chin, W. W. and Newsted, P. R. 1999. Structural equation modeling analysis with small sample research. In R. R. Hoyle (Ed.), Statistical Strategies for Small Sample Research (pp. 307-341). Thousand Oaks, CA: Sage. Darling, J.R. and Wood, V.R. 1990. “A longitudinal study comparing perceptions of U.S. and Japanese consumer products in a third/neutral country: Finland 1975-1985.” Journal of International Business Studies 21(3): 427-450. Davis, D. F., Golicic, S. L., and Marquardt, A. J. 2008. “Branding a B2B service: Does a brand differentiate a logistics service provider?” Industrial Marketing Management 37(2): 218-227. Dick, A. S. and Basu, K. 1994. “Customer loyalty: toward an integrated conceptual framework.” Journal of the Academy of Marketing Science 22(Spring): 99-113. Dorsch, M. J., Grove, S. J., and Darden, W. R. 2000. “Consumer intentions to use a service category.” Journal of Service Research 14(2): 92-117. Ehrenberg, A.S.C., and Goodhardt, G.J., 2000. New brands: near-instant loyalty. In: 40th Annual Conference of the Professional Market Research Society, Professional Market Research Society, Toronto, Canada. Essoussi L. H. and Merunka, D. 2007. “Consumers' product evaluations in emerging markets: does country of design, country of manufacture, or brand image matter?” International Marketing Review 24(4): 406-426. 46.
(56) Etzel, M.J. and B.J. Walker. 1974. “Advertising dtrategy for foreign products.” Journal of Advertising Research 14(3): 41-44. Fornell, C. and Cha, J. 1994. Partial least squares. In R. P. Bagozzi (Ed.), Advanced Methods of Marketing Research (pp. 52-78). Oxford: Blackwell Fornell, C. and Larcker, D.F. 1981. “Evaluating structural equation models with unobservable variables and measurement errors.” Journal of Marketing Research 18(3): 39-50. Ganesh, J., Arnold, M. J. and Reynolds, K. E. 2000. “Understanding the customer base of service providers: an examination of the difference between switchers and stayers.” Journal of Marketing 64(3): 65-87. Gordon, G.L., Calantone, R.J. and di Benedetto, C.A. 1993. “Brand equity in the business-to-business sector: an exploratory study.” Journal of Product & Brand Management 2(3): 4-16. Grönroos, C. 1984. “A service quality model and its marketing implications.” European Journal of Marketing 18(4): 36-44. Hair, J.F., Anderson. R.E., Tatham, R.L., and Black. W.C. 1992. Multivariate data analysis with readings (3rd Edition). New York: Macmillan. Håkan, H. 1982. International marketing and purchasing of industrial goods. England: John Wiley & Sons Hamzaoui, L. and Merunka, D. 2006. “The impact of country of design and country of 47.
(57) manufacture on consumer perceptions of bi-national products' quality: an empirical model based on the concept of fit.” Journal of Consumer Marketing 23(3): 142-155. Han, C.M. 1988. “The role of consumer patriotism in the choice of domestic versus foreign products.” Journal of Advertising Research 28(3): 25-32. Han, C.M. 1989. “Country image: halo or summary construct?” Journal of Marketing Research 26(2): 222-229. Häubl, G. and Elrod, T. 1999. “The impact of congruity between brand name and country of production on consumers' product quality judgments.” International Journal of Research in Marketing 16(3): 199-215. Herrmann-Pillath, C. 2006. “Cultural species and institutional change in China.” Journal of Economic Issues, 40(3): 539-574. Howard, J. and Sheth, J. 1969. The theory of buyer behavior. New York: John Wiley & Sons Hong, S.-T. and Wyer, R.S.1989. “Effects of country-of-origin and product-attribute information on product evaluation: an information processing perspective.” Journal of Consumer Research 16(2): 175-187. Hong, S.-T. and Wyer, R.S. 1990. “Determinants of product evaluation: effects of the time interval between knowledge of a product’s country of origin and information about its specific attributes.” Journal of Consumer Research 17(3): 277-288. Hui, M. K. and Zhou, L. 2003. “Country-of-manufactures effects for known brands.” 48.
(58) European Journal of Marketing 37(1/2): 133-153. Iyer, G. R. and Kalita, J. K. 1997. “The impact of country-of-origin and country-of-manufacture clues on consumer perceptions of quality and value.” Journal of Global Marketing 11(1):7-28. Jacoby, J., Olsen, J.C. and Haddock, R.A. 1971. “Price, brand name and product composition characteristics as determinants of perceived quality.” Journal of Applied Psychology 55(6): 570-579. Jacoby, J., Szybillo, G., and Busato-Schach, J. 1977. “Information acquisition behavior in brand choice situations.” Journal of Consumer Research 3(4): 209-216. Jacoby, J. and Chestnut, R.W. 1978. Brand loyalty. New York: John Wiley & Sons Jaffe, E.D. and Nebenzah,l I.D. 1984. “Alternative questionnaire formats for country image studies.” Journal of Marketing Research 21(4): 463-471. Janiszewski, C. and Van Osselaer, S.M.J. 2000. “A connectionist model of brand-quality associations.” Journal of Marketing Research, 37(3): 331-350. Johansson, J.K. and Thorelli, H.B. 1985. “International product positioning.” Journal of International Business Studies 16(3): 56-75. Johansson, J.K., Douglas, S.P. and Nonaka, I. 1985. “Assessing the impact of country of origin on product evaluations: a new methodological perspective.” Journal of Marketing Research 22(4): 388-396. 49.
數據
+7
相關文件
we often use least squares to get model parameters in a fitting problem... 7 Least
On Nemo's first day of school, he's captured by a scuba diver Marlin and his new friend Dory a scuba diver.. Marlin and his new friend Dory set off across the ocean to
The remaining positions contain //the rest of the original array elements //the rest of the original array elements.
However, the CRM research was seldom used by the Science Park logistic industry; this research used structural equation modeling (SEM) to research the relationship in CRM,
In order to accurately represent the student's importance and degree of satisfaction towards school service quality, as well as to design a questionnaire survey and
(2) When a student’s SAT score is less than its fitted value of regression equation and scored between 50 and 54, it is more advantageous for him/her to take the College
The purpose of this study is to analyze the status of the emerging fraudulent crime and to conduct a survey research through empirical questionnaires, based on
Using Structural Equation Model to Analyze the Relationships Among the Consciousness, Attitude, and the Related Behavior toward Energy Conservation– A Case Study
