企業績效管理對軟體產業有益嗎?以一軟體公司之績效管理為例 - 政大學術集成
90
0
0
全文
(2) 立. 政 治 大. ‧. ‧ 國. 學. n. er. io. sit. y. Nat. al. Ch. engchi. i n U. v.
(3) Acknowledgement I would like to express my special appreciation and thanks to my advisor Dr Shari S. C. Shang, have been a tremendous mentor for me. I would like to thank her for encouraging my research. Her advice on both research as well as on my career have been priceless. Without her inspiring guidance, I could not accomplish this hard work. I would also like to thank my committee members, Dr Victor Wen-Nan Tsan, and Professor Minder Chen for serving as my committee members even at hardship. I also want to thank them for letting my defence be an enjoyable moment, and for their brilliant comments and suggestions, thanks to them. I would especially like to thank my CPM program team members, cost centre planning. 政 治 大 been there to support me when I recruited candidates and collected data for my EMBA thesis. 立. managers, project managers, and executives in the company I am working for. All of them have. ‧ 國. 學. A special thanks to my family. Words cannot express how grateful I am to my mother-in law, father-in-law, mother, and father for all of the sacrifices that you’ve made on my behalf.. ‧. Their prayer for me was what sustained me thus far; my two vigorous but sensible sons, Ethan. Nat. io. sit. support to me to concentrate on the road to study.. y. Li-Han and Louis Li-Lien. Their maturation other than same age children was one of important. er. I would also like to thank all of my friends, colleagues, and classmates who supported me. al. n. v i n C hYu-Lin Huang whoUspent sleepless nights with and was appreciation to my beloved wife Yako engchi. in writing, and encouraged me to strive towards my goal. At the end I would like express. always my support in the moments when there was no one to answer my queries.. David Wei-Hung Chen June, 2014 Taipei, Taiwan. ii.
(4) Abstract Continuous innovation capability is seen as the engine to grow for knowledge-intensive industry, specifically for software companies. Along with evolvement of information technology, software industry expanded dramatically with blooming tide from personal computers, Internet, to the cloud era to date. Software industry enjoyed high growth over the past four decades, but it has begun to experience weak growth as profit margins continue to drop in recent years. Examining and reviewing the overall corporate performance management processes in order to figure out root causes are becoming equally important as innovation capability to the industry. An effective performance management process which enables efficient budget planning in. 治 政 Driver-based planning and project costing are cornerstones大 of the budget planning process that 立 seamless integration of data spreading out in various is introduced and automated through. response to external challenges and provides timely visibility of operation is thus critical.. ‧ 國. 學. business applications.. The process model has changed standard operation approach from free-to-organize to. ‧. resource management. Extra overheads were developed in order to comply with it. Stakeholders had to embrace new concept and transform their behaviour to adapt.. y. Nat. sit. Any control or performance management is usually viewed as a constraint to innovation. er. io. and an impedance to grow, hence there seems to be a constant trade-off between compliance. al. n. v i n C hcompanies, to commit any corporation, especially for software e n g c h i U a sizable portion of resources to. and innovation about adapting a new budget and planning processes. It becomes a dilemma for. innovation without properly determining a reasonable method to justify such investment.. This paper offers an understanding about the dilemma of striking the right balance between corporate controls and maximising innovation potential of one software company in order to shed some light on the matter through reflecting the deployment of Corporate Performance Management (CPM). The paper also aims to provide findings and summarize them to a practical reference for software companies in terms of effective corporate control and maximisation of innovation potential. Keywords: Corporate Performance Management, Budget Planning, Driver-based Planning, Project Costing, Software Industry. iii.
(5) Content ACKNOWLEDGEMENT ........................................................................................................ II ABSTRACT ............................................................................................................................. III CONTENT ............................................................................................................................... IV LIST OF TABLES ................................................................................................................... VI LIST OF FIGURES .................................................................................................................VII CHAPTER 1 INTRODUCTION ..................................................................................... - 1 1.1 RESEARCH BACKGROUND ....................................................................................... - 1 1.2 RESEARCH OBJECTIVES ........................................................................................... - 4 1.3 RESEARCH PROCESS ................................................................................................ - 5 CHAPTER 2 LITERATURE REVIEW .......................................................................... - 6 2.1 PLANNING PROCESS AUTOMATION .......................................................................... - 6 2.1.1 Corporate Performance Management.......................................................... - 6 2.1.2 Budgeting and Planning Process Model..................................................... - 11 2.2 SOFTWARE INDUSTRY ............................................................................................ - 13 2.2.1 Characteristics of the Software Industry ................................................... - 13 2.2.2 Role of Research and Development in Software Company ...................... - 14 2.2.3 Driver-Based Budget Planning .................................................................. - 17 2.3 CONTROL VS. INNOVATION .................................................................................... - 23 CHAPTER 3 RESEARCH METHODOLOGY ............................................................ - 26 3.1 RESEARCH FRAMEWORK ....................................................................................... - 26 3.2 DATA COLLECTION AND ANALYSIS ........................................................................ - 31 CHAPTER 4 CASE STUDIES AND DATA ANALYSIS ........................................... - 35 4.1 CASE ONE - COMPANY X ....................................................................................... - 35 4.1.1 BACKGROUND ..................................................................................................... - 35 4.1.2 CPM AT COMPANY X ........................................................................................... - 37 4.1.2.1 Current Planning process ............................................................................ - 38 4.1.2.2 Driver-based Model and Project Costing .................................................... - 41 4.1.2.3 IT Readiness for CPM ................................................................................. - 43 4.1.2.4 Behaviour Change ....................................................................................... - 44 4.1.2.5 Post-Implementation Evaluation ................................................................. - 47 4.2 CASE TWO: COMPANY Y ...................................................................................... - 50 4.2.1 BACKGROUND ..................................................................................................... - 50 4.2.2 CPM AT COMPANY Y ........................................................................................... - 52 4.2.2.1 The Driver-Based planning model and Project Costing .............................. - 52 4.2.2.2 Innovation Capability .................................................................................. - 59 CHAPTER 5 DISCUSSION ......................................................................................... - 63 CRITICAL SUCCESSFUL FACTORS TO IMPLEMENT CPM ......................................... - 63 5.1 5.1.1 TOP MANAGEMENT SUPPORTS ............................................................................. - 63 5.1.2 LINKAGE TO STRATEGY PLANNING ....................................................................... - 63 5.1.3 IDENTIFICATION OF KEY BUSINESS DRIVERS ......................................................... - 64 5.1.4 STREAMLINING TO PROJECT COST PLANNING ....................................................... - 64 -. 立. 政 治 大. ‧. ‧ 國. 學. n. er. io. sit. y. Nat. al. Ch. engchi. iv. i n U. v.
(6) 5.1.5 SIMULATION OF BUSINESS CHANGES .................................................................... - 65 5.1.6 INTEGRATION AND INTERCONNECTIVITY AMONG BUSINESS APPLICATIONS ........... - 65 5.1.7 COMPLETE PERFORMANCE MONITORING ............................................................ - 66 5.1.8 CONTINUOUS CHANGE MANAGEMENT ................................................................ - 66 5.2 IMPACT ON INNOVATION CAPABILITY .................................................................... - 67 CHAPTER 6 CONCLUSION ....................................................................................... - 73 6.1 SUMMARY ............................................................................................................. - 73 6.2 MANAGERIAL IMPLICATIONS ................................................................................. - 75 6.3 LIMITATION AND FUTURE WORK ........................................................................... - 76 REFERENCE ...................................................................................................................... - 78 APPENDIX ......................................................................................................................... - 82 -. 立. 政 治 大. ‧. ‧ 國. 學. n. er. io. sit. y. Nat. al. Ch. engchi. v. i n U. v.
(7) List of Tables Research Processes ............................................................................................ - 5 Framework for CPM study.............................................................................. - 30 Data Collection Methodologies ....................................................................... - 34 Comparison of CPM at two cases ................................................................... - 72 -. 立. 政 治 大. 學 ‧. ‧ 國 io. sit. y. Nat. n. al. er. Table 1-1 Table 3-1 Table 3-2 Table 5-1. Ch. engchi. vi. i n U. v.
(8) List of Figures CPM Framework ........................................................................................... - 7 Strategic Financial Planning Initiatives......................................................... - 9 CPM Maturity ............................................................................................. - 10 CPM Processes Model ................................................................................. - 11 General interaction between software R & D ............................................. - 15 Enterprise Budget Planning Model ............................................................. - 18 Driver-based Planning Process in a Software House .................................. - 20 Types of Driver-based planning and budgeting model ............................... - 21 Planning Model Overview of Software Industry ........................................ - 22 Company X Pre-GAAP revenue vs Total Cost in 2012 Q4 ........................ - 36 Cost by category in Company X in 2012 Q4 .............................................. - 37 Current Planning Content of Company X ................................................... - 38 Enterprise Planning Model .......................................................................... - 39 Driver-based Planning by case of Service Cost .......................................... - 41 Project Costing Features.............................................................................. - 42 Acceptance Curve of Change ...................................................................... - 45 Global Training Roadmap of CPM in Company X ..................................... - 46 Budget Planning Framework in Company Y .............................................. - 51 Non-drive based budgeting process ............................................................ - 53 Driver-Based Analysis Model ..................................................................... - 53 Sense & Respond Forecasting Operation Framework ................................ - 54 Forecast and What-If Simulation in Company Y ........................................ - 56 Company Y Integrated Product Development Process ............................... - 59 EBO Formation Process in Company Y ...................................................... - 60 -. 立. 政 治 大. ‧. ‧ 國. 學. io. sit. y. Nat. n. al. er. Figure 2.1 Figure 2.2 Figure 2.3 Figure 2.4 Figure 2.5 Figure 2.6 Figure 2.7 Figure 2.8 Figure 2.9 Figure 4.1 Figure 4.2 Figure 4.3 Figure 4.4 Figure 4.5 Figure 4.6 Figure 4.7 Figure 4.8 Figure 4.9 Figure 4.10 Figure 4.11 Figure 4.12 Figure 4.13 Figure 4.14 Figure 4.15. Ch. engchi. vii. i n U. v.
(9) Chapter 1. Introduction. 1.1 Research Background The successful execution of business strategy is a well-organized requirement for an organization’s survival in the hypercompetitive marketplace. Any business must consider the visibility of operations in a closed-loop model across all facets of the enterprise. Therefore, a simple and systematic approach to monitor and control the execution of strategic goals still eludes them. Corporate Performance Management (CPM), has become an emerged domain in contemporary management field (Frolick & Ariyachandra, 2006). It enables an organization to. 政 治 大 Traditionally, CPM consists of a set of management and analytic processes, supported by 立 technology that enables businesses to define strategic goals and then measure and manage effectively monitor, control, and manage the implementation of strategic initiatives.. ‧ 國. 學. performance against those goals. Core CPM processes include financial planning, operational planning, business modelling, consolidation and reporting, analysis, and monitoring of key. ‧. performance indicators linked to strategy (Business Performance Management, n.d.). Based on the mission and vision of an organization, different strategic needs may drive how business. y. Nat. sit. planning and budget are leveraged and promoted within an organization. For instance, a global. al. er. io. professional consulting firm may view the need to have business budgeting much differently. v. n. than an electronics manufacturing service company with operations throughout the Great China.. Ch. engchi. i n U. Company X, a well-known computer software company with over one-billion US dollars revenue, that was founded in Bay Area, United State, has enjoyed high growth for 20 years. But it has experienced slow-downs in growth with profit margin steadily decreasing in recent years. Board of Executives has decided to examine and review overall corporate performance management processes in order to determine what and where root causes are. One of the obvious evidence indicated in the financial reports clearly states that Operating Expense (OPEX) and Capital Expenditure (CAPEX) have increased and eroded profit. However, the details of expenditure are still not clearly broken-down. Board of Executives could not ascertain in a timely manner whether the expenditure was valid investment with justifiable returns. Most importantly, they are not able to connect the corporate strategic plan with operating results. An effective management process to collect detail-driven operational data in real-time - 1 -.
(10) becomes critical to provide visibility of business to Executives, and a closed-loop process model with automatic application was therefore developed. Although seamless project and change management was applied, expected resistance within organization still emerged during the deployment. The process model has changed operation to manage resources in Company X for 20 years. Many back-office operations have been modified to adapt to the new process model and employees have to learn to operate new application to monitor their resource consumption. Extra overheads have incurred in order to comply with it in the organization. Financial Management application implementation will most likely have significant process design implications. A strong change management process is critical in a financial management project (Van Decker, 2013). Development of Company X over the past 20 years is the microcosm of the software. 政 治 大. industry. A garage-founded computer software company that successfully evolved into the. 立. industry leader by relying on continuous creativities and keen observation of changes and. ‧ 國. 學. opportunities in a competitive market. Although the scale of business today has grown more than one thousand times, Company X would like to keep the flexibility as the competitive advantage to confront more and more challenges externally, but all are derived by continuous. ‧. innovation produced by the research & development (R&D) staffs. Any control or management. y. Nat. is usually seen as the killer of the innovation and roadblock to grow, hence the notion of the. er. io. al. sit. contradiction between compliance and innovation.. n. Despite the value of budget and planning in helping to provide better visibility to. Ch. i n U. v. Executives board of Company X to examine how the execution is to align with the strategic. engchi. direction planned in the last fiscal year, feedback continues to surface that R&D staffs adapt to new process model reluctantly in their operation. R&D fears that over-control on resource utilization may interfere with innovation, the driving force behind Company X’s growth. It may be a general concern in the whole software industry since innovation is acknowledged as the key driver to developing outstanding software products or services. It becomes a dilemma for any corporation, especially for software companies, to commit a sizable portion of resources to innovation without properly determining a reasonable method to justify such investment. This paper therefore offers an understanding about the dilemma of controlling and innovation capability of one software Company X in order to shed some light on the matter through reflecting the deployment of Corporate Performance Management (CPM) ever experienced. Because such dilemma often happens to any Company X in software industry, - 2 -.
(11) the paper also aims to provide findings and summarize them to a practical reference to software companies, and balance between controlling and innovation may be therefore concluded as practical approach for any general business.. 立. 政 治 大. ‧. ‧ 國. 學. n. er. io. sit. y. Nat. al. Ch. engchi. - 3 -. i n U. v.
(12) 1.2 Research Objectives The objective of this research is to understand the characteristics and development of corporate planning and budget process model and application in the software industry. This information is the key factor for any software company confronted with challenges to grow. The well-developed process model and associated application are expected to help the organisation to manage OPEX and CAPEX effectively. However, the well-designed process model is seemed to impact the R&D innovation capability, which is known as the main engine to growth for the software companies. Therefore, the key questions asked in this paper will not only be “How can a software company apply a budgeting and planning process model to manage resource utilization. 政 治 大 really matter to the growth of a software company?” 立. effectively?”, but also “Do budgeting and planning process model and its associated automation. ‧ 國. 學. To answer these questions, it is essential to develop an understanding of characteristics of the budgeting and planning process model by taking the case of Company X, a leading software. ‧. company in the industry. After understanding the characteristics and deployment history of process model and application, feedback from real users, including R&D staffs and Executives,. sit. y. Nat. will also provide different views on how Company X perceives this model and what impact they have experienced. Next, this paper uses one other case study with known characteristics. io. n. al. er. of budgeting and planning process in another well-known innovative company to determine an. i n U. optimal balance between control and innovation in the industry.. Ch. engchi. - 4 -. v.
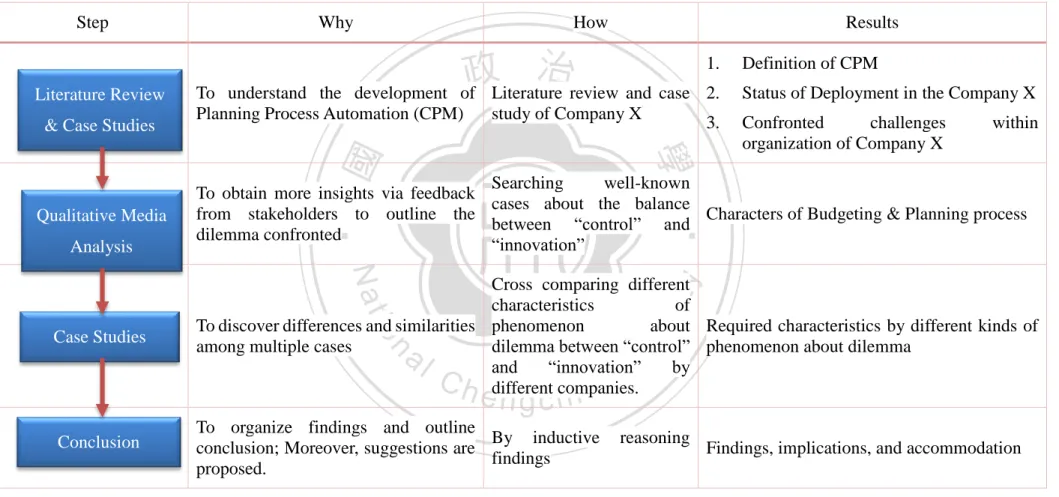
(13) 1.3 Research Process The processes of this research is illustrated in the Table 1 below:. Literature Review & Case Studies. 治 政 大and case of Literature review. To understand the development Planning Process Automation (CPM). 立. Results. study of Company X. 2.. Status of Deployment in the Company X. 3.. Confronted challenges organization of Company X. within. y. n. al. er. sit. Cross comparing different characteristics of To discover differences and similarities phenomenon about Required characteristics by different kinds of among multiple cases dilemma between “control” phenomenon about dilemma and “innovation” by different companies.. io. Conclusion. Definition of CPM. Searching well-known To obtain more insights via feedback cases about the balance from stakeholders to outline the Characters of Budgeting & Planning process between “control” and dilemma confronted “innovation”. Nat. Case Studies. 1.. ‧. Analysis. How. 學. Qualitative Media. Why. ‧ 國. Step. Ch. engchi. i n U. To organize findings and outline By inductive conclusion; Moreover, suggestions are findings proposed. Table 1-1. v. reasoning. Research Processes. - 5 -. Findings, implications, and accommodation.
(14) Chapter 2. Literature Review. 2.1 Planning Process Automation 2.1.1. Corporate Performance Management Wikipedia defines “Corporate Performance Management” (CPM) is a set of management. and analytic processes that enables the management of an organization’s performance to achieve one or more pre-selected goals (Business Performance Management, n.d.). Gartner defines “Performance Management” as “the combination of management methodologies, metrics, and technologies that enable users to define, monitor and optimize results and. 政 治 大 objectives across multiple organization levels (personal, process, group, departmental, 立 corporate or business ecosystem).”. Therefore, we can see CPM possesses a broad approach. outcomes to achieve personal or department objectives, while enabling alignment with strategic. ‧ 國. 學. that includes strong linkages between operational and strategic feedbacks loops and a crossfunctional version. This is especially important for strategic CPM efforts that are led by. ‧. corporate finance but extend beyond the finance department. These include initiatives requiring more widespread participation and having organization wide impact, such as planning,. y. Nat. n. al. er. io. Chandler, 2014).. sit. budgeting, profitability modelling and strategy management (Iervolino, Van Decker, &. CPM has two main objectives: . Ch. engchi. i n U. v. It supports more-efficient financial processes and provides related control and transparency, which are tactical goals.. . It enables competitive advantage by providing critical performance management capabilities, which is its strategic goals. Both objectives result in greater organizational agility and more insightful financial. analyses. CPM involves an array of integrated operational and analytical processes that accomplish two sequential tasks. First, it facilitates the creation of strategic goals by stipulating specific objectives and key performance indicators that are meaningful to the organization. Second, it supports the subsequent management of the performance to those goals. The objectives and indicators then associated with operational metrics and linked to performance - 6 -.
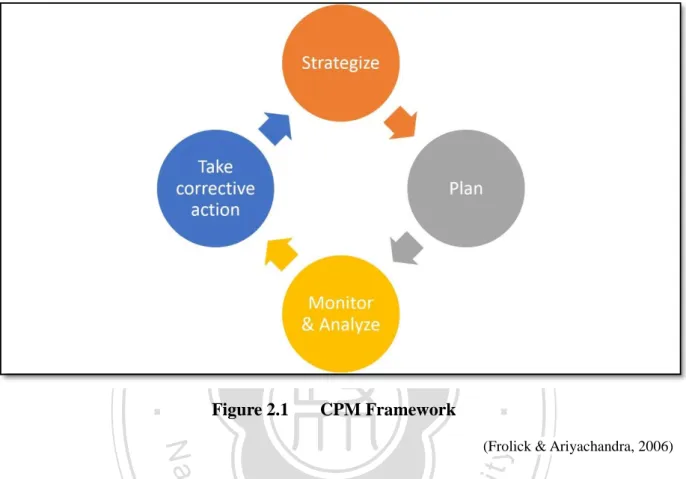
(15) incentives, which lead to effective strategy execution through the organization. A framework composed of 4 core processes (see Figure 2.1) is therefore illustrated. These 4 key steps are the foundation for designing, implementing, and managing CPM (Frolick & Ariyachandra, 2006).. 立. 政 治 大. CPM Framework. ‧. ‧ 國. 學. Figure 2.1. sit. y. Nat. (Frolick & Ariyachandra, 2006). er. io. The first two steps represent the formulation of business strategy, and the last two steps. al. v i n captures business strategy, which is then aligned business operations. C htranslated into strategically U i e h n c In the planning step, it allows managers withingdifferent functional units to set goals, design n. define how to modify and execute strategy. These 4 core processes form a closed loop that. projects, and develop budgets to support corporate strategy. A primary outcome of the planning process is a detailed plan or budget that specifies how resources will be allocated to carry out the organization’s goals. Each business unit to maintain an enterprise wide focus during the planning process and heed the influence of each unit’s plans for cross-functional operations. Units must work together in areas where they overlap to ensure that individual plans do not contradict each other. Key performance metrics enable functional units to uphold a corporate wide focus and avoid overlap during planning (Gregory, 2004). The influence and benefits of a CPM implementation become more visible in the step of monitoring and analysing. This process facilitates constant monitoring of performance results versus benchmark metrics. By providing a mix of operational and strategic reporting and - 7 -.
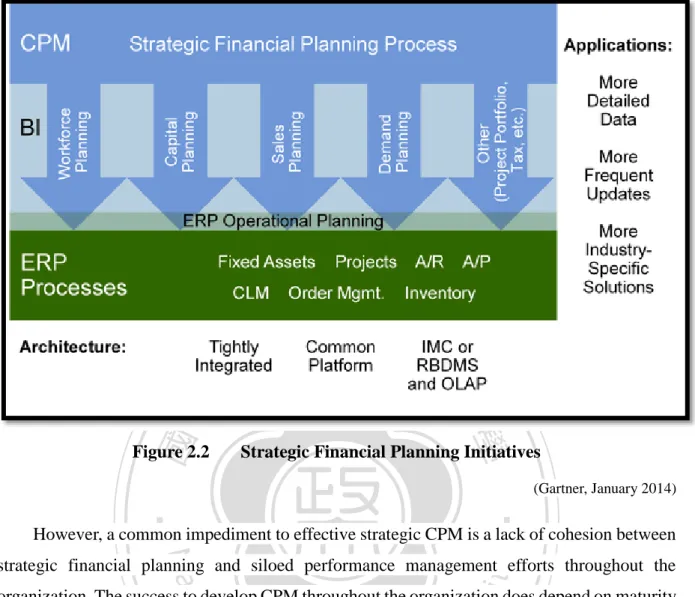
(16) analytics to all levels of the organization in order to evaluate individual and business unit performance. Additionally, it enables users to drill down to additional detailed information so that they can take appropriate action. Both Business Intelligence infrastructure and analytics support the course of action prescribed in this process. Historic and real-time data in multiple transaction processing systems are consolidated using data warehouse technologies. Applications that enable simple query and multidimensional data analysis provide a means of analysing performance and comparing measures with actual performance (White, 2005). Company X Corporate Performance Management (CPM) project aims to deliver such application facilitate visibility of resource utilization to executives. In summary, CPM bridges the gap between strategy and execution. With 4 steps above, the framework moves everyone in the organization in the same direction. It enables the. 政 治 大. organization to focus on the few core processes that drive business value. As a result, the. 立. organization can disregard the many processes that merely generate activity and do not. ‧ 國. 學. contribute to the long-term health of the company (Frolick & Ariyachandra, 2006). Company X is a typical example eager to understand what its core competitive processes is through implementation of CPM, the realization of CPM.. ‧. More and more corporates pursuing greater strategic CPM maturity adopt an approach that. y. Nat. sit. extends beyond finance to develop greater performance management capabilities, such as. al. er. io. workforce and sales planning as shown in figure 2.2. Although CPM’s role in enabling a broader. n. approach to performance management is firmly established, it also depends heavily on. Ch. i n U. v. organizational, cultural and technological factors (Iervolino, 2012).. engchi. - 8 -.
(17) 立. 政 治 大. ‧ 國. 學. Figure 2.2. Strategic Financial Planning Initiatives (Gartner, January 2014). ‧. However, a common impediment to effective strategic CPM is a lack of cohesion between. y. Nat. sit. strategic financial planning and siloed performance management efforts throughout the. al. er. io. organization. The success to develop CPM throughout the organization does depend on maturity. n. of the enterprise. Gartner hence defines a maturity model as shown in figure 2.3, which focuses. Ch. i n U. v. on the strategic needs of senior executives to define a model that encompasses planning and. engchi. budgeting, strategy management and profitability modelling & optimization (PM&O). These functions help manage performance at the corporate level and create the foundation for an enterprise wide approach to performance management. They are key in linking strategy to operational execution and identifying the drivers of profitability to help organizations pursue profitable revenue growth (Iervolino, 2012).. - 9 -.
(18) 立. 政 治 大. ‧. io. sit. y. CPM Maturity. al. (Gartner, October 2012). er. ‧ 國. 學. Nat. Figure 2.3. n. Level 1 describes an organization performing CPM processes in a highly inefficient. Ch. i n U. v. manner. The organization typically involves the use of only spreadsheets or combination of. engchi. spreadsheets and home-grown or outdated package application to consolidate financial results, manage the budgeting process and provide rudimentary financial analytics. Finance personnel are accustomed to producing analytics themselves using spreadsheets. Most of reporting systems are based on siloed and potentially inconsistent data extracted by finance from source systems into spreadsheets and local database and contain a large number of errors. Level 2 describes an organization that has implemented one or more CPM applications to address tasks of consolidation and close, financial reporting, budgeting, or planning and budgeting. Efficiency and accuracy have increased as a result of implementing these applications; however, they largely support siloed processes. Spreadsheets tend to be used for regular analysis and report tasks, which would be more effectively handled within the existing CPM applications. There are numerous processes within the financial close that are unsupported - 10 -.
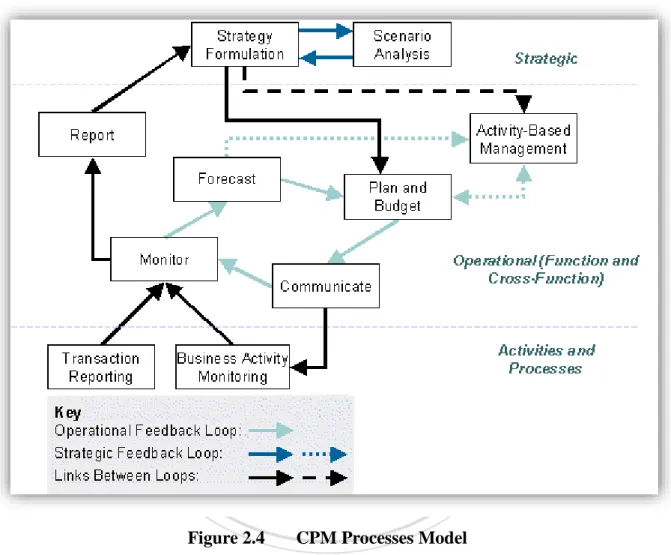
(19) by CPM applications, such as disclosure management, reconciliation management, intercompany activity management etc. (Iervolino, 2012). Company X organization was positioned in-between Level 1 and 2 – tending to be more opportunistic, but still possessing legacy and manual processes in regions and in unaware manner. 2.1.2. Budgeting and Planning Process Model. 政 治 大. 立. ‧. ‧ 國. 學. n. er. io. sit. y. Nat. al. Ch. Figure 2.4. engchi. i n U. v. CPM Processes Model (Gartner Research). Gartner defines 3 “feedback loops” that encompass the main CPM processes as shown on figure 2.4. The strategy loop typically operates on an annual, semi-annual, or quarterly cycle. The strategic feedback loop focuses on strategy formulation. The approach adopted vary, but strategy formulation should be considered to be a driving force in designing a CPM solution. Strategy formulation drives the management cycle through its input into planning and budgeting. Operational feedback loop typically operates on a daily, weekly, or monthly cycle and the activity or processes loop operates on a real-time (or near real-time) to daily basis. Planning - 11 -.
(20) and Budgeting is the core process of it. It encompasses developing operational budgets that include targets defined in the strategy formulation process. Both a “top down” and “bottom up” approach should be considered, with the process supporting realignment where these approaches indicate different outcomes, for example, either feeding back to the strategy formulation processes or facilitating a revised operational budget. This process must support a functional perspective, such as sales and marketing or human resources, as well as a crossfunctional view. This is key to avoiding “siloed” planning and budgeting, where finance may create a financial plan that is not easily reconciled with operational plans in other functional areas, such as sales and marketing (Rayner, Buytendijk, & Geishecker, 2002). The operational feedback loop must be linked to the strategic feedback loop. Furthermore, the report process covers the aggregated management reporting that is an input to the strategy. 政 治 大. formulation process. This must provide information on either an on-demand, for example, a. 立. daily management update, or an event-driven basis, for example, as the result of a significant. ‧ 國. 學. underachievement of an operational target. This information would be included in the strategy formulation process to allow executives to track the success (or otherwise) of strategic initiatives.. ‧. Activity-based management (ABM) is also an increasingly important part of any CPM. y. Nat. sit. solution. It includes activity-based costing to support calculation of key profitability metrics. al. er. io. (such as customer profitability), but also supports a resource and activity-based view of. n. operations. This view enables managers to plan and budget using business-oriented models. Ch. i n U. v. rather than financial models. It generates important data for the strategy formulation process. engchi. for many enterprises – for example, financial service providers must have a multidimensional view of profitability to build effective customer strategies (Collins, 2003). Activities and Processes loop is where day-to-day activities are executed by employees. Feedback from these activities and processes are crucial inputs for the operational feedback loop. The core process, transaction reporting monitors daily activities, typically in enterprise applications such as Enterprise Resource Planning (ERP) or Customer Relationship Management (CRM) systems. It is basic Business Intelligence (BI) – users consume information for basic awareness and simple analyses or comparisons. Typically through query and reporting tools deployed in conjunction with a data warehouse or operational data store, or with reporting capabilities that access transactional system directly (Hostmann & Strange, 2002). - 12 -.
(21) 2.2 Software Industry 2.2.1. Characteristics of the Software Industry The software industry includes business for development, maintenance, and publication of. software that are using different business models, mainly either “license/maintenance based” (on-premises) or “Cloud based” (such as SaaS [Software-as-a-Service], PaaS [Platform-as-aService], IaaS [Infrastructure-as-a-Service], etc.). The industry also includes software services, such as training, documentation, and consulting. In the early 1960s, the software industry expanded almost immediately after computer were first sold in mass-produced qualities. Universities, government, and business customers. 政 治 大. created a demand of software. Many of these programs were written in-house by full-time staff programmers. The industry expanded greatly with the rise of personal computer (PC) in the. 立. mid-1970s, which brought computing to the desktop of the office worker. In the following years,. ‧ 國. 學. it also created a growing market for games, applications, and utilities (Software Industry, 2012). Company X rose in that era, particularly embraced a boom in information security domain after. ‧. when internet tide swept across the whole world since mid-90s.. y. Nat. In the early years of the 21st century, the other successful business model has arisen for. sit. hosted software, named software-as-a-service (SaaS). From the point of view of producers of. al. er. io. some proprietary software, SaaS reduces the concerns about unauthorized copying, since it can. v. n. only be accessed through the web, and by definition no client software is loaded onto the end. Ch. user’s PC (Software Industry, 2012).. engchi. i n U. Software industry belongs to a typical knowledge economy, and even network economy with explosive increase of Internet in 1990s. With blooming of Internet, software industry benefits from network effect, because software can be shared instantly and inexpensively on a global scale. Commerce is being accelerated by the digital and network revolutions and the role of commerce is to both exploit and absorb these shocks (Brand, 1999). In a network economy, the value is created and shared by all members of a network rather than by individual companies and that economics of scale stem from the size of the network – not the enterprise (Kelly, 1998). Similarly, because value flows from connectivity, an open system is preferable to a close system because the former typically have more nodes. It also indicates that such networks are blurring the boundaries between a company and its environment (Boyett & Boyett, 2001). The larger the network, the greater its value and desirability. In a networked economy, success begets more - 13 -.
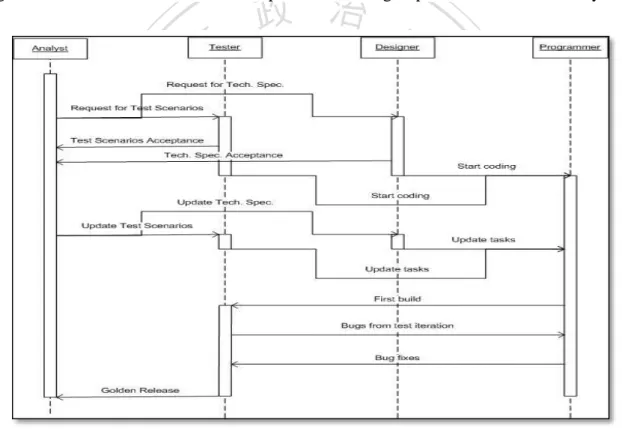
(22) success. Under an opened and global environment without boundaries, malicious threats through Internet connection becomes a super emerging market – all digital citizens are threatened by it in every format, such as computer virus infection, hacker attacking, and so on. Company X was hence growing rapidly in the surroundings. In the late 1990s, the computer software industry expands dramatically by following to the dot-com business models with blooming of the Internet technology. These firms operated under the belief that when a new market comes into being which contains strong network effects, firms should care more about growing their market share than about becoming profitable. This was believed because market share will determine which firm can set technical and marketing standards and thus determine the basis of future competition.. 政 治 大 and network: It is not of scarcity, but rather of abundance. Information and knowledge can be 立 shared, and grow through application. Human capital – competencies – are a key component of Contemporary software industry is obviously a combination of economics of knowledge. ‧ 國. 學. value in a software house, yet few companies report competency levels in annual reports. In contrast, downsizing is often seen as a positive "cost cutting" measure. The entire cost to run a. ‧. software house is relative lower than manufactures millions times is a well-known fact, especially interlocking with driving forces of network economy, such globalization achieved. y. Nat. sit. by the Internet connection and IT. The production and distribution of software which in turn,. al. er. io. results in collective intelligence. Software becomes much easier to access or apply as a result. n. of networked databases. Moreover, with computer networking and connectivity, developments. Ch. i n U. v. such as the Internet bring the “global village” ever nearer. Crowdsourcing through the Internet. engchi. concept is popular today to develop software and effectively lower down the cost. As a result, software goods and services can be developed, bought, sold, and in many cases even delivered over electronic networks with low cost (mainly is one-time human intelligence) but creates huge returns over connected media rapidly. 2.2.2. Role of Research and Development (R&D) in Software Company Knowledge economy stage today has been marked by the upheavals in technological. innovations and the globally competitive need for innovation with new products and processes that develop from the research community (e.g. R&D factors, universities, labs, educational institutes). In the knowledge economy, the specialized labour force in characterized as computer literate and well-trained in handling data, developing algorithms and simulated models, and - 14 -.
(23) innovating on processes and systems. Today’s economy is far more dynamic and that comparative advantage is less relevant than competitive advantage which rests on “making more productive use of inputs, which requires continual innovation” (Porter, 1998). Because of the nature of software and the rapidity of technical development, continual R&D investment is critical. In the most of time, R&D plays the most critical role to grow in software industry by developing innovative products or services with systematically project management methodologies. In software development, regardless waterfall or agile model used, the cycle to develop a software product always consist of at least 3 stages – (1) Design: including both the business and technical specification, (2) Coding: the development itself, and (3) Testing: the quality management. The Unified Modelling Language (UML) sequence diagram of interaction between different parties in R&D group of the software industry. 立. 政 治 大. ‧. ‧ 國. 學. n. er. io. sit. y. Nat. al. Figure 2.5. Ch. engchi. i n U. v. General interaction between software R & D (Wikipedia, 2007). Basically, not all software R&D cost are categorized as expense. “Does software represent an asset and should that asset be on the balance sheet (i.e. expensed)?” has been a core question in software accounting domain since 1980s. For example, within six-phase hardware and software development process in Company Y, certain activities are expensed or capitalized and not the entire process. In the phase – planning, architecture, specifications, and design implementation are expensed and implementation and support are capitalized. Company Y sees - 15 -.
(24) software development as a process and holds that feasibility phases of the process should be expensed (Pridemore, 1983). It is quite understandable the accounting recognition of Company Y does because of its core business is IT consulting services today. For the rest of software houses, it may be contrary to Company Y totally since the software development is the core business, such as Microsoft or SAP. Regardless what software products or services are provided, expense is definitely brought during software R&D in most of company from either business or accounting perspective. R&D in software houses are delivering products or services through effective project management in most cases. “Project management” as defined in this study includes the activities of screening, selecting, evaluating, budgeting, scheduling, and controlling R&D projects. This emphasis was not unfounded, since most R&D organizations, regardless of their. 政 治 大. structure and motivation, conduct many resource allocation and related management activities. 立. for the achievement of specific goals on a project-by-project basis (Liberatore & Titus, 1983).. ‧ 國. 學. In order words, we can assume to have good visibility to understand the expenses of R&D in software houses as long as understanding what cost generated from every R&D projects.. ‧. Firms usually do not specify fixed R&D budget size, but decide on projects one at a time. One research investigated the R&D evaluation and control procedures used in British industry. y. Nat. sit. and found: (1) nearly all organizations use at least one standard financial method for project. al. er. io. evaluation; (2) about one-third used mathematical models, and/or weighted checklists or project. n. ranking indices as part of their project assessment procedure; and (3) only few of them did not. Ch. i n U. v. use any scheduling techniques. It also found several organizations expressed dissatisfaction. engchi. with available resource allocation and scheduling procedures, and discontinued their use (Allen, 1970). The other empirical study was conduct to study the R&D evaluation, selection and control procedures used in US industrial forms. Heavy use of financial methods for project evaluation; however, formal quantitative methods for selecting projects were not widely used. Since 1970s, the growth in available quantitative methods was coupled with the advances in computer technology for data acquisition, retrieval and analysis (Liberatore & Titus, 1983). With aid of computer technology, R&D projects are able to be controlled and managed in systematic but efficient manner, especially Multi-national Corporation with distributed R&D departments. Simple and interactive systems for resource allocation and multi-project tracking and control is welcomed by R&D project stakeholders. It does underscore the need for such a system to have - 16 -.
(25) up-to-date data, and the ability to obtain information concerning project costs and milestone progress with a modicum of computer-related experience and effort. The research also discovered any formalized budgeting system which evaluate the cost and benefit trade-offs over the set of available projects is not utilized. Many use the standard project control sheets. These documents are used to help justify the proposed budget and allow tracking of costs and milestones. Because of the diversity of project types, resources and criteria within the budgeting unit, math programming or financial model are generally not used of the budgeting and resource allocation process. Gantt charts are principally used for project control, and techniques and methods develop have made some inroads into R&D project management, such as Program Evaluation Review Technique/Critical Path Method (PERT/CRM) (Liberatore & Titus, 1983). With evolution of IT technology, sophisticated R&D project management. 政 治 大. becomes achievable. Company X hence implemented a completed planning and controlling. 立. system to manage project management. It will be described in the later section in detail with. ‧ 國. 2.2.3. 學. impacts to R&D projects, seen as core drivers to grow of Company X business. Driver-Based Budget Planning. ‧. As mentioned in previous sessions, in the majority of organizations, the budget is the most. sit. y. Nat. important tool used to control performance. Executives might have spent time off-site working at clarifying their strategies. The resulting strategies might be very sound and take account of. io. n. al. er. all the likely external and internal issues that impact the organization’s financial performance. i n U. v. both in the short term and in the foreseeable future. It might have been translated into a success. Ch. engchi. map with appropriate measures and targets being cascaded down to individual managers. It is the budgeting process that takes precedent. Figure 2.6 shows detailed enterprise-wide budget planning process by different layers and components.. - 17 -.
(26) 政 治 大. 立 Enterprise Budget Planning Model. Figure 2.6. ‧ 國. 學. (Trend Micro Inc. & Deloitte Touche Tohmatsu Ltd., 2011). ‧. However, the budgeting process has received an increasing amount of criticism in recent years. It takes too long and therefore costs too much. Because of the rate of change in many. Nat. sit. y. markets, the annual budget is out of date almost before it is completed. That is why the ability. io. er. to re-forecast more frequently is of such importance. Organizations need to routinely reassess the future and realign their operational plan and resources accordingly.. al. n. v i n C by objectives (MBO)” With the rise of “management h e n g c h i U and individual accountability,. accounting results such as income, return on capital employed and return on investment cam to. be used as targets for everyone from board members right down to departmental managers. This led to the budget becoming a critical determinant of many people’s benefit. Linking rewards to relative measures such as improvements over the previous year or outperforming industry peers will encourage organizations to become more dynamic and responsive to internal and exchange changes and to continually seek out opportunities that create value. However, unless the integration of planning and budgeting into a seamless process, organization are unlikely to be able to re-forecast with the frequency they desire, no matter how they want to reward their staff. The traditional budgeting process is hierarchical and focuses on collecting and consolidating individual contributions to produce the enterprise profit and loss account. But when managers generate their departmental budgets, they are modelling the operational drivers - 18 -.
(27) and causal relationships that run horizontally across an organization. When asked to produce a budget or a re-forecast, the managers’ first concern is that the department upstream of them provides them with a reliable forecast of future demand. In fact, until they have received this, they cannot start their own departmental planning. Driver-based budgeting uses both non-financial and financial driver data to model line item expense. Drivers will differ by industry and even by company. It is a piece of non-financial or financial data which when changed directly impacts either revenues or expenses, ultimately changing the forecast profit and loss account, cash flow and balance sheet. The term “driver” is used for assigning expenses to activities costs to cost objects in Activity-based cost (ABC). Many of the drivers an organization would use for planning and. 政 治 大 be important metrics to monitor in CPM. Since the definition limits drivers to those things, 立 which directly impact either revenues or expense, they can be included in a rule formula that. budgeting are identical to those they use for cost assignments in ABC. Many drivers would also. ‧ 國. 學. will directly calculate either a revenue figure or a line item expense.. ‧. There are many different types of drivers that are used in planning and budgeting. These including the following:. y. Nat. Quantitative measures of demand: including both the forecast level of demand for the. sit. . er. io. products or services sold customers and the level of demand faced by individual. al. v i n C htelephone calls, theUnumber of active customers, etc. product, the number of inbound engchi n. departments. For example: Market size and market share, the number of sales units of a. . Consumption rates, productivity rates or cycle times: measuring the amount of resource required to satisfy demand or produce a unit of output. For example: the average duration of a call; the amount of space needed by each full-time equivalent, etc.. . Unit resource cost: the average cost of a unit of resource during a period. For example: the cost of a litre of fuel, the average salary cost of a particular grade of staff, etc.. . Unit selling prices: the average selling price of a product or service. For example: the average premium of a particular type of insurance policy, the anticipated fee for each consulting engagement, the anticipated selling price for a particular product, etc.. Some drivers are only important in one department. For instance, the drivers involved in - 19 -.
(28) forecasting staffing requirements and salary expenses in a contact centre are only important to the department manager and their superior. In a driver-based budgeting model, this will be a simple rule that restricted to this department, but applies to all periods and versions. Many drivers run horizontally across organizations, spanning departments just like the business processes they are part of. The output of one department become the input of other departments downstream from them. In certain instances, this may be a one-to-one relationship. In other instances, such as when a new sales forecast is produced, it will be a one-to-many relationship with virtually every department needing to re-forecast. The following figure 2.7 takes technical support service cost as an example and shows an inter-departmental driver-based planning process to a software house.. 立. 政 治 大. ‧. ‧ 國. 學. n. er. io. sit. y. Nat. al. Figure 2.7. Ch. engchi. i n U. v. Driver-based Planning Process in a Software House (Trend Micro Inc. & Deloitte Touche Tohmatsu Ltd., 2011). The rule needed to do this is no more complex than that needed for an intra-department rule. It is just that the output of the rule becomes the input for a number of other departments. What is important is that these downstream departments are quickly alerted that they need to re-forecast themselves and that they have immediate access to the new data. Most driver-based planning and budgeting models start from some measure of demand. In consumer markets, this might be a market-based model with market size, market growth and - 20 -.
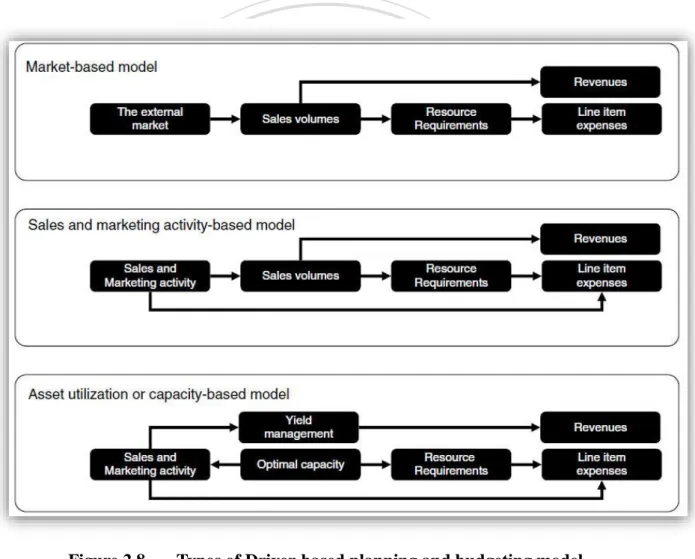
(29) market share being the drivers of sales volumes and demand across the entire model. Organization competing in business-to-business markets might start by using the amount of sales and marketing activity as the primary driver of demand for their model. However, in certain manufacturing and supply industries, plant and assets have to be in continuous use around the clock if the organization is to be commercially viable. In such situations, production capacity has to be the primary input any driver-based model with most other resources being driven by the need to produce and sell the output for the highest possible price. Most will have iteratively worked out the way their business works and will already be using an appropriate methodology to model revenues and resource requirements. All finance need to do is integrate these models into the budgeting process.. 立. 政 治 大. ‧. ‧ 國. 學. n. er. io. sit. y. Nat. al. Figure 2.8. Ch. engchi. i n U. v. Types of Driver-based planning and budgeting model (Barrett, 2007). Knowing that the expenses for a responsibility centre are above or below plan is incomplete information. Until we know more we cannot take any action. However, if we have access to information about the level of demand facing that responsibility centre during the - 21 -.
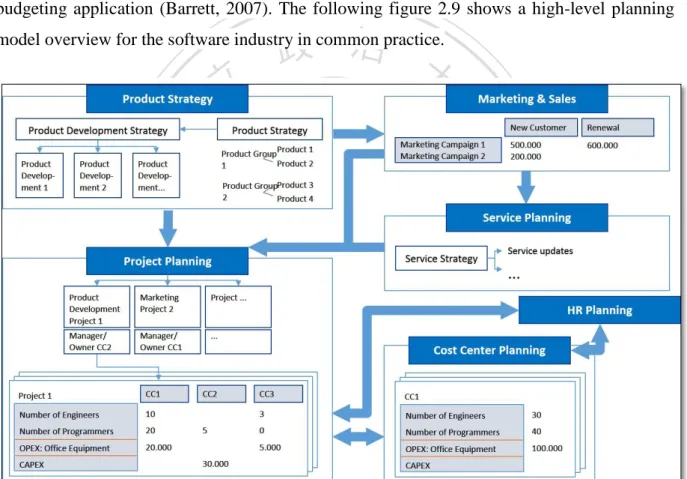
(30) period, the amount of resource required to satisfy that level of demand and the amount of resource actually provided, we know exactly what action to take. We can immediately see where excess capacity exists and take action to bring it into line with what is actually provided, we know exactly what action to take. We can immediately see where excess capacity exists and take action to bring it into line with what is actually required. At a time when profitable revenue growth is increasingly difficult to achieve, keeping resources tightly aligned with trading is a problem common to many sectors. Sometimes called “consumption-based” planning and budgeting or “resource consumption analysis”, the above approach demonstrates the key characteristics of driver-based planning and budgeting: it is all about building a dynamic budget where drivers are used to model revenues and line item expenses within the planning and budgeting application (Barrett, 2007). The following figure 2.9 shows a high-level planning. 政 治 大. model overview for the software industry in common practice.. 立. ‧. ‧ 國. 學. n. er. io. sit. y. Nat. al. Figure 2.9. Ch. engchi. i n U. v. Planning Model Overview of Software Industry (Trend Micro Inc. & Deloitte Touche Tohmatsu Ltd., 2011). - 22 -.
(31) 2.3 Control vs. Innovation Much organization theory argues that efficiency requires bureaucracy, that bureaucracy impedes flexibility, and that organizations therefore confront a trade-off between efficiency and flexibility. Managers must choose between organization designs suited to routine, repetitive tasks and those suited to nonroutine, innovative tasks. However, all forms of flexibility present a common challenges: efficiency requires a bureaucratic form of organization with high levels of standardization, formalization, specialization, hierarchy, and staffs, but these features of bureaucracy impede the fluid process of mutual adjustment required for flexibility; and organizations therefore confront a trade-off between efficiency and flexibility (Knott, 1996) (Kurke, 1988). Specifically, organizations should adopt a mechanistic form if their task is. 政 治 大 task is complex and changing 立 and their goal is therefore flexibility (Burns & Stalker, 1961). simple and stable and their goal is efficiency, and they should adopt an organic form if their. Organizational theory presents a string of contrasts reflecting this mechanistic/organic polarity:. ‧ 國. 學. machine bureaucracies vs. adhocracies (Mintzberg, 1979); adaptive learning based on formal rules and hierarchical controls versus generative learning relying on shared values, teams, and. ‧. lateral communication (McGill, Slocum, & Lei, 1992).. y. Nat. sit. The trade-off view has been echoed in other disciplines. Standard economic theory. al. er. io. postulates a trade-off between flexibility and average cost. However, strategy researchers argue. n. that firms must choose between a strategy of dynamic effectiveness through flexibility and static. Ch. i n U. v. efficiency through more rigid discipline. In general the optimal choice is at one end or the other. engchi. of the spectrum, since a firm pursuing both goals simultaneously would have to mix organizational elements appropriate to each strategy and thus lose the benefit of complementarities that typically obtain between the various elements of each type of organization. They would thus be “stuck in the middle” (Porter, 1980). Hypercompetitive environment force firms to compete on several dimensions at once, and flexible technology enable firms to shift the trade-off curve just as quickly as they could move to a different point on the existing trade-off curve. While the trade-off can be shifted, much of what we observe when firms make notable improvement in several dimensions at once represents catching up to best practice (Skinner, 1985); (Hayes & Gary, 1996); (Clark, 1996). Pushing the best practice frontier is a far more difficult task, since trade-offs are inevitable when organizations must make difficult-to-reserve commitments in plants, equipment, and - 23 -.
(32) capabilities in their implementation of a given strategy. The challenge of simultaneously performing both routine and nonrountine tasks has been explored in a number of studies of the “ambidextrous” organization. 4 kinds of major mechanism to be leveraged to shift the trade-off. Metarountines systematize the creative process. Job enrichment enables workers to become more innovative and flexible even in the course of their routine tasks. Job rotation differentiates roles for dealing with the two kinds tasks, thus allowing workers time to focus on each. And partitioning differentiates structures for dealing with each kind of role, and the resulting specialization permits subunits to refine their capabilities in each activity, and permits routine and nonroutine activities to be carried out simultaneously in parallel (Adler, Goldoftas, & Levine, 1999).. 政 治 大 to routinize the innovation process at least to some extent. Flexible computer-based automation 立 reduces the cost of high product variety (Adler P. S., 1988). Strategies such as mass. Large corporations had a competitive advantage over smaller firms because they were able. ‧ 國. 學. customization that are based on economies of scope and economies of substitution rely on metaroutinization as effected through greater product modularity (specifying standardized. ‧. interfaces), parts standardization, or software-based process automation. The implication here is that organizations can develop metarountines both for changing among established routines. y. Nat. io. sit. and for inventing new routines (Nelson & Winter, 1982).. n. al. er. Metaroutines shift the trade-off by transforming nonroutine into more-routine tasks, but. i n U. v. organizations can also become more ambidextrous by developing their innovativeness in. Ch. engchi. nonroutine tasks without impairing their efficiency in routine tasks (Adler, Goldoftas, & Levine, 1999). Metaroutines are embodied in computer software from those where they are embodied in employees’ work. Allowing software-based automation to shift the trade-off, because such automation reduces the routines of the tasks left to workers. While some employees might welcome routinization as a relief from the stresses created by the chaotic quality of the nonrountine, others – perhaps those with higher growth needs strengths – might resist it. Assuming the resistance is the more likely response, routinization typically needs to be imposed on employees by management via the efforts of staff specialists (Mintzberg, 1979). The demotivating effects of such coercive routinization might not be too costly to the firm if the resulting tasks were entirely stable and routine, since in such contexts a passively acquiescent workforce might suffice (Bowen & Lawler, 1992). However, metaroutines like - 24 -.
(33) routines more generally, reduce task autonomy and variety compared to pure, unfettered innovation. Thus, metaroutines may reduce the intrinsic motivational quality of the innovation process (Hackman & Oldham, 1980). A firm relying on its employees to contribute to ongoing innovation and learning would surly hesitate before adopting such an approach. Knowledge intensive industry, such as software house, might be one of firms struggling to adopt the approach, since the innovation is always the engine to grow. The other common approach the knowledge industry uses often is job rotation. Work can be organized so that people switch sequentially between the two types of tasks rather than attempting to do them both simultaneously. Job rotation allows greater focus and reduces the risks of confusion. These structures enable people to move back and forth between bureaucratic structures for the routine tasks (Bushe & Shani, 1991).. 政 治 大 However, the research demonstrates a disturbing proportion of such switching structures 立 do not yield the expected performance or attitudinal gains, and their mortality rate is high. ‧ 國. 學. (Lewler & Mohrman, 1985). The underlying inhibiting factors reflect a basic tension between the two roles. The efficient performance of routine task requires the support of a mechanistic. ‧. organizational form, one where workers are often assumed to experience work as a disutility and managers must therefore experience close supervision of detailed prescriptive procedures. y. Nat. sit. (Bowen & Lawler, 1992). The creative performance of nonrountine tasks requires the support. al. er. io. of an organic form, where employees are assumed to be intrinsically motivated and coaches.. n. Employees who have been involved in the nonroutine tasks associated with innovation “are. Ch. i n U. v. likely to initially resist more centralization in rules and procedures and decision making” –. engchi. organizational changes necessary for high performance in the more routine, implementation stage (Duncan, 1976). This is also the dilemma the innovative industry such as software houses facing now.. - 25 -.
(34) Chapter 3. Research Methodology. 3.1 Research Framework In order to achieve an understanding of development of corporate planning and budgeting process in the software industry, this research is going to illustrate the process and key factors to introduce, implement, and adopt the automation of planning and budgeting by taking Company X as the case from 2011 to 2013. Moreover, it also aims to discuss the impact to R&D innovation capability after adopting the new planning tool. Two cases will be studied in this research. It covers the firm to introduce the CPM – Company X, and the other world-class corporation in information technology domain –. 政 治 大 The impact of innovation capability with introduction of CPM for these 2 firms will also be 立. Company Y, as the object case to benchmark its efficiency after adopting their owned CPM.. assessed and analysed.. ‧ 國. 學. Comparative case analysis includes quantitative evidence, relies on multiple sources of. ‧. evidence, and benefits from the prior development of theoretical propositions. The strength of conclusions from case studies is not very high, and it is claimed that the use of multiple cases. Nat. sit. y. yields more robustness to the conclusions from the study. Multiple case studies distinguish. io. er. themselves from surveying many persons about something instead of one. Comparative case analysis associated to the studies means that the conclusions from one case should be compared. n. al. Ch. i n U. v. and contrasted with the results from the other case. Besides, the number of cases needed to be. engchi. performed to increase the sample and also increase the statistical strength, would require more cases than what is probably afforded or even available. Further, the evidence abstracted from multiple case research is considered more powerful and more compelling (Herriot & Firestone, 1983) and the approach is a very useful tool to gain insight into all aspects of how an organization address complex strategic decision-making (Ulaga & Sharma, 2001). The Research Framework outlines a process of assessing evidence that asks questions related to important aspects of interpreting research findings. These research questions will be asked through 3 stages of the entire CPM platform development history: (1) First, exploring the key factors to affect the initiation of CPM to the firm; (2) second, outlining the key factors to affect the development and deployment of CPM to the firm; (3) exanimating the key success factors to the adoption of CPM, and (4) evaluating the impact of the innovation capabilities by - 26 -.
(35) benchmarking the selected firms with their CPM processes. At the initiation stage, variables in organizational and environmental contexts influence the firm’s decision to introduce the CPM platform. In organizational context, it includes top management support, size of the firm, urgency to have clear visibility of the reports, level of details of the reports, perceived benefits to introduce CPM, expected performance improvement, and available resources etc. In environment context, it includes efficiency to reflect external market turbulence, megatrend of technology, and competitive pressures etc. The top level management considers the influence among these variables in two contexts to make the decision to introduce CPM or not. After determining to introduce the CPM into the firm, how to develop it becomes the topic. 政 治 大 approaches to develop business application. The key variables to affect the firm on how to 立 develop CPM therefore can be explored in some contexts, including information technology in the next stage. Self-developing, outsourcing, and joint-developing are three most common. ‧ 國. 學. (IT), internal information management capability, and outsourcing vendor capability. Variables of IT compatibility context, usability, security and vulnerability, maturity, and reliability are. ‧. covered in the IT context for discussion.. sit. y. Nat. The third stage of the research explores the key variables to influence the adoption of CPM by various end users as well as the impact to their capability to innovate. The questionnaire was. io. n. al. er. conducted to individuals from all ranks of Company X. With open-ended questions, it leads all. i n U. v. rank users to provide the first hand feedback about CPM to their works, specifically to either. Ch. engchi. contribution or impediment. Meanwhile, the objectives at the fourth stage of research to find the key factors to impact sustainability of CPM, especially impact to innovation capability of R&D, is also elaborated through the feedback collected by the same questionnaire survey to given end users (see Table 3-1). Finally, with series of interview with one current employee, the case of Company Y performance management process and the approach to manage their innovation capabilities of R&D will be provided to compare with Company X CPM to examine identified variables to given context at each stage of implementation.. - 27 -.
(36) Stage. Context. Analysed Variable. Method. Top management support Size of the firm Urgency to have clear visibility of reports Organisational. 政 治 大. Level of details of the report. 立. Perceived benefits to introduce CPM Initiation. Face-to-face or remote one-on-one interviews. ‧ 國. 學. Expected performance improvement Available resources. ‧. Efficiency to reflect external market turbulence Megatrend of technology. sit. y. Nat. Environmental. al. er. io. Competitive pressures. n. Usability Information Technology (IT). Security. Ch. engchi. i n U. v. Maturity Face-to-face interview and consultant. Development Reliability Information Management. Complexity of IT infrastructure Satisfaction with existing systems - 28 -.
(37) Capability. Efforts of Change Management IT personnel capability IT team size Supports of top management IT budget size. 立. 政 治 大. IT project management experience. ‧ 國. 學. Supports of external consultants Vendor size. Reputation. sit. y. Nat. Proved records. io. er. Outsourcing Vendor Capability. ‧. Professional capability. al. iv n C Project management h eexperience n g c h iandUcapability n. CPM knowledge. Perceived usefulness Adoption. Technology acceptance. Perceived ease-to-use Questionnaire and Comparative Analysis Voluntariness. Sustainability. Impact to R&D. Compatibility - 29 -.
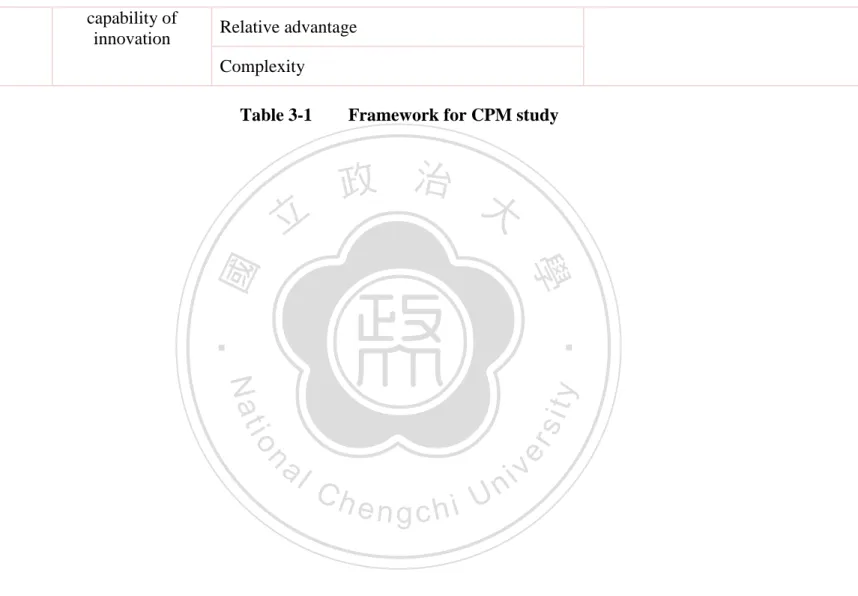
(38) Relative advantage Complexity Table 3-1. 立. Framework for CPM study. 政 治 大. 學 ‧. ‧ 國 io. sit. y. Nat. n. al. er. capability of innovation. Ch. engchi. - 30 -. i n U. v.
(39) 3.2 Data Collection and Analysis As elaborations in previous research framework, the research will be divided into three stages. At stage of initiation, the data collection will be through face-to-face interviews. Using a snowball approach, we interviewed individuals from all ranks of the company, including the executives, finance department staffs, business application project team members, and real end users, including project managers and cost centre planners. Interviews were semi structured, and each lasted 60 to 120 minutes. Key informants were interviewed at greater length and in some cases several times. Unless otherwise noted, quotations below come from these interviews. Interviews were conducted in either face-to-face, or remotely through conference call with interviewees.. 治 政 At Initiation stage, the interviews were conducted by大 at least two researchers. Prior to 立 conducting the interview to the selected representative from functional departments, finance ‧ 國. 學. department or the executive, researchers organized the current budgeting and planning process they were involved. These selected interviewees are the person who manage any project or cost. ‧. centre budgets by himself or herself, the person in finance department who assists managers with planning the budget, or the executive was eager to have completed visibility of budget. y. Nat. sit. execution versus projected revenue. Interviewees could therefore immediately identify issues,. al. er. io. pain points, and expectation for the room to improve, without wasting time to story-tell from. n. scratch. The results of every interview sessions were recorded and transcribed for later analyses. Ch. i n U. v. and future process proposing. The other copy of interview result was also sent to the interviewee for confirmation.. engchi. At the Development stage, the interviews were conducted in two different formats to different interviewees: 1.. IT professional: the interviews were conducted in face-to-face meeting format. The content of interview was focused on the internal IT capability, readiness of information management and understanding of business expectation on CPM, and capabilities to manage outsourcing vendors.. 2.. External consultants: the interviews were conducted in face-to-face meeting format also. The focus of the interview was on understanding the depth of knowledge of budgeting and planning and experience ever implemented CPM. - 31 -.
(40) At stage of adoption and sustainability, the data collection will be through survey of opened questionnaire. The structured-based questionnaire was designed on potential variables of compatibility, relative advantage, complexity of technical acceptance context, and possible factors to influence innovation capability of R&D. Respondents answer each question based on the level of involvement. The design of questionnaire was also referred to the survey about relevant researches and previous results of interview at the two prior stages of implementation. Every single question was examined to ensure the semantics is completed and clear to convey correctly. The design of questionnaire was reviewed and amended three times by a group of consultants and executives. It was also conducted pilot survey to ensure understanding of every question and to improve the reliability and validity effectively to the questionnaire. Reliability concerns the quality of measurement. Reliability refers to the "repeatability" or. 政 治 大. "consistency" of research measures. The reliability of a measure indicates the stability and. 立. consistency with which the instrument measures the concept and helps to access the “goodness”. ‧ 國. 學. of a measure. A measure is reliable to the degree that it supplies consistent results. In this case, results of interview were recorded. The interviewers were reconvened to evaluate the data consistency. If the data was not consistent, reconfirmation with the interviewee was conducted.. ‧. Since collected data is structured, if a group of researchers confirms the record with. y. Nat. confirmation from the interviewee, we can therefore claim that the collected data via series of. er. io. al. sit. interview sessions is indeed reliable.. n. Validity refers to the extent to which a test/instrument measures what we actually wish to. Ch. i n U. v. measure. A scale or measuring instrument is said to process validity to the extent which. engchi. differences in measured values reflect true differences in the characteristic or property being measured. Content validity of a measuring instrument is the extent to which is provides adequate coverage of the topic under study. Content validity has been defined as the representativeness of the content of a measuring instrument. If the instrument contains a representative sample of the universe of the subject matter of interest, then content validity is good. If the questionnaire adequately covers the topic that have been defined as the relevant dimensions, it is possible to conclude that the instrument has good content validity (Krishnaswamy, Sivakumar, & Mathiraj, 2006). This research refers international literatures and interviews with external consultants. The collected data in the research is valid accordingly (See Table 3-2). - 32 -.
(41) No. of Response. Chief Finance Officer (CFO). 1. 60 mins. 1. Chief Information Officer (CIO). 政 治 大 Senior Vice President of Consumer 立 BU. 1. 60 mins. 1. Chief Product Officer (CPO). 1. 60 mins. 1. 1. 90 mins. 1. Senior Vice President of Global Technical Support. 1. 90 mins. 1. Corporate Finance Vice President. 1. 120 mins. 1. Corporate Finance Analyst. 3. 60 mins. 3. Regional Finance Controller. 5. 60 mins. 4. Regional Finance Analyst. 5. 60 mins. 4. 1. 60 mins. 1. 5. 60 mins. 5. Functional Project Manager. 5. 60 mins. 5. Corporate Business Application Services Director. 1. 60 mins. 1. External consultant. 1. 60 mins. 1. 220. 5 mins. 101. ‧ 國. Interview. Time (per person). Object to Study. n. Ch. Functional Planning Representative. Development Adoption. Interview Questionnaire. engchi. Cost Centre Planners - 33 -. er. io. al. Resource. sit. Nat. Corporate Human Planning Director. y. Data Collection Approach. ‧. Initiation. Data Collected From. 學. Stage. i n U. v.
數據
+7


相關文件
二、本校於報名表中對於學生資料之蒐集,係為學生成績計算、資料整理及報 到作業等招生作業之必要程序,並作為後續資料統計及學生報到註冊作業
包括三維機械設計的所更的功能(SolidWorks 三維建模軟體)、資料管 理軟體 PDMWorks Client、以及用於設計交流的常用工具:eDrawings 專 業版(基於 e-mail 的設計交流工具),
(一)體能測驗:研習人員體能測驗,男女生3,000公尺徒手跑步,成績計算
步驟一、請各校註冊組長協助,由學務管理系 統計算成績並下載相關成績報表
換言之,必須先能有效分析企業推動 CSR 概念的「利益」為 何,以及若不推動 CSR 的潛在「風險」為何,將能有效誘發 企業發展 CST
從小到大都在台中唸書,大學就讀 ○○ 大學國貿系,學習國際貿易方面的專業知識。後
前一學期學業成績總平均 70 分以上者,操行成績甲等(80 分以上) 。成績單未登記 有操性成績者,須檢附【表二】獎學金推薦函乙份。2. 前一學期學業成績總平均
• 將已收集的 LPF 有效顯證,加入為校本的 學生表現 示例 ,以建立資源庫作為數學科同工日後的參照,成 為學校數學科組知識管理
