The Impact of NAFTA on Textiles and Apparel Exports of Asian Countries to the United States
9
0
0
全文
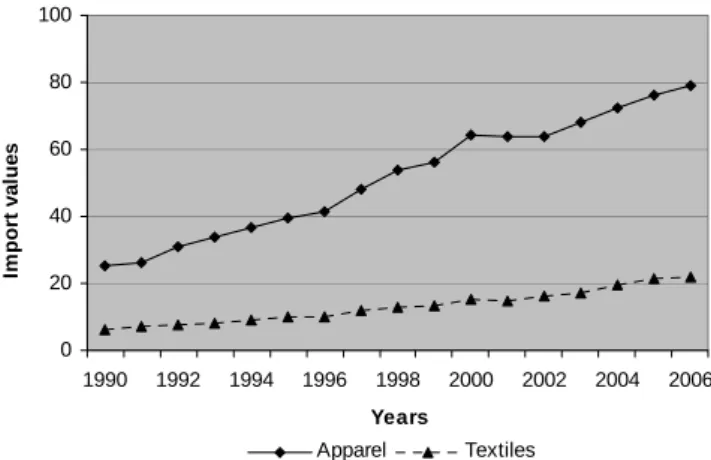
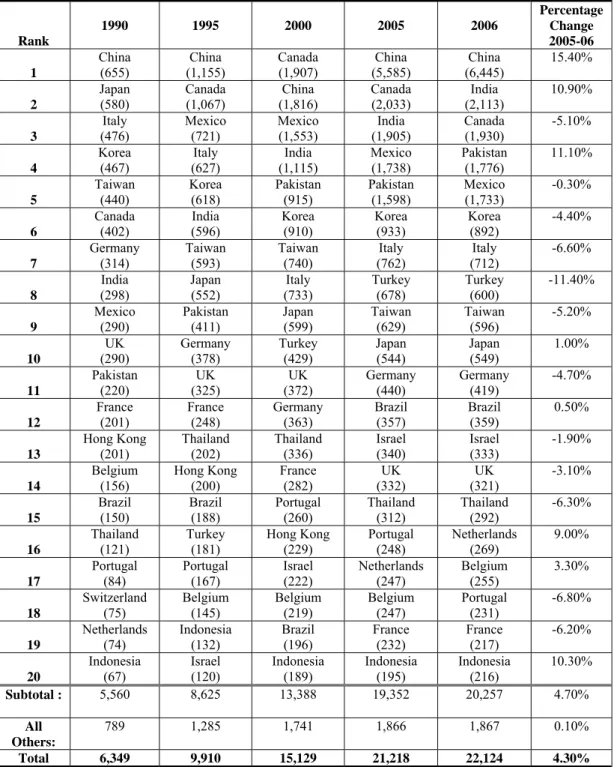
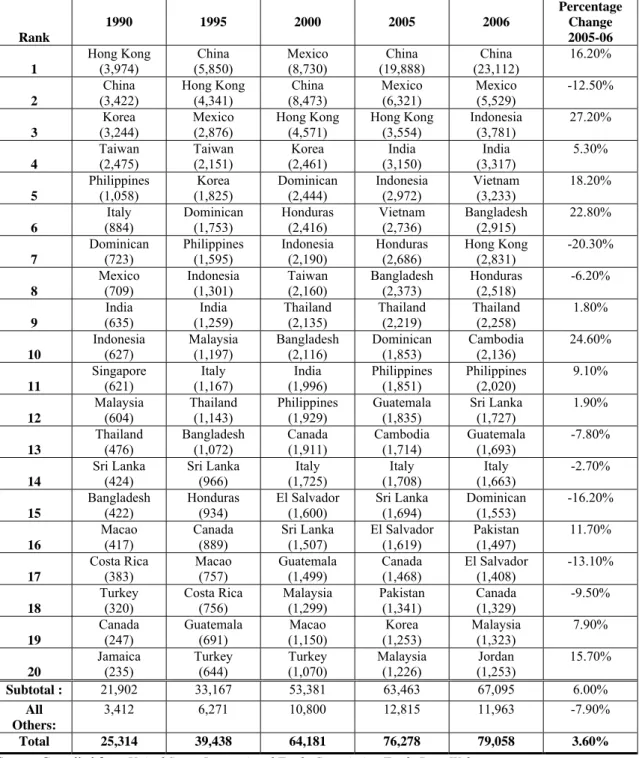
(2) the anticipated total quota phase out in 2005 (Yeung & Mok, 2004). In his study, Naumann (2005) had demonstrated that China and India are expected to draw the greatest benefit from the removal of quotas with respect to the US market. Drivers of this include the level of quota constraints in the past, the size of each country’s domestic T&A industries and their attractiveness as a destination for investment resulting from a relatively low-cost and productive workforce. Besides, the newly emerging exporter - Vietnam has entered the US apparel market and is fiercely competitive. Vietnam experienced spectacular growth in apparel exports to the US markets from 2001. In fact, by 2003 Vietnam had become the largest exporter of apparel to the US market among the Association of Southeast Asian Nations (ASEAN) countries, surpassing traditional suppliers such as Indonesia, Thailand and the Philippines in market share. Today, the developing economies account for approximately two-thirds of all T&A exports globally, a figure that began to soar in the postquota era. This paper reviews the transformation of T&A trade between the US and Asian countries under two policy changes: the implementation of NAFTA and the removal of quotas in different stages under the ATC. Based on the analysis with modified gravity models, the discussion further investigates the changing patterns of T&A imports by US from Asian developed and developing countries. THE TREND OF US TEXTILES AND APPAREL IMPORTS The US is the second largest importer of T&A products globally, and assumed 10.5 percent and 27.5 percent of the global textile and apparel imports respectively in 2005. (The EU is the largest importer, with world share of 30.8 percent and 44.8 percent for textiles and apparel respectively). Both the US imports of T&A were seen rising continuously in the past sixteen years (Figure 1). The increase in apparel imports was much noticeable than that of the textiles. US apparel imports had expanded considerably from US$ 25.3bn to US$ 79.1bn while textile imports had increased from US$ 6.3bn to US$ 22.5bn from 1990 to 2006. 100. Import values. 80 60 40 20 0 1990. 1992. 1994. 1996. 1998. 2000. 2002. 2004. 2006. Years Apparel. Textiles. Figure 1 – Total US Imports of Apparel & Textiles, (USD bn) Source: Complied from USITC Trade Data Web US Textiles Imports With the relatively low-cost and huge industrial sector, China has been the leading textiles exporter since the 1990s (Yang & Zhong, 1998). Other East Asian countries namely Japan, Korea and Taiwan were the top five US importers of textiles in the early 1990s (Table 1). Since the implementation of NAFTA, Mexico and Canada have become the main US suppliers of textiles as. they were privileged to have preferential treatments on exports to the US market. Canada displaced the top US textiles supplier position of China from 1996 to 2001. During this period, US textiles imports from East Asian countries dropped substantially. Trade diversion was evidently identified (James & Umemoto, 1999 & 2000). Followed by China’s accession to the WTO and coincided with the third stage of quota removal in which 51% of T&A products were liberalized in 2002, China’s exports to the US surged. China is by far the dominant US importer of textiles products. From 2002 onwards, some South Asian countries such as India and Pakistan emerged as the significant suppliers of textiles products to the US markets. The US is Pakistan’s largest trading partner. Under the Trade and Investment Framework Agreement (TIFA) with the US, Pakistan raised the issue of market access for Pakistan products under Preferential Trade Agreements. Moreover, the Bilateral Investment Treaty (BIT) between Pakistan and the US will probably be signed by 2007. The FTA will promote trade without protective restrictions and probably increase market access to the US. For India, the textile industry is one of the major and most important sectors in its economy in terms of output and employment. The sector employs 35 million people and after agriculture, is the second-highest employer in the country. It accounts for 14% of industrial production and 16% of the country’s total exports earnings. India has a natural competitive advantage in terms of a huge and powerful multi-fibre base, abundant cheap skilful labor and holds a presence across the entire supply chain of the industry ranging from spinning, weaving, and finishing to the manufacture of garments. India is a global leading textile exporter and its delivery to the US exceeded those of Mexico in 2005. On the completion of ATC in 2005, both the NAFTA partners showed negative growth for textiles exports to the US in 2005 and 2006, while China, India and Pakistan demonstrated over 10 percent growth in the same period. East Asian countries like Korea, Taiwan and Japan were still in the top ten positions but their export volume was far behind that of the Asian developing countries. US Apparel Imports Similar to the textiles counterpart, China was the major US importers of apparel products in the past two decades. China, Hong Kong, Korea and Taiwan were the main apparel suppliers to the US in the early 1990s (Table 2). Since the formation of NAFTA, Mexico’s apparel exports to the US have been increased from under US$ 2bn in 1994 to a peak at US$ 8.7bn in 2000. Mexico’s exports exceeded those of China and became the top US apparel supplier in 1999 and 2000. After that, US apparel imports from Mexico declined continuously for six consecutive years to US$ 5.5bn in 2006. The considerable decline in Mexico exports could be attributed to impacts of China’s accession to the WTO and the further elimination of quotas under the ATC. On the other hand, apparel exports from China to the US skyrocketed since then. Apparel sector is a labor-intensive industry, a vast amount of workforce are required for apparel manufacturing. China’s burgeoning exports was supported by cheap and productive labor, a large stock of technical manpower and huge manufacturing base (Lall & Albaladejo, 2004). Interestingly, there was a remarkable export growth of apparel in Vietnam to the US in recent years. Vietnam normalized trade relations with the US in 2001 and the bilateral treaty enhanced market access greatly in T&A with more liberal quotas and application of the MFN tariffs on US imports from Vietnam (James, 2004). Vietnam enhanced its market share of the US apparel imports in value terms from negligible before 2001 to over four per cent at.
(3) US$ 3.2bn in 2006. Vietnam is currently the fifth supplier of apparel products to the US market. Apparel exports from Vietnam grew faster than any other major suppliers (including China) and displaced Mexico and the Central America Free Trade Agreement (CAFTA) countries. Vietnam has in fact a high potential in developing the T&A industry. Its relatively low labor costs, a skilled labor pool, quality workmanship, and production flexibility are among the key competitive strengths of Vietnam’s T&A sectors. In addition to being a member of the ASEAN, Vietnam is able to gain experiences from other countries. They can co-operate and complement each other in building a qualitydriven T&A manufacturing base. Moreover, Vietnam’s inclusion as a member of the WTO in 2007 also entitles the country with the privilege to enjoy a quota-free trading with other member countries. This will inevitably influence the development for the T&A industry, NAFTA and CAFTA regions. In the post-quota era, China, Indonesia, Bangladesh and Vietnam experienced double-digit export growth to the US from 2005 to 2006. On the contrary, both Mexico and Hong Kong faced substantial export reduction in the same period. ECONOMETRIC ANALYSIS The objective of this paper is to review the transformation of T&A export trends from the Asian countries to the US under the NAFTA regime and the provision of ATC. Ex-post econometric study using the gravity model is adopted for this study. It utilizes historical data to assess the actual impact of policy changes on trade flows between countries. Tinbergen (1962) and Linnemann (1966) first applied the gravity model to analyze international trade flows. According to this model, trade between pairs of countries depends on their economic sizes (GDP), population and geographical distances between the countries. More recently, Bergstrand (1989) and Deardorff (1997) have provided partial theoretical foundations for the gravity equation. Since then most estimates of gravity model added dummy variables to the original gravity equation to test for specific effects. Many of the empirical studies applied gravity model to examine the overall trade effects with creation of regional trade agreements (Bayoumi & Eichengreen, 1995; Frankel, 1997 and Soloaga & Winters, 2001). Modified Gravity Model It is a common practice to employ gravity model of trade to analyze the effects of total merchandise trade among nations. In this research, however, only the trade effects of a particular industry, namely the T&A sectors, are investigated. A standard gravity model is not fully suitable for this kind of sectoralanalysis. Therefore, an alternative model for analyzing the effects of global T&A trade is utilized in this study. According to Augier et al. (2004), determinants of comparative advantage would have significant impacts on bilateral trade at the sectoral level. Xij, the export values of a particular sector from country i to country j, could be explained in terms of four determinants: (1) production of the sector in the exporting country, (2) demand in the importing country, (3) price index in the importing country relative to the price index in all other countries, and (4) cost of trade including transportation cost and tariffs between the exporting and importing country, relative to the costs of trade between all other countries. In the gravity model analysis, modifications were made on certain determinants for sectoral-level analysis of T&A trade. The first two determinants are kept for controlling the effects of other variables which could affect export trade of T&A products.. Rather than applying price index in the regression model, labor cost of the T&A industries in the exporting countries was employed. For cost of trade, geographical distance between the two countries was chosen as one of the determinants as it could be an indicator for transportation costs. Moreover, regional indicator variable was constructed to measure the trade-enhancing effects of the FTA among member countries. Another indicator variable was added to capture the changing pattern of the T&A exports from the Asian developing countries to the US from 1990 to 2006. The T&A sectors would be analyzed separately using the empirical equation developed in this research, T/A represents different sets of textiles and apparel data are used in separate equations for the calculation. The modified gravity model for T/A export trade is shown as follows: ln(Xij) = αo + α1ln(Qi) + α2ln(Ej) + α3ln(LCi) + α4ln(Distij) + α5NAFTAij + α6ADi + εij where: Xij is exports of textiles/apparel from country i to country j Qi is total production of T/A in country i Ej is total apparent consumption of T/A in country j LCi is the labor cost of T/A industries in country i Distij is the geographically distance between country i and j NAFTAij is the dummy variable that takes the value of one if both the country i and j are NAFTA members; zero if otherwise ADi is the dummy variable that takes the value of one if country i is a Asian developing country; zero if otherwise εij is an error term Referring to the equation above, the first two independent variables, Qi and Ej, are the two determinants developed by Augier et al. (2004) for analyzing trade effects at the sectoral level. When the production level (Qi) of T/A is increased in country i, it is assumed that she would export more T/A to other countries, which include country j. It is expected that the production variable would have a positively impact on T/A export. The total apparent consumption (Ej) of T/A in country j (Qj + Mj – Xj) affects the volume of T/A imports from country i, where Mj and Xj are the total imports and exports of T/A in country j. In order to satisfy the increased consumption, country j either produces more domestic T/A goods or imports these products from other countries, which include country i. The consumption variable is expected to have positive effect on export. The third independent variable (LCi) is the labor cost in country i. Country with higher labor cost is expected to have lower attractiveness as a supplier of T/A products. Hence, the labor cost variable should have a negative impact on T/A export. Next, the distance variable (Distij) measures the geographical distance between country i and country j. It reflects the degree of trade resistance between these countries, as measured by the transportation costs. Trade between two far-away countries would usually involve higher transportation costs, which in turn decrease trade between these countries. Therefore, the distance variable is expected to have a negative impact on export. The regional indicator variable, NAFTAij, is included to examine the T/A trade effects of the FTA. Aitken (1973) and Braga et al. (1994) introduced this regional indicator variable and interpreted that the estimated coefficient of this dummy variable to be the sum of the trade-creation and tradediversion effects of the regional trade agreement. By comparing the coefficients of the dummy variable, NAFTAij, in different time intervals, the change in the T&A trade effect caused by the FTA could be observed. Lastly, another indicator variable, ADj, captures the change of T&A export patterns from the Asian.
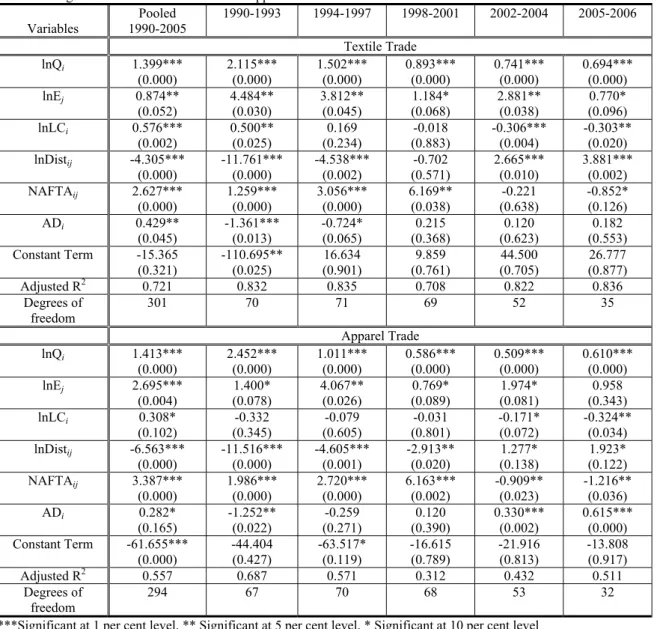
(4) developing economies to the US markets during 1990 to 2006. This variable enables us to distinguish the trade patterns of textiles and apparel between the Asian developing and developed economies. The sixteen countries are classified into three categories based on the United Nations' Human Development Report 20062. Human Development Index (HDI) is a comparative measure of life expectancy, literacy, education and standards of living for countries worldwide. It is commonly used to classify ‘developed’, ‘developing’ and ‘under-developed’ country. As illustrated in Table 3, the three groups of countries are NAFTA members (Canada and Mexico), selected Asian developed countries (except China) and selected S&SE Asian developing countries and China. Measurements of Variables and Data Sources The study utilized a regression model to examine the T&A trade effects of the NAFTA implementation on Asian countries throughout different stages of ATC. The modified regression model was estimated by the ordinary least squares (OLS) method for T/A exports of sixteen countries (fourteen Asian countries and two NAFTA members) to the US during 1990-2006. The entire period was divided evenly into five intervals (1990-1993, 19941997, 1998-2001, 2002-2004 and 2005-2006). The first interval (1990-1993) represents the trade effect of NAFTA preimplementation. Since NAFTA came into effect in 1994, there might have been noticeable increase in T&A trade several years before their enactment, which reflected the trade impact of anticipated implementation of the regional trade agreement (Eichengreen & Irwin, 1998). The second period (1994-1997) investigates the immediate effect of the formation of NAFTA and the third period (1998-2001) focuses on the mature stage of the FTA. The fourth period (2002-2004) examines US imports of T&A products from the NAFTA partners and Asian countries under the third stage of the ATC and by then 51% of T&A quotas were phased out. The last interval (2005-2006) analyzes the most recent T&A flows to the US with the completion of the ATC in 2005. The modified regression model estimated for the five periods would enable us to compare better the coefficient estimates of different independent variables, as well as the indicator variables throughout the sixteen years (Frankel & Wei, 1998). For the dependent variable, the annual bilateral T&A export data are obtained from the USITC Trade Data Web 2-digit level of SITC. For the independent variables, data on T&A production and consumption are collected from UNIDO Industrial Statistics Database 3-digit level of ISIC Rev.2 CD-ROM. Labor cost is obtained from LABORSTA operated by the ILO Bureau of Statistics and data on the geographical distance are collected from time and date.com website. US Department of Commence, Office of Textile and Apparel (OTEXA) and the International Monetary Fund (IMF) are also relevant sources in acquiring figures and statistical data. EMPIRICAL FINDINGS AND DISCUSSION Table 4 illustrates the results of six sets of regression for textiles and apparel trade: the pooled outcome for the entire period (19902006) and four stages (1990-1993, 1994-1997, 1998-2001, 20022004 and 2005-2006). The regression model for textiles trade is very satisfactory as over 70 per cent variance in the dependent variable (exports) was correlated to the six explanatory variables for all the periods whereas only 31 to 68 per cent for the apparel trade. The first two independent variables, the production variable. (Qi) and consumption variable (Ej), were used to control for factors that could affect T&A exports (Xij) from the sixteen countries to the US. The coefficients of them have expected positive sign and significant in all the OLS estimations for textiles and apparel trade. That means production volume of T&A products in the exporting countries and the T&A consumption values in the US are the two important factors which affect countries’ export trade with the US. For the labor cost variable (LCi), the coefficients give expected negative signs and are significant only in the last two intervals (2002-2004 and 2005-2006) for textiles and apparel trade. The negative sign of the LCi coefficient implies that the lower the labor cost incurred within the T&A production of the exporting countries, the higher the attractiveness for the US to import T&A products from them. The results suggest that labor cost was not likely an important factor for US T&A imports before 2002. High cost East Asian countries like Japan, Korea and Taiwan were the major US suppliers of T&A products in the early 1990s. After that, Canada and Mexico increased their T&A exports to the US sharply due to the preferential market access under the NAFTA treaties. Canada is a well-developed economy and its labor cost in the T&A sectors is the highest among all the sixteen countries, followed by Japan. Although Mexico is often regarded as a developing economy, the country’s labor cost is higher than most of the S&SE Asian countries. China is the only low production cost economy which was a large US importer of T&A before 2002. During the third and penultimate stage of quota elimination from 2002 to 2004, up to 51% of pre-existing quotas have been eliminated, leaving the rest of quotas to be axed in the final stage in 2005. Lower production costs became an increasingly important basis for competitive advantage. Low cost countries including China, India and Pakistan became the leading suppliers of US textiles market. China, India, Indonesia, Bangladesh as well as Vietnam became the main suppliers of US apparel market. All of these ASEAN and South Asian countries are having low production cost of T&A products and became competitive in recent years. This could explain for the negative sign and significant result for the coefficient of only after 2002. Next, it is expected that physical distance is negatively related to the values of commodity exports to the US. The coefficients of the Distance variable (Distij) of first three time intervals (1990-93, 1994-97 and 1998-2001) show expected negative sign significantly. Proximity is no doubt an essential factor for facilitating trade between countries. NAFTA members are located much closer to the US compared with Asian countries. Lower transportation cost is charged for exporting T&A products from Mexico and Canada to the US, which in turn increases trade between these countries. However, at the last two intervals from 2002 to 2006, the coefficients of Distij were highly significant and positively related to the textiles export values. This implies that geographical distance between the exporting country and the US is no longer a crucial factor which affects T&A imports of US in recent years. Although the S&SE Asian countries are far apart from the US, they are highly competitive and able to increase T&A exports to the US markets on the completion of ATC. With the increased level of trade between the low cost S&SE Asian countries and the US, they could fully utilize the existing transportation technology to reduce the transportation costs substantially. Nonetheless, lead times and proximity to market are still important. They may become a differentiating factor that will mitigate some of the negative impacts of quota removal in countries located close to the US, such as Mexico and Canada. In.
(5) the apparel sector, in particular, producers must be able to react quickly to the change in demand of the consumers. Thus, proximity between producers and US markets will continue to play an important rule in the future. The crucial independent variable in this study is the regional indicator variable, NAFTAij, which identifies the T&A trade effects of the FTA. For textiles trade, the coefficients of NAFTAij increase from 1.259 in 1990-1993 to 3.056 in 1994-1997, and further to 6.169 in 1998-2001. NAFTAij in the apparel trade estimation shows similar results with the textiles counterpart with the coefficients increased from 1.986 in 1990-1993 to 2.720 in 1994-1997, and further to 6.163 in 1998-2001. The rises in magnitude could be attributed to the trade enhancing effects caused by the free trading entitlement of NAFTA. The previous study by Au & Chan (2003) had demonstrated the formation of NAFTA has stimulated the total intra T&A trade within the FTA in the three periods (1992-1994, 1995-1997 and 1998-2000) under investigation. The considerable intra-trade in NAFTA could be explained by the change in sourcing patterns of the US T&A importers. These US buyers tended to purchased from Mexico and Canada because of the elimination of tariffs and quotas in T&A exports under the FTA. The NAFTA also imposed strong ROO regulation, which is particularly restrictive for T&A products in order to protect preferential trade in the FTA. The “triple transformation” or “yarn-forward” rule of origin mandates that apparel items receiving preferential treatments such as relaxed quotas and special tariffs must use textile inputs from the member countries. It therefore means that all processing operations from the early stage of yarn spinning to the final stage of making up the apparel must take place within the trading bloc (James & Umemoto, 2000). Therefore, the coefficients of the regional indicator variable, NAFTAij, increase across the first three periods from 1990 to 2001. Furthermore, when the coefficient of NAFTAij is positive and increased in magnitude, it signifies US trade with NAFTA members expanded. In other words, T&A exports from the Asian countries to the US decreases compared to NAFTA members. There are shifts in T&A trade shares towards NAFTA and away from Asian countries. Trade diversion is thus revealed in these periods. The results indicate that after increasing for three consecutive periods, the coefficient of NAFTAij drops to negative and the magnitude increases from 2002-2004 to 2005-2006. This suggests that NAFTA no longer provides much benefit on T&A exports from Mexico and Canada to the US in recent years. The positive effect of preferential treatments under NAFTA has been outweighed by the severe competition from the S&SE Asian countries under quota-free environment. Since quota removal is heavily back-weighted, the Agreement only started removing hot quota items in the later stages of the 10-year period (Hildegunn, 2004). Therefore, it was not until 2002 that the S&SE Asian countries shown rapid expansion of T&A exports to the US. Large Asian developing countries such as China, India and Pakistan have huge competitive textile complexes which produce for the international markets and appear more aggressive even against preference-receiving suppliers to the US market. The Chinese textile industry has launched into first place in the US market in the first year of accession to WTO in 2001. In this case, NAFTA members lost ground in US market shares in textiles at the expense of Asian countries under the post-ATC era. The negative coefficient and increased in magnitude of NAFTAij implies trade diversion has ended, as Gruben (2006) remarked in his study.. Lastly, the ADi indicator variable is used for distinguishing the T&A export patterns between the Asian developing and developed economies in different stages from 1990 to 2006. In comparing the textiles and apparel trade, coefficients of ADi in textiles trade are significant and negative in the first two intervals 1990-1993 and 1994-1997. This means Asian developed countries were important suppliers of textiles products to the US in the pre-implementation and early stage of NAFTA. Alternatively, coefficients of ADi in apparel trade are positive and significant in the last two intervals 2002-2004 and 2005-2006. This implies that US imports of apparel mainly came from Asian developing countries after the third stage of the ATC. The exports further expanded with the complete elimination of quotas as evidenced by the increase in magnitude of the ADi coefficient in the interval 2005-2006 for apparel trade. Apparel sector is a labor-intensive industry, large amount of workers are required for apparel manufacturing. Therefore, labor cost is one of the essential factors for apparel production. Developing countries generally possess cheap and productive labor, this is one of the competitive advantages when compared to the developed countries in apparel production. Thus, developing countries would be in a better position in the export of apparel to the other countries in a free trade environment. Moreover, some Asian developing countries have been improving the ability to manufacture higher value-added products and investing heavily in the development of an industrial base in Central America, in order to compete with Mexico and Canada for T&A supplies to the U.S. market. CONCLUSION The implementation of NAFTA and the removal of quotas under the ATC have resulted in a fundamental change in the US imports of T&A. In the early 1990s, East Asian countries; namely China, Japan, Korea, Hong Kong and Taiwan were the major US T&A importers. Since the implementation of the NAFTA, Asian suppliers are faced with high tariffs and quotas on T&A products and the effects of ROOs. East Asian countries, except China, obviously lost ground in T&A exports to the US while the T&A trading of the NAFTA countries increased sharply from the NAFTA pre-implementation stage from 1990 to 2000. The US shifted its T&A imports from East Asian exporters to the NAFTA countries, trade diversion occurred. Following the third stage of the ATC in which 51% of T&A quotas were phased out in 2002 and along with China’s accession to the WTO, T&A trade among the NAFTA partners trended downward in the subsequent years while China’s T&A exports to the US surged. By 2005, the T&A sector was fully integrated into the WTO General Agreement on Tariffs and Trade (GATT) and all quotas have been eliminated, the total T&A export trade among the NAFTA members fell to a trough in 2006. Trade diversion was disrupted. On the other hand, China and other Asian developing countries had emerged to become competitive T&A exporters. S&SE Asian countries such as India, Indonesia, Pakistan, Bangladesh as well as Vietnam accounted for a significant share of US imports of T&A in these few years. T&A exports of developing countries have increased dramatically through effective use of their comparative advantage such as the large supply of cheap labor in production inputs. It is believed that the abolishment of quotas means that tariffs will come to govern the US market for T&A products. Definitely, tariffs will become the main instrument for protecting the US markets in the post-quota era. For instance, preferential tariffs that favor suppliers in the North America, but discriminate.
(6) against the T&A exports from Asia are enforced by the ROOs. As a result, low cost competitive suppliers such as China, India and Indonesia or preference-receiving suppliers namely Mexico and Canada tend to dominate the US T&A markets in the post-quota period. Suppliers that have depended upon large holding of quotas like Hong Kong and Korea were suffered from deterioration in relative trading positions. Acknowledgements: The authors would like to thank The Hong Kong Polytechnic University for providing studentship to fund this study and the expenses for the presentation of this paper. REFERENCES [1] Aitken, N. D. (1973), The Effect of the EEC and EFTA on European Trade: A Temporal cross-section Analysis, American Economic Review, 63 (5), pp.881-892. [2] Au, K. F. & Chan, N. Y. (2003), The World Textile and Apparel Trade: Globalization versus Regionalization, Proceeding of the 7th International Conference on Global and Economic Development. January 8-11, 2003, Bangkok, Thailand, pp.1063-1070. [3] Augier, P., Gasiorek, M. & Tong, C. L. (2004), Rules of Origin and the EU-Med Partnership: The Case of Textiles, The World Economy, 27 (9), pp.1449-1473. [4] Bayoumi, T. & Eichengreen, B. (1995), Is Regionalism Simply a Diversion? Evidence from the Evolution of the EC and EFTA, IMF Working Paper 109, Washington D. C [5] Bergstrand, J. (1989), The Generalized Gravity Equation, Monopolistic Competition, and the Factor-Proportions Theory in International Trade, The Review of Economics and Statistics, 71, pp.143-53. [6] Braga, P., Sadafi, R. & Yeats, A. (1994), Regional Integration in the Americas: Deja Vu All Over Again?, World Economy, 17 (4), pp.577-601. [7] Burfisher, M. E., Robinson, S. & Thierfelder, K. (2001), The Impact of NAFTA on the United States, Journal of Economic Perspectives, 15 (1), pp.125-144. [8] Deardorff, A. (1997), Determinants of Bilateral Trade: Does Gravity Work in a Classical World? The Regionalization of the World Economy, University of Chicago Press, Chicago. [9] Eichengreen, B. & Irwin, D. (1998), The role of history in bilateral trade flows. The Regionalization of the World Economy, University of Chicago Press, Chicago. [10] Frankel, J. A. (1997). Regional trading blocs in the world economic system. Washington, D.C.: Institute for International Economics. [25] Journal of Economics, 28, pp.937-954.. [11] Frankel, J. & Wei, S. J. (1998), Regionalization of world trade and currencies: economics and politics, in: J. Frankel Ed. The Regionalization of the World Economy, University of Chicago Press, Chicago, pp.189-226. [12] Gruben, W. C. (2006). NAFTA, Trade Diversion and Mexico’s Textiles and Apparel Boom and Bust, Southwest Economy. Federal Reserve Bank of Dallas. (September/October 2006). [13] Hildegunn, K. N. (2004). The Global Textile and Clothing Industry post the Agreement on Textiles and Apparel. WTO: Discussion Paper No.5, pp.26-29. [14] James, W. E. (2004), MFA phase-out and implications for the contribution of textiles and clothing sector to external financing for development in Asian and the Pacific. Economic and Social Commission for Asia and the Pacific, Bangkok. [15] James, W. E. & Umemoto, M. (1999), Rules of Origin and the Competitive Position of Asian Textiles and Apparel Producers in the North American Market, ICSEAD Working Paper Series, Kitakyushu, Japan, 99 (1). [16] James, W. E. & Umemoto, M. (2000), NAFTA Trade with East Asia, Rules of Origin and Market Access in Textiles, Apparel, Footwear and Electrical Machinery, ASEAN Economic Bulletin. 17 (3), pp.293-311. [17] Linnemann, H. (1966), An econometric study of international trade flows, North-Holland, Amsterdam. [18] Lall, S. & Albaladejo, M. (2004), China’s Competitive Performance: A Threat to East Asian Manufactured Exports?, World Development, 32 (9), pp.1441-1466. [19] Naumann, E. (2005). Textiles and apparel: Reflections on the sector’s integration into the post-quota environment, Trade law Centre for Southern Africa Working Paper, No. 1/2005. [20] Report from the Trilateral Working Group on Textiles and Apparel to the NAFTA Free Trade Commission. March 7, 2005. [21] Soloaga, I. & Winters, A. (2001) Regionalism in the nineties: what effect on trade?. North American Journal of Economics and Finance, 12, pp.1-29. [22] Tinbergen, J. (1962), Shaping the world economy Suggestions for an international economic policy, The Twentieth Century Fund, New York. [23] Yang, Y. Z. & Zhong. C. S. (1998). China’s Textile and Clothing Exports in a Changing World Economy, The Developing Economies, 36 (1), pp.3-23. [24] Yeung, G. & Mok, V. (2004), Does WTO accession matter for the Chinese textile and clothing industry?, Cambridge.
(7) APPENDIX Table 1 Major Suppliers in the United States Textiles Market (in US dollar Mn, current prices) 1990. 1995. 2000. 2005. 2006. China (655) Japan (580) Italy (476) Korea (467) Taiwan (440) Canada (402) Germany (314) India (298) Mexico (290) UK (290) Pakistan (220) France (201) Hong Kong (201) Belgium (156) Brazil (150) Thailand (121) Portugal (84) Switzerland (75) Netherlands (74) Indonesia (67) 5,560. China (1,155) Canada (1,067) Mexico (721) Italy (627) Korea (618) India (596) Taiwan (593) Japan (552) Pakistan (411) Germany (378) UK (325) France (248) Thailand (202) Hong Kong (200) Brazil (188) Turkey (181) Portugal (167) Belgium (145) Indonesia (132) Israel (120) 8,625. Canada (1,907) China (1,816) Mexico (1,553) India (1,115) Pakistan (915) Korea (910) Taiwan (740) Italy (733) Japan (599) Turkey (429) UK (372) Germany (363) Thailand (336) France (282) Portugal (260) Hong Kong (229) Israel (222) Belgium (219) Brazil (196) Indonesia (189) 13,388. China (5,585) Canada (2,033) India (1,905) Mexico (1,738) Pakistan (1,598) Korea (933) Italy (762) Turkey (678) Taiwan (629) Japan (544) Germany (440) Brazil (357) Israel (340) UK (332) Thailand (312) Portugal (248) Netherlands (247) Belgium (247) France (232) Indonesia (195) 19,352. China (6,445) India (2,113) Canada (1,930) Pakistan (1,776) Mexico (1,733) Korea (892) Italy (712) Turkey (600) Taiwan (596) Japan (549) Germany (419) Brazil (359) Israel (333) UK (321) Thailand (292) Netherlands (269) Belgium (255) Portugal (231) France (217) Indonesia (216) 20,257. Rank 1 2 3 4 5 6 7 8 9 10 11 12 13 14 15 16 17 18 19 20 Subtotal :. 789 1,285 1,741 1,866 1,867 All Others: Total 6,349 9,910 15,129 21,218 22,124 Source: Complied from United States International Trade Commission Trade Data Web. Percentage Change 2005-06 15.40% 10.90% -5.10% 11.10% -0.30% -4.40% -6.60% -11.40% -5.20% 1.00% -4.70% 0.50% -1.90% -3.10% -6.30% 9.00% 3.30% -6.80% -6.20% 10.30% 4.70% 0.10% 4.30%.
(8) Table 2 Major Suppliers in the United States Apparel Market (in US dollar Mn, current prices) 1990. 1995. 2000. 2005. 2006. Hong Kong (3,974) China (3,422) Korea (3,244) Taiwan (2,475) Philippines (1,058) Italy (884) Dominican (723) Mexico (709) India (635) Indonesia (627) Singapore (621) Malaysia (604) Thailand (476) Sri Lanka (424) Bangladesh (422) Macao (417) Costa Rica (383) Turkey (320) Canada (247) Jamaica (235) 21,902 3,412. China (5,850) Hong Kong (4,341) Mexico (2,876) Taiwan (2,151) Korea (1,825) Dominican (1,753) Philippines (1,595) Indonesia (1,301) India (1,259) Malaysia (1,197) Italy (1,167) Thailand (1,143) Bangladesh (1,072) Sri Lanka (966) Honduras (934) Canada (889) Macao (757) Costa Rica (756) Guatemala (691) Turkey (644) 33,167 6,271. Mexico (8,730) China (8,473) Hong Kong (4,571) Korea (2,461) Dominican (2,444) Honduras (2,416) Indonesia (2,190) Taiwan (2,160) Thailand (2,135) Bangladesh (2,116) India (1,996) Philippines (1,929) Canada (1,911) Italy (1,725) El Salvador (1,600) Sri Lanka (1,507) Guatemala (1,499) Malaysia (1,299) Macao (1,150) Turkey (1,070) 53,381 10,800. China (19,888) Mexico (6,321) Hong Kong (3,554) India (3,150) Indonesia (2,972) Vietnam (2,736) Honduras (2,686) Bangladesh (2,373) Thailand (2,219) Dominican (1,853) Philippines (1,851) Guatemala (1,835) Cambodia (1,714) Italy (1,708) Sri Lanka (1,694) El Salvador (1,619) Canada (1,468) Pakistan (1,341) Korea (1,253) Malaysia (1,226) 63,463 12,815. China (23,112) Mexico (5,529) Indonesia (3,781) India (3,317) Vietnam (3,233) Bangladesh (2,915) Hong Kong (2,831) Honduras (2,518) Thailand (2,258) Cambodia (2,136) Philippines (2,020) Sri Lanka (1,727) Guatemala (1,693) Italy (1,663) Dominican (1,553) Pakistan (1,497) El Salvador (1,408) Canada (1,329) Malaysia (1,323) Jordan (1,253) 67,095 11,963. 25,314. 39,438. 64,181. 76,278. 79,058. Rank 1 2 3 4 5 6 7 8 9 10 11 12 13 14 15 16 17 18 19 20 Subtotal : All Others: Total. Source: Complied from United States International Trade Commission Trade Data Web. Percentage Change 2005-06 16.20% -12.50% 27.20% 5.30% 18.20% 22.80% -20.30% -6.20% 1.80% 24.60% 9.10% 1.90% -7.80% -2.70% -16.20% 11.70% -13.10% -9.50% 7.90% 15.70% 6.00% -7.90% 3.60%.
(9) Table 3 Categorization of countries by Human Development Index NAFTA HDI Asian developed HDI members countries Canada 0.950 Japan 0.949 Mexico 0.821 Hong Kong SAR 0.927 Taiwan 0.925 Singapore 0.916 Korea 0.912 Malaysia 0.805. Asian developing HDI countries Thailand 0.784 China* 0.768 Philippines 0.763 Sri Lanka 0.755 Indonesia 0.711 Vietnam 0.709 India 0.611 Pakistan 0.539 Bangladesh 0.530 Source: Human Development Report 2006. United Nations Development Programme. * Includes data for mainland People's Republic of China; excludes Hong Kong Special Administrative Region (SAR) (separately ranked), Macau SAR and Taiwan (Chinese Taepei). Table 4 Regression Results for Textiles and Apparel Trade Pooled 1990-1993 1994-1997 1998-2001 2002-2004 Variables 1990-2005 Textile Trade lnQi 1.399*** 2.115*** 1.502*** 0.893*** 0.741*** (0.000) (0.000) (0.000) (0.000) (0.000) lnEj 0.874** 4.484** 3.812** 1.184* 2.881** (0.052) (0.030) (0.045) (0.068) (0.038) lnLCi 0.576*** 0.500** 0.169 -0.018 -0.306*** (0.002) (0.025) (0.234) (0.883) (0.004) lnDistij -4.305*** -11.761*** -4.538*** -0.702 2.665*** (0.000) (0.000) (0.002) (0.571) (0.010) NAFTAij 2.627*** 1.259*** 3.056*** 6.169** -0.221 (0.000) (0.000) (0.000) (0.038) (0.638) ADi 0.429** -1.361*** -0.724* 0.215 0.120 (0.045) (0.013) (0.065) (0.368) (0.623) Constant Term -15.365 -110.695** 16.634 9.859 44.500 (0.321) (0.025) (0.901) (0.761) (0.705) Adjusted R2 0.721 0.832 0.835 0.708 0.822 Degrees of 301 70 71 69 52 freedom Apparel Trade lnQi 1.413*** 2.452*** 1.011*** 0.586*** 0.509*** (0.000) (0.000) (0.000) (0.000) (0.000) lnEj 2.695*** 1.400* 4.067** 0.769* 1.974* (0.004) (0.078) (0.026) (0.089) (0.081) lnLCi 0.308* -0.332 -0.079 -0.031 -0.171* (0.102) (0.345) (0.605) (0.801) (0.072) lnDistij -6.563*** -11.516*** -4.605*** -2.913** 1.277* (0.000) (0.000) (0.001) (0.020) (0.138) NAFTAij 3.387*** 1.986*** 2.720*** 6.163*** -0.909** (0.000) (0.000) (0.000) (0.002) (0.023) ADi 0.282* -1.252** -0.259 0.120 0.330*** (0.165) (0.022) (0.271) (0.390) (0.002) Constant Term -61.655*** -44.404 -63.517* -16.615 -21.916 (0.000) (0.427) (0.119) (0.789) (0.813) Adjusted R2 0.557 0.687 0.571 0.312 0.432 Degrees of 294 67 70 68 53 freedom ***Significant at 1 per cent level, ** Significant at 5 per cent level, * Significant at 10 per cent level. 2005-2006. 0.694*** (0.000) 0.770* (0.096) -0.303** (0.020) 3.881*** (0.002) -0.852* (0.126) 0.182 (0.553) 26.777 (0.877) 0.836 35. 0.610*** (0.000) 0.958 (0.343) -0.324** (0.034) 1.923* (0.122) -1.216** (0.036) 0.615*** (0.000) -13.808 (0.917) 0.511 32.
(10)
數據
相關文件
: joint hearing before the Subcommittee on International Economic Policy, Export and Trade Promotion and the Subcommittee on East Asian and Pacific Affairs of the Committee
As regards the two main industries in manufacturing, namely manufacture of textiles and manufacture of wearing apparel, their gross output, gross value added and the structure of
As regards the two main industries in manufacturing, namely manufacture of textiles and manufacture of wearing apparel, their gross output, gross value added and the structure of
The value of total merchandise export for January 2011 amounted to MOP656 million, up by 5.8% year- on-year, of which value of domestic exports increased by 17.0% to MOP249 million,
substance) is matter that has distinct properties and a composition that does not vary from sample
The value of total merchandise export rose slightly by 0.1% year-on-year to MOP694 million, with value of re-exports rising by 12.6% to MOP506 million, but that of domestic
(c) Draw the graph of as a function of and draw the secant lines whose slopes are the average velocities in part (a) and the tangent line whose slope is the instantaneous velocity
[This function is named after the electrical engineer Oliver Heaviside (1850–1925) and can be used to describe an electric current that is switched on at time t = 0.] Its graph
