Performance of
Value-Based
Strategies in the
Hong Kong Stock
Market
August 01, 2012
Sponsored by:
Value Partners Center for
Investing
Page 2
Performance of Value-Based Strategies
in the Hong Kong Stock Market
Introduction
We demonstrated in our previous newsletter how value investing is effective in the Hong Kong stock market. This paper extends our study by comparing the performance of two different stock valuation metrics. We found that our value-based strategies provide investors with much higher returns based on our portfolio formation criteria for stocks.
Data Sample and Value Metrics
We obtained data on the daily total return index, monthly prices, and market value of individual Hong Kong stocks as well as the daily total return index of the Hang Seng Index from Datastream. We also obtained data on total assets, total liability, net income, depreciation, total number of shares outstanding, and earnings per share from Worldscope. We included stocks with negative fiscal year earnings in our study. We excluded exchange traded funds (ETFs) and warrants as well as the bottom one-third of stocks based on market value from our study. We used two valuation metrics: dividend yield (DY) and earnings-to-price (EP) ratio. Our study encompassed the period between January 1990 and December 2011.
The Performance of Value-Based Strategies
We sorted Hong Kong stocks into five portfolios based on their two valuation metrics. For each portfolio, we calculated both the equal- and market capitalization-weighted forward-looking one-month returns. The portfolios were rebalanced each month according to the stocks’ two valuation metrics over the 22-year period. We then subtracted the equal- and value-weighted returns of each portfolio from the equivalent return in the Hang Seng Index. The difference in returns is the outperformance, or excess return, against the HSI as shown in tables 1 and 2.
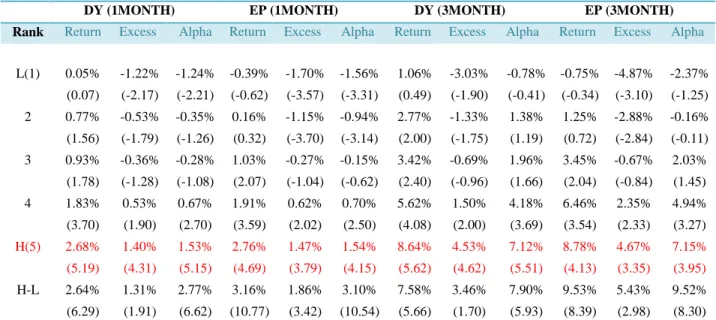
In table 1, we show that the equal-weighted portfolio holding the top 20% of stocks (H) based on our screening method and valuation metrics outperformed the HSI by 1.40% to 1.47% a month over the 22-year period. The value-weighted portfolio with the highest value also outperformed the HSI during this time. The market risk-adjusted returns (alphas) of these two portfolios (based on CAPM) were 1.53% and 1.54%. The H portfolio also outperformed the portfolio with the lowest value (L). The zero-cost portfolio (H-L) that was long the highest value portfolios and short the lowest value portfolios generated monthly returns of 2.64% and 3.16% over the 22-year period.
Table 1: VALUE STRATEGY – Equal-Weighted Portfolio
DY (1MONTH) EP (1MONTH) DY (3MONTH) EP (3MONTH) Rank Return Excess Alpha Return Excess Alpha Return Excess Alpha Return Excess Alpha
L(1) 0.05% -1.22% -1.24% -0.39% -1.70% -1.56% 1.06% -3.03% -0.78% -0.75% -4.87% -2.37% (0.07) (-2.17) (-2.21) (-0.62) (-3.57) (-3.31) (0.49) (-1.90) (-0.41) (-0.34) (-3.10) (-1.25) 2 0.77% -0.53% -0.35% 0.16% -1.15% -0.94% 2.77% -1.33% 1.38% 1.25% -2.88% -0.16% (1.56) (-1.79) (-1.26) (0.32) (-3.70) (-3.14) (2.00) (-1.75) (1.19) (0.72) (-2.84) (-0.11) 3 0.93% -0.36% -0.28% 1.03% -0.27% -0.15% 3.42% -0.69% 1.96% 3.45% -0.67% 2.03% (1.78) (-1.28) (-1.08) (2.07) (-1.04) (-0.62) (2.40) (-0.96) (1.66) (2.04) (-0.84) (1.45) 4 1.83% 0.53% 0.67% 1.91% 0.62% 0.70% 5.62% 1.50% 4.18% 6.46% 2.35% 4.94% (3.70) (1.90) (2.70) (3.59) (2.02) (2.50) (4.08) (2.00) (3.69) (3.54) (2.33) (3.27) H(5) 2.68% 1.40% 1.53% 2.76% 1.47% 1.54% 8.64% 4.53% 7.12% 8.78% 4.67% 7.15% (5.19) (4.31) (5.15) (4.69) (3.79) (4.15) (5.62) (4.62) (5.51) (4.13) (3.35) (3.95) H-L 2.64% 1.31% 2.77% 3.16% 1.86% 3.10% 7.58% 3.46% 7.90% 9.53% 5.43% 9.52% (6.29) (1.91) (6.62) (10.77) (3.42) (10.54) (5.66) (1.70) (5.93) (8.39) (2.98) (8.30)
Note: Portfolio formation period is from January 1990 to December 2011. Adjusted t-statistics are in parentheses.
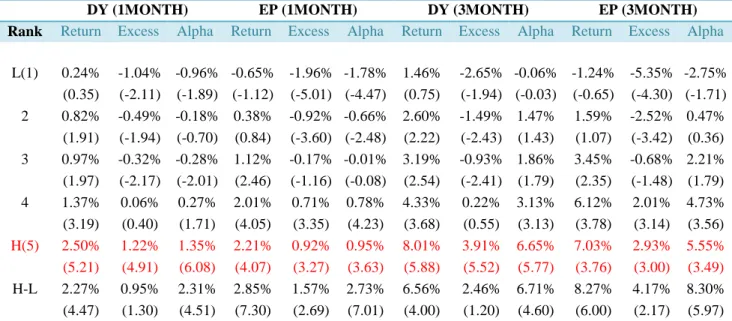
To account for transaction costs, we assumed that the maximum cost of churning all stocks in a portfolio in Hong Kong was 0.75% per month. Even with a 100% turnover monthly rate for each portfolio, the two value investing strategies still outperformed the Hang Seng Index. When minimizing the transaction costs by holding the portfolios for longer periods of time such as 3, 6 or 9 months, we found that value-weighted portfolios outperformed the Hang Seng Index, albeit by a smaller magnitude (see table 2). We found similar results for the 6- and 9-month portfolio holding periods over the 1990- 2011 time frame.
Page 4
Table 2: VALUE STRATEGY – Value-Weighted Portfolio
DY (1MONTH) EP (1MONTH) DY (3MONTH) EP (3MONTH) Rank Return Excess Alpha Return Excess Alpha Return Excess Alpha Return Excess Alpha
L(1) 0.24% -1.04% -0.96% -0.65% -1.96% -1.78% 1.46% -2.65% -0.06% -1.24% -5.35% -2.75% (0.35) (-2.11) (-1.89) (-1.12) (-5.01) (-4.47) (0.75) (-1.94) (-0.03) (-0.65) (-4.30) (-1.71) 2 0.82% -0.49% -0.18% 0.38% -0.92% -0.66% 2.60% -1.49% 1.47% 1.59% -2.52% 0.47% (1.91) (-1.94) (-0.70) (0.84) (-3.60) (-2.48) (2.22) (-2.43) (1.43) (1.07) (-3.42) (0.36) 3 0.97% -0.32% -0.28% 1.12% -0.17% -0.01% 3.19% -0.93% 1.86% 3.45% -0.68% 2.21% (1.97) (-2.17) (-2.01) (2.46) (-1.16) (-0.08) (2.54) (-2.41) (1.79) (2.35) (-1.48) (1.79) 4 1.37% 0.06% 0.27% 2.01% 0.71% 0.78% 4.33% 0.22% 3.13% 6.12% 2.01% 4.73% (3.19) (0.40) (1.71) (4.05) (3.35) (4.23) (3.68) (0.55) (3.13) (3.78) (3.14) (3.56) H(5) 2.50% 1.22% 1.35% 2.21% 0.92% 0.95% 8.01% 3.91% 6.65% 7.03% 2.93% 5.55% (5.21) (4.91) (6.08) (4.07) (3.27) (3.63) (5.88) (5.52) (5.77) (3.76) (3.00) (3.49) H-L 2.27% 0.95% 2.31% 2.85% 1.57% 2.73% 6.56% 2.46% 6.71% 8.27% 4.17% 8.30% (4.47) (1.30) (4.51) (7.30) (2.69) (7.01) (4.00) (1.20) (4.60) (6.00) (2.17) (5.97)
Note: Portfolio formation period is from January 1990 to December 2011. The adjusted t-statistics are in parentheses.
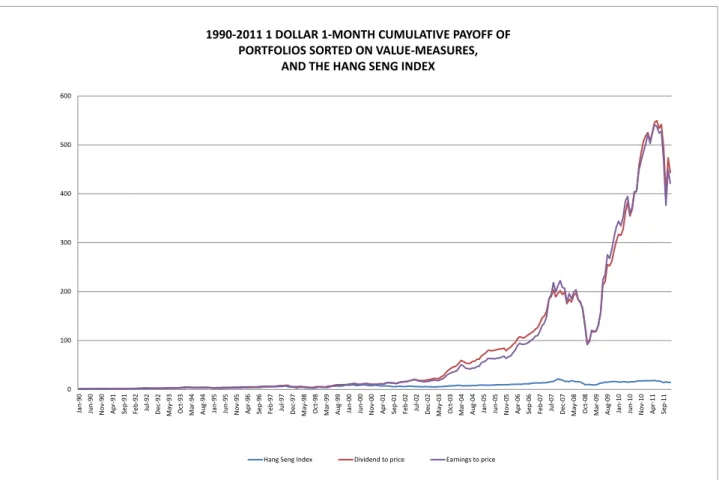
Value investing strategy outperforms the HSI up to 29 times
In figure 1, we examined the cumulative payoff in dollar terms when we invest $1 in the portfolio holding the top 20% of stocks with 100% monthly portfolio turnover compared with a $1 investment in the HSI starting January 1990. We found that the portfolio with the highest dividend yield and earnings-to-price (EP) ratios generated a $443.8 equal-weighted return and $421.3 value-equal-weighted return over the 22-year period. By contrast, the HSI generated a return of $14.5. These results suggest that investment based on our value strategies can consistently outperform the Hang Seng Index. In particular, the value investing strategies based on our stock valuation methodologies reward investors with returns up to 29 times more than the HSI. During the global financial crisis, the DY- and EP-based value investing strategies recorded a decline of about 31.6% and 38.8%, respectively between October 2007 to October 2008, outperforming the HSI which declined by 52% over the same time period. Immediately after the crisis between October 2007 to December 31, 2011, our two value investing strategies rewarded investors with returns of 126% and 98%, respectively, while the HSI lost 33% during the same period.
Figure 1. Cumulative payoff from February 1990 to December 2011 when investing $1 in the Hang Seng
Index and $1 in a portfolio holding the top 20th percentile of Hong Kong stocks based on our valuation metrics, with monthly portfolio rebalancing
0 100 200 300 400 500 600 Ja n-90 Jun -9 0 N ov-90 Ap r-91 Se p-9 1 Fe b-9 2 Jul -9 2 De c-92 M ay -9 3 O ct -93 M ar -94 Au g-94 Ja n-95 Jun -9 5 N ov-95 Ap r-96 Se p-9 6 Fe b-9 7 Jul -9 7 De c-97 M ay -9 8 O ct -98 M ar -99 Au g-99 Ja n-00 Jun -0 0 N ov-00 Ap r-01 Se p-0 1 Fe b-0 2 Jul -0 2 De c-02 M ay -0 3 O ct -03 M ar -04 Au g-04 Ja n-05 Jun -0 5 N ov-05 Ap r-06 Se p-0 6 Fe b-0 7 Jul -0 7 De c-07 M ay -0 8 O ct -08 M ar -09 Au g-09 Ja n-10 Jun -1 0 N ov-10 Ap r-11 Se p-1 1
1990-2011 1 DOLLAR 1-MONTH CUMULATIVE PAYOFF OF PORTFOLIOS SORTED ON VALUE-MEASURES,
AND THE HANG SENG INDEX
Page 6
Conclusion
We find that value investing strategies based on our two alternative metrics consistently outperformed Hang Seng Index over the past 22 years. Our equal-weighted portfolios investing in the top 20th percentile of stocks based on our value metrics rewarded investors with returns 29 times more than the Hang Seng Index over the 22-year time period.
About Value Partners Center for Investing (http://vpcenter.ust.hk/)
The Value Partners Center for Investing, of The Hong Kong University of Science and Technology Business School, is the academic and intellectual center for supporting research and training on investing with emphasis on China and Hong Kong financial markets, and to promote Hong Kong's role as the regional asset management center. This center is sponsored by Value Partners Group Limited.
About Value Partners Group Limited (www.valuepartnersgroup.com.hk)
Value Partners is one of Asia’s largest asset management firms. Since the establishment in 1993, Value Partners has been a dedicated value investor with a focus on the Greater China region. The Group manages absolute return long-biased funds, long-short hedge funds, exchange-traded funds, quantitative funds, and private equity funds for institutional and individual clients in Asia Pacific, Europe and the United States.
Contact of author
Dr. Samuel Xin Liang Associate Director
Value Partners Center for Investing Tel: +852 2358 8204
Mobile: +852 6880 3831 Fax: 2358 1749
Email: [email protected]
Supporting Research Team : Ms. Cheuk, Man Yin