國 立 交 通 大 學 教 育 研 究 所
碩 士 論 文
以學習者生成性繪圖為科學學習策略之探究
Learner-Generated Drawing as a Science
Learning Strategy
指導教授:林珊如 博士
研 究 生 : 秦 嘉
以學習者生成性繪圖為科學學習策略之探究
Learner-Generated Drawing as a Science Learning Strategy
研究生:秦 嘉 Student:Chia, Chin
指導教授:林珊如 Advisor:Shan-Ju, Lin
國 立 交 通 大 學
教育研究所
碩 士 論 文
A ThesisSubmitted to Institute of Education National Chiao-Tung University in partial Fulfillment of the requirements
For the degree of the master
in
Institute of Education July 2013
Hsinchu, Taiwan, Republic of China
i
Learner-Generated Drawing as a Science Learning Strategy
Student: Chia, Chin Advisor: Dr. Shan-Ju Lin
ACKNOWLEDGEMENT
The past two years was the best journey I have ever had. It seems like my hardest time but at the same time the sweetest time in these 24 months in institute of
Education. Here and now I survived.
First, I would like to thank my committee members, professors Sherry Chen, Chuen-Tsai Sun, and Chia-Yu Wang who gave me valuable advices and encouraged me to deepen my research. Second, thanks for my parents’ supports that made me brave to take every challenge in my graduate study. Next, it is my honor to have the best lab mates ever. I can’t go this far without Joy, Momo, Patrick and Jenny. I also want to thank my friend, Ray, who accompanied me in every suffering writing late night, accepted me unconditionally. Being with him makes me feel freer than I was alone.
Last but not least, I would like to dedicate my deepest appreciation to my advisor, Professor Sunny Lin. She is the best teacher and a best mom; no word could really describe how important she is in my life.
Nietzsche once said “What doesn’t kill you makes you stronger.” And yes, now I am strong enough to face the real world. It’s all because all who once helped me to grow. I am the luckiest one in the world.
ii
Learner-Generated Drawing as a Science Learning Strategy
Student: Chia, Chin Advisor: Dr. Shan-Ju Lin
ABSTRACT
The present study examined the use of drawing as a generative learning strategy for college students in understanding science text. Four drawing treatment conditions were used to test the hypotheses about what kind of supports have to be accompanied with the drawing strategy (LGD) during the constructive learning process? Ninety-six non-biology major college students were recruited and asked to read paragraphs about the human circulatory system. In pure LGD group (group D, N=23) participants were asked to construct drawings after reading the text; whereas in group DI (N=22) participants drew and were provided with illustration feedback. Participants in group DIP (N=21) received not only illustration feedback but also prompting questions while those in Group DIPE (N=23) were taught thoroughly about how to select main ideas from the text for organizing and integrating by drawing and provide with illustration feedback and prompting questions. Dependent measures included post-factual knowledge test, post-mental model and post-transfer test. The results showed that the participants in the group DIPE constructed the most accurate
drawings and also scored significantly higher in every posttest than the group DI did while other groups D and DIP performed in between. Treatment, motivation and pre-mental model were predictive to the accuracy of drawing during treatment. Several typical drawings in four groups were selected for further qualitative
descriptions. Implications for effective use of drawing in reading science texts were discussed.
iii
Table of content
http://www.youtube.com/watch?v=f1DAlpfC4Gg ACKNOWLEDGEMENT ... i ABSTRACT ...ii List of Table ...v List of Figure... vi Chap.1 Introduction ... 1Chap.2 Literature Review ... 8
2.1 Learner-Generative Drawing ... 8
1. Theory Base and Cognitive Process of Learner-Generated Drawing ... 8
2. Learner-Generated Drawing Strategy ... 10
3. Accuracy ... 12
2.2 External Support ... 12
2.3 Characteristic of the posttest ... 17
Chap.3 Method ... 19 3.1 Participants ... 19 3.2 Design ... 19 1. Independent Variable ... 19 2. Dependent Variable ... 20 3.3 Material ... 21 1. Text ... 21 2. Booklets ... 21 3. Illustration feedback... 22 4. Prompting question ... 22 3.4 Measure ... 23 1. Pretest ... 23 2. Accuracy ... 27 3. Posttest ... 27 4. Statistic ... 28 3.5 Procedure ... 28 Chapter.4 Result ... 30
iv
4.2 Treatment effects ... 30
4.3 The comparative effects of prior knowledge, motivation and treatment on accuracy ... 33
4.4 Qualitative analysis of the individual participant ... 34
Chap.5 Conclusion and Discussion ... 43
5.1 Summary of the results ... 43
5.2 Implications ... 46
5.3 Limitations and Future predictions ... 47
References:... 48
Appendix... 52
A. Sources of “Draw for science understanding”... 52
B. Learning Text ... 54
C. Illustration Feedback ... 56
D. Prompting questions... 58
E. Pre-Factual Knowledge Test ... 60
F. Transfer Test ... 61
G. Retention Test ... 62
v
List of Table
Table 3.1 Descriptions of supports………..…..…….…19
Table 3.2 Group assignment………....……..…….…20
Table 3.3 Mental model Coding……….…....25
Table 3.4 Procedure of the experiment……….……….….…29
Table 4.1 Descriptive statistics of prior knowledge and motivation among four groups. ………..…………31
Table 4.2 Descriptive statistics of retention test, transfer test and post mental model among four groups. ……….………..…….……31
Table 4.3 ANOVA summaries of group differences on retention, transfer and post mental model……….……….……32
Table.4.4 The predictive effects of treatment, motivation (QCM), prior knowledge on accuracy in a multiple regression analysis…..…..….44
vi
List of Figure
Figure 1.1 Da Vinci’s note ……….………2
Figure 1.2 Newton’s note ………....……...…2
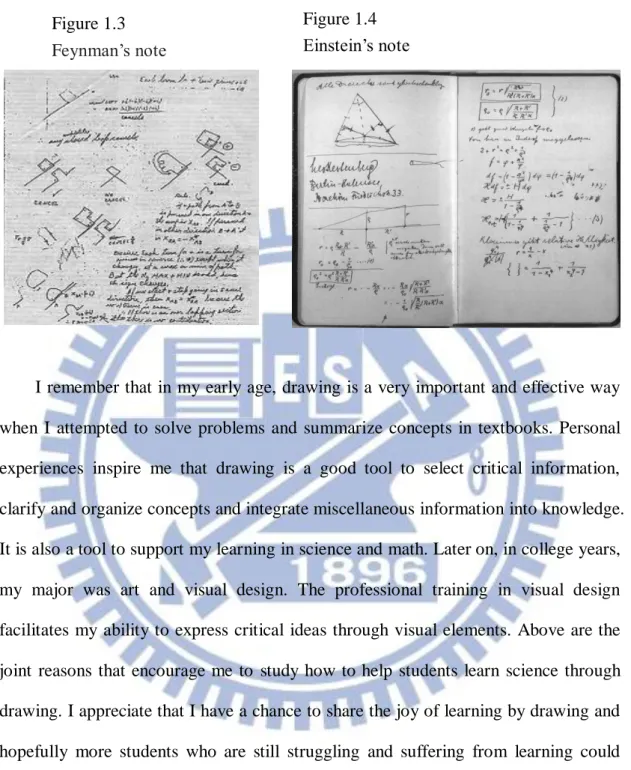
Figure 1.3 Feynman’s note……….………....3
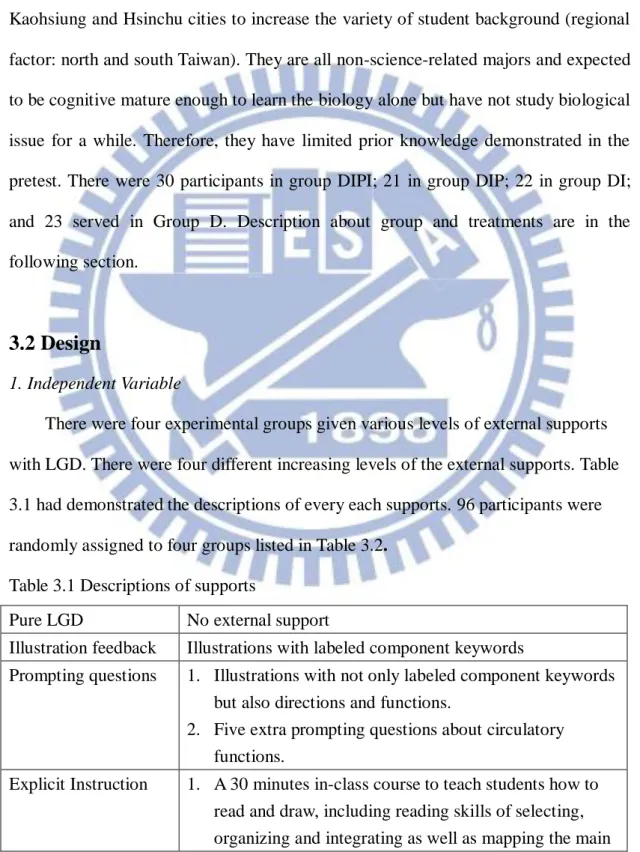
Figure 1.4 Einstein’s note………...………..3
Figure 4.1 Mental model coding list………...……….35
Figure 4.2 Drawing products of participant A……….….….…37
Figure 4.3 Drawing products of participant B………..…….38
Figure 4.4 Drawing products of participant C………..…….….….…..39
Figure 4.5 Drawing products of participant D……….……..40
Figure 4.6 Drawing products of participant E……….………….…..40
Figure 4.7 Drawing products of participant F……….………….…..41
Figure 4.8 Drawing products of participant G……….……….…….42
1
Chap.1 Introduction
In this industrial society, educational issues have always been at the center topic of public attention. However, it is not the learning or knowledge construction per se but the highest educational degree as the core of the societal or parental concern. For many parents, degree/diploma is the most significant that their children can get from schooling. Their rationale is that if one wants a good job, good wealth, good spouse, good family - all elements of a “good life”, (s)he needs to pass high stack examinations and go to quality schools/universities as the first start. This is why most parents focus on the learning outcomes of their kids and why many teachers could not but react to this urge. For a long time in Taiwan education system, a great emphasis is placed on examination outcomes while the classroom teaching inevitably aims solely at the evaluation of competences and the competition to place students on the top in the high stack examinations. Among a classroom, only a small proportion of students can be the winner; unfortunately, most students have to take the cruel facts that they are the losers at daily base. Educators have observed and criticized that the test-oriented teaching goal has led the students to react passively, lost learning interest and do not fully engaged in learning.
The outcomes from TIMSS and PISA both show that Taiwanese students performed impressively in science but possessed low interest and inference ability compared with students from other countries that exceled (李哲迪, 2009; 林煥祥, 劉 聖忠, 林素微, & 李暉, 2008; 張殷榮, 2001). This evidence could support my notion that our students do not learn for understand but for gaining higher score and keeping up steps with others. Though Confucius (孔子, B.C770-B.C476) has stressed that “obtaining knowledge is a personal pleasant moment” but for most Taiwan
2
secondary school students it is no longer true. “As a man sows, so shall he reap” was the true meaning of education; it is gradually forgotten by parents, teachers and students. Teachings for all and everyone should gain deep comprehension are less worthy noticing in nowadays
I have also observed the same situation in my class experiences, and wondering if there is a solution to deepen students learning but not just memorizing. Coincidentally, I read about a journal paper advocating that drawing is a good method for science learning. Additionally, numerous outstanding scientists have famous for their use of drawing as the aid in constructing their thinking process and the prototypes of their profound scientific breakthroughs. For example, Leonardo da Vinci, Isaac Newton, Richard Phillips Feynman and even Albert Einstein all are famous in using drawing as a comprehension tool and note-taking method. Their precious notes were preserved as a treasure for all human being until today and offer us new perspective of how should we learn science (figure.1.1, figure 1.2, figure 1.3, and figure 1.4 as examples).Though drawing was viewed completely incompatible with science learning for Taiwan parents and teachers, drawing still has its importance in Science learning.
Figure 1.1 Da Vinci’s note
Figure 1.2 Newton’s note
3
I remember that in my early age, drawing is a very important and effective way when I attempted to solve problems and summarize concepts in textbooks. Personal experiences inspire me that drawing is a good tool to select critical information, clarify and organize concepts and integrate miscellaneous information into knowledge. It is also a tool to support my learning in science and math. Later on, in college years, my major was art and visual design. The professional training in visual design facilitates my ability to express critical ideas through visual elements. Above are the joint reasons that encourage me to study how to help students learn science through drawing. I appreciate that I have a chance to share the joy of learning by drawing and hopefully more students who are still struggling and suffering from learning could reduce their negative attitude towards science class.
Learning by drawing was studied flourishingly in 1970s; however because the research displayed mixed or even dispointed results (Lesgold, Levin, Shimron, & Guttmann, 1975; Snowman & Cunningham, 1975), it has grinded to a halt in the 80s. These early reseach fronts emphsized on drawing for the memory of narratives/stories
Figure 1.3
Feynman’s note
Figure 1.4 Einstein’s note
4
and the research method/design was critized by van Meter and Garner (2005) as poor. However, some educators in recent years have gradually realize that drawing could be a concept organizer, argumentation simulator or mental experiment laboratory. From previous research (Ainsworth, Prain, & Tytler, 2011; Prain & Tytler, 2012), I found three reasons why students could draw to learn science: Drawing could enhance engagement, represent scientific ideas and indicate reasoning process. First of all, when drawing is used in class as a strategy to learn, students are forced to explore, to justify and to learn actively by drawing which frequently motivates them to participate more than in the conventional classrooms where students must sit patiently, silently and learn passively. Secondly, asking students to draw along reading science expository texts requires an active participation of selecting main elements, observing the phenomenon, explaining to them own and constructing the whole systematic mental model of the must-learn concepts. The drawing process makes the learners explain the content visually, concretely, and so clearly. Last but not the least, asking students to reason about science concepts by drawing could actively engage them in constructing science argumentation or mental experiments to produce science knowledge. Learners can generate their own illustrations to reason about the text and deepen their comprehension (Van Meter, Aleksic, Schwartz, & Garner, 2006) and at the same time, clarify their understanding of the topic. Students integrate the new information and the existing prior knowledge and then make new inferences. Also, drawing makes thinking visibly that it becomes a mental simulation platform to formulate inner experiments or even conduct imagery trials. These factors make drawing a useful way for scientific learning.
The current research agenda about “draw to learn” had been re-verified and the term was renamed as “Learner-generated drawing” (hereinafter LGD) (Mayer, Steinhoff, Bower, & Mars, 1995; Schwamborn, Mayer, Thillmann, Leopold, &
5
Leutner, 2010; Van Meter et al., 2006). Scientific domains have welcomed the use of LGD so far and are gradually establishing the crucial status of LGD in science learning (Ainsworth, Prain, & Tytler, 2011). The reason that science educators accept drawing as an instructional strategy partially because drawing is capable to reflect and facilitate the quality of mental model which is highly correlated with science concepts. Drawing involves the process of information negotiating, problem solving and also transfer. The study of beginners’ drawing could deepen our understanding of the way learners study science (Ian, Miles, & Alister, 2003). What’s more, after the drawing products been generated, previous researchers suggested to use some external supports to guide the learner’s metacognitive process so that learners have a chance to reflect mistakes possibly made (Van Meter, 2001; Van Meter et al., 2006; Van Meter & Garner, 2005). Due to the aim of meaningful learning that I personally agree with, LGD is to facilitate higher-order learning outcomes, in my study higher-order assessments will be used to detect this type of learning outcomes.
At the end of first year in graduate study, with passion of drawing and ambition to be a good teacher, I attempted to do a final project on “whether drawing could be an effective learning strategy for all students” as the pilot study for my research. I chose junior high students as the participants, carefully selected a topic of human circulatory system which needs the aid of visualization, designed a theory-driven (selection-organization-integration, SOI principle proposed by Mayer, 1999) process and an elaborative text material. At that time I felt that my well-prepared drawing strategy would work perfectly for lovely junior high schoolers. Unfortunately, I was defeated by a whole class of non-motivated or anti-motivated students barely willing to draw. A small amount of students, who did follow my instruction to draw, showed very low level of drawing capacity. At the confusion crossroad, I repeatedly reflected what have gone wrong in my instructional attempt and re-read previous studies of
6
drawing strategies. I came into some temporal conclusions that (1) due to the universal phenomenon; drawing is always regarded as an “art representation” but not a learning tool and was ignore in Taiwan education system. Many students are passive drawers who are not willing to construct the knowledge actively. (2) Some students have either no enough drawing skill or no experience to use drawing as science learning strategy; therefore, no improvement had shown though their drawing process. (3) My instructional approach needs substantial modification and reorganization to teach students to draw step by step. I decided to change my research topic as “to develop effective procedure and material based on drawing strategy for learning science topic which is highly related to visualization”.
Evidences have shown that LGD assists students to deepen comprehension of the presented text and built constructive mental model; however, this strategy is not always beneficial unless providing external supports. LGD could be used as a “pure” or “with support.” A pure LGD refers to that students receive a text purely directing students to draw; whereas the supported LGD refers to those students receive extensive aids (such as teacher provided feedback illustration or prompting questions) after drawing. Limited research has explored the issue about “Is an effective LGD necessary to be taught?” In most of the previous studies (Van Meter, 2001; Van Meter et al., 2006; Van Meter & Garner, 2005), the researchers merely reported that they asked students to draw a figure as it could appear in a science text book. It implied that most researchers believe that students could draw naturally and accurately without instruction. However, the pilot study revealed that drawing capability of the learner is an influential variable. Just like many learning strategies to be effective, students need explicit instruction (e.g., Selçuk, 2009).
According to the previous theory, the researcher dedicated to examine what are the additional aids necessary to accompany with this drawing strategy. In Biology,
7
there are many topics relate to animals/human body structures and functions that emphasize visual components. Drawing diagram has an effect of actively transforming abstract-vague concepts into concrete-clear. There will four groups of (1) pure drawing (LGD) group (group D), (2) drawing with “Illustration feedback (Group DI),” (3) drawing with “illustration feedback and prompting questions,” (Group DIP) and (4) drawing with “illustration feedback, prompting questions and explicit instruction. (Group DIPE)”
This study used “learner-generative drawing” as the term of learning through drawing because I emphasize students’ active role in learning science. As the discussions above, the main purpose of this study is that “what are the additional supports necessary to accompany with LGD for the best learning outcome?”
8
Chap.2 Literature Review
2.1 Learner-Generative Drawing
1. Theory Base and Cognitive Process of Learner-Generated Drawing
Learner–Generated Drawing (LGD) is one of learning strategy which we expect to have benefits on the learners understanding. To investigate the theoretical foundation underlying LGD, we could introduce the operations of this strategy more specifically and clearly. Proved by previous research (Schwamborn et al., 2010; Van Meter, 2001; Van Meter et al., 2006; Van Meter & Garner, 2005), LGD is effective to enhance deeper comprehension on the must-learn text (Leutner, Leopold, & Sumfleth, 2009); however, why LGD is capable to deepen understanding has become a crucial role in this investigation.
Researchers suggest that LGD could bring out meaningful learning. Constructivists claim that “learning only occurs when learners construct their own knowledge and think reflectively when information presents” (Hsieh & Cifuentes, 2006; Lee, 1997). Wittrock (Wittrock, 1989, 1992) also asserted that a successful learning requires learners to generate the meaningful relationship among the parts of the text, between the text, knowledge and experience actively and dynamically. What’s more, by conducting this process, learners could combine prior knowledge and new information; that is, they could reorganize, conceptualize and elaborate the relations, which increase the level of comprehension. Another statement was advocated by Mayer (1995) who also regards learning as a constructive process in which learners select and build cognitive connections among pieces of knowledge actively and integrate within their own past experience. In brief, meaningful learning emphasizes that learners integrate new and exist information actively; therefore, learners could have better achievement (Peper & Mayer, 1978, 1986).
9
Accordingly, three cognitive conditions for meaningful learning were proposed by Mayer (1995), which composited Wittrock’s Generative Theory (1974), Pavio’s Dual-coding Theory (1986) and Mayer’s Theory (1993). Verbal and non-verbal modalities are working simultaneously. First, learners have to select the crucial elements from the presented text. Secondly, they organize the selected information to build up an internal model of the text. Last but not the least, they integrate the internal nonverbal representation of the text information and connect it with the verbal representation and with relevant prior knowledge. Worth noticing, the product of the combination could be viewed as the students’ mental representation. Meaningful learning consists of building coherent metal model and can be measured by transfer performance (Mayer et al., 1995; Schwamborn et al., 2010).
Learner-generated drawing is the cognitive process which could be regarded as a metacognitive strategy (Schwamborn et al., 2010). By drawing, the students have to translate the verbal and nonverbal information into a picture which represents spatial relationship among functional elements. Therefore, learners have to engage in the presented text more than usual and to foster deeper comprehension. In line with above theories, the learning outcome of meaningful learning should not be measured by low level assessment - but have to be recorded by the higher level mental model (Leopold & Leutner, 2012).
Mental model is the representation of understanding structure in one’s mind which is private and use to describe and explain the target phenomena (Johnson‐Laird, 1980). Mental model could also be deemed to the inherent structural features that are associated with the contents that they presented by structural or functional analogy and allow learners to manipulate the model and read off relational information (Azevedo & Cromley, 2004; Fiore, Cuevas, & Oser, 2003; Gadgil, Nokes-Malach, & Chi, 2012; Hubber, 2006). By the definition, mental model development reflects
10
students’ condition of learning, the level of the information constructing and interacting status represents the mental model of the learner. Therefore, mental model provides a basis for drawing inferences and also enables the learners to generate new inferences for developing a deeper comprehension of the presented text (Butcher, 2006; Fisher & Harris, 1973; Ian et al., 2003; Van Meter, 2001).
I propose that LGD and the level of mental model are highly connected which LGD is a kind of mental focus strategy and assist learners to represent the features and relations structurally analogous to those reference contents. The higher level the mental model a student possesses the deeper comprehension one has. In this study, I examined the mental model level that showed in hand drawing to investigate how accurate is the learner’s comprehension and what the gain through LGD.
2. Learner-Generated Drawing Strategy
Scientists use words and diagrams, graphs, photographs and other images to make discoveries and explain findings. However, in many science classes, drawing is mainly used in a passive manner: Teachers often ask learners to copy or interpret others’ visualizations. It is rare that teachers encourage students to actively create their own visual forms of science concepts or to develop understanding. Is it beneficial that science teachers challenge students to draw more?
Learner-generated drawing (LGD) is defined as a learning strategy in which learners are given to read a text and to draw illustrations that correspond to the main elements and relations describe in each portion of the text (Schwamborn et al., 2010). LGD often is goal-directed, could be used to organize knowledge and when matched to the text, improves learning (Paris, Lipson, & Wixson, 1983). “Drawing” in LGD is intended to look-like or to accurately share a physical resemblance with the object(s)
11
that the drawing depicts. “Learner-generated” means that the student is the primary causal agent in the construction and the appearance of the drawing. Student constructs drawings by free hand using only tools such as blank paper and pencil.
Unlike ordinary drawing or sketching, LGD is a learning strategy in which learners’ intention are more than just to portrait the outline of the topic and contents into visual form, also they have to illustrate functions, structures and relations between important visual elements (Van Meter, 2001). By means of LGD, a learner could systematically construct the contents; more importantly, this strategy is capable to strengthen the learners’ knowledge structure of text and create meaningful learning (Hsieh & Cifuentes, 2006; Van Meter et al., 2006). In this study, LGD refers to as a strategy which assists students to construct structural spatial relations of the presented concept, which makes LGD more than just an art representation.
Some researchers (Ainsworth et al., 2011; Schwamborn et al., 2010; Van Meter, 2001; Van Meter et al., 2006; Van Meter & Garner, 2005) claimed that by the process of representing concept visually, adding functions, constructing structure and linking relations between elements in generative drawing, learners are asked to engage, represent science main ideas and make critical reasoning and argumentations. To be specific, learners have to translate different information into verbal and visual forms and then demonstrate the spatial relation among the functional elements. Additionally, this cognitive process might require the students combining the new incoming information and the previous acquired information.
Although LGD received some attention in the 1970s, research interest dried up by the mid-1980s. It could be attributed to mixed findings and a body of research which is rather disappointing (Lesgold et al., 1975; Snowman & Cunningham, 1975). Nevertheless, with the role of students change by time, drawing to construct learning studies has restored. For example, Van Meter (2001) investigated whether drawing
12
could improve 5th and 6th grade students’ recall of complex scientific topic (central nervous system). They found drawing could improve students’ engagement in self-monitoring of comprehension. This research team conducted a similar study in 2006 with improved research method (Van Meter et al., 2006). Again they found that drawing strategy could assist learning and promote the learner’s metacognition. In line with Van Meter, Leopold & Leutner (2012) also showed that students learned better on chemistry concepts by drawing strategy. Related results could be seen in Hsieh’s research about the benefits that student might get and the importance of this strategy (Hsieh & Cifuentes, 2006).
3. Accuracy
To assess quality of the LGD, this study intended to measure the accuracy of the drawing product produced during drawing treatment. Accuracy was defined as “the degree to which complete drawing resembles the presented object”. Van Meter and Garner (2005) suggested to use accuracy of LGD as an important indicator of knowledge construction and till now only limited evidence has been reported (e.g., Schwamborn et al., 2010). In order to produce accurate drawing product, I expect the treatment main effect is critical while learners’ prior knowledge and motivation should also play an important role. The first hypothesis is that pre-model, Questionnaire of Current Motivation (QCM) and the treatment were expected to influence the learner’s accuracy.
2.2 External Support
According to the previous studies (Alesandrini, 1981; Van Meter, 2001; Van Meter et al., 2006; Van Meter & Garner, 2005), evidences have shown that LGD
13
assists students to deepen their comprehension of the presented text and will built constructive mental model; however, this strategy is not always beneficial unless providing external supports. LGD could be used as a “pure” or “with support”. A pure LGD refers to that students receive a text purely directing students to draw; whereas the supported LGD refers to those students receive extensive aids (such as teacher provided illustration or prompting questions) after drawing. Previous experiments of LGD separated the external supports (feedback after drawing) into illustration only and illustrations with prompting questions.
Van meter (2001) and her series of studies have proved that learners who had received external supports engaged in more self-monitoring events and they tended to detect and correct more comprehension errors than those who received no external supports (Van Meter, 2001). Moreover, researchers (Alesandrini, 1981; Lesgold et al., 1975; Van Meter, 2001; Van Meter et al., 2006) suggest that there are three functions of external supports:
(1) To constrain the construction of drawing (direct attention to differentiate the relevant from the irrelevant); thus, learners would not be deviated from the text. (2) To guide the students selecting and focusing on key elements and relations among the text contents.
(3) To prompt checking and correcting learner’s drawing (monitoring and regulation). By comparing the learner’s generative drawing and the prompting illustrations, students could detect their misunderstandings and make adequate correction, which increases the accuracy of students’ mental model.
Most of the studies (Butcher, 2006) claimed that external supports have benefits on students learning while using the drawing strategy. For example, serial studies of Lesgold et al (Lesgold et al., 1975) found that construction process plus handout of accurately organizing figures and background knowledge produced significant
14
benefits. Alesandrini (Alesandrini, 1981, 1984) emphasized that learners required additional instructions and supports to attend to how each structure fits into the complete system. Only generative drawing is not enough for learners. When a student is able to compare the structural and functional resemblances between the external supports and ones’ own drawing that would be a very important feedback about the complete schematic concepts, the alternative concepts that one may have acquired and the conflicts between the schematic concepts and the alternative concepts. This feedback if received by highly motivated students would help modify his/her mental model to show higher accurate scientific knowledge. Van Meter (Van Meter, 2001; Van Meter et al., 2006; Van Meter & Garner, 2005) has showed that in the group received external supports, students demonstrated higher accuracy and gain more knowledge. In this series of research, treatment were assigned into four levels, including (1) reading only (no draw), (2) draw (pure LGD), (3) IC (inspecting illustration handout after drawing and able to correct) and (4) PIC (inspecting illustration and prompting questions and able to correct). Fifth and sixth graders performed better and better in terms of deeper level of comprehension (free recall, drawing accuracy, self-monitoring and so on) along with the increasing levels of supports from IC to PIC.
Mayer (1984) suggests three types of supports, which is, supports having various cognitive functions. The study divided the supports into (1) selecting supports, (2) building internal connections supports and (3) building external connections supports. Selecting supports focus on the target information and serve to the learners certain aspects. By giving the selecting supports, the learner would construct the facts propositional representation of the information. The building internal supports foster the learners to organize the information into the structures. Building external connections supports are designed to help the reader build connections between the
15
ideas in the text and an existing mental model, thus integrating these new ideas into leaner’s existing priori mental model (Mayer, 1984; Resnick, 1982). These aids support the construction and extension of the mental model based on the propositional representations.
In many related studies (Schwamborn et al., 2010; Van Meter, 2001), researchers offered two levels of supported sources to ensure if the level of aiding could influence the outcome. In the same line, I differentiate external supports into three levels that would be compared with the pure drawing (LGD) group to examine what kind of components are required for LGD to be effective. This study claimed that external supports should be used with the most accurate visualization feedback that would the static features and dynamic functional purpose. There will be four treatment groups in this study.
(1) Pure drawing or LGD group (D).
(2) Drawing with “Illustration feedback” group (DI): After students’ active drawing, the experimenter offers hand–drawing figure with keywords of organs and organization of the human circulatory system which assumed to be capable of providing embedded cognitive supports of “selecting main points” and “internal supports to present a visualization that integrates main concepts.”
(3) Drawing with “illustration feedback and prompting question” group (DIP): After active drawing, students are given illustration embedded with directional-spatial cues and text-questions asking for allocating attention to main points (functional and directional information) in the illustration and meta-cognitive refection. (4) Drawing with “illustration feedback, prompting questions and explicit instruction”
group (DIPE): The experimenter explicitly presents all the cognitive supports described above and encourage students to actively practice drawing under teacher guidance”
16
However, “Prompting questions” are more like the combination of the selecting, internal and external aids. I expected that the group with “Prompting question” would perform better than “Illustration”. Accordingly, the second hypothesis is that when a learner is provided with external supports of illustration feedback, the effect would be mainly on the performance of post factual retention test but the effect on transfer test and post mental model would be limited. But when it comes to the third hypothesis, that learner were given the prompting questions, (s)he would demonstrate more accurate and constructive drawing outcome and deeper comprehension than the one who does not obtain external support. For some students who are not good at drawing, have lower visualization capacity, or are more skillful in use of other strategy other than drawing who may need explicit instruction about why and how to do draw.
External supports in this study will be differentiated as “illustration feedback”, “prompting questions in addition to illustration” and also given “instruction” before LGD. According to the pilot study and the observation in class experience, I believe that students in Taiwan had less chance to conduct drawing activity and lack of interest. By instruction, students could not only be explicitly introduced to how to select, organize and integrate main points in to a visualization representation, but also given chances to practice. I expect this explicit instruction could build up confidence of the participants which may enhance students’ active engagement. That is, the
fourth hypothesis, receiving instruction would benefit on the learners’ understanding
revealed from all three post-tests. Additionally, through the instruction, learner could perform the best among other groups.
17
2.3 Characteristic of the posttest
In addition to the prompting feedback, the different formats of posttest might also be an influential factor on the result of LGD. In the learning psychology research, researchers use different posttests to investigate distinct leaning outcomes and displayed three widely-used characteristics, factual retention, transfer test and mental model. The question is, do the assessments really sensitive enough to examine the real knowledge acquisition? Or do the assessment methods fit the expected purpose? According to the generative theory, LGD leads to the construction of higher-order mental model, which means learners actively integrate prior and existing knowledge, make inferences and apply newly learned to new situations. However, verbatim assessments could only measure factual retention but not to test the structural knowledge from the must-learned content. Only appropriate assessments will be expected to detect the acquisition of the constructed knowledge. Both transfer and mental model test could be regarded as suitable assessments to measure ability of inference and application; however, retention test is reveals to measure the factual knowledge acquisitions. Overall, Generative drawing should be tested by transfer test and mental model; however, retention tests are measuring the factual learning outcomes of LGD (Van Meter et al., 2006).
The mixed results about LGD functions in the previous studies might be partially caused by various posttests adopted by different researchers. In the study of Snowman and Cunningham (1975), they used multiple-choice that requires factual retention and so demonstrated little effect of LGD. By contrast, Dean and Kulhavey (1981) claimed that the map drawing activity had benefits for learners with free-recall posttest. Similarly, Alesnadrini (Alesandrini, 1981, 1984) used constructed format to test college students’ comprehension and application to investigate if constructing
18
drawing could deepen participants’ understanding toward the cell battery. In Pepper and Mayer’s (1986) study, students involved in generated activity (similar to the LGD) and the learners who drew and performed better on the transfer or problem-solving tests but not on the factual recall. Van Meter’s studies (Van Meter, 2001; Van Meter et al., 2006; Van Meter & Garner, 2005) displayed the same results. Investigating whether LGD could improve science comprehension of elementary students, Van Meter placed participants to different conditions and gave different treatments; the effect of LGD only showed in constructed tests but not in lower one.
To ensure the effect of generative drawing, I expect characteristics of the posttest would play an important role in this study. I will try to identify various learning effects and will use three types of posttest including retention test, mental model test and transfer test to collect more aspects of the learning acquisition.
According to the previous research and hypothesis, this study proposed four research questions in below to examine the effect of LGD.
1. What prior factors (treatment, prior knowledge, pre-mental model and motivation) would influence learner’s accuracy in various treatment groups?
2. Is there a significant main effect of illustration feedback on the performance of the posttest?
3. Is there a significant main effect of prompting questions on the performance of the posttests?
4. Is there a significant main effect of explicit instruction on the performance of the posttests?
19
Chap.3 Method
3.1 Participants
This study had recruited 96 college students as the participants of this study (53 undergraduates, 39 graduates and 4 Ph.D.). Participants were from schools of Kaohsiung and Hsinchu cities to increase the variety of student background (regional factor: north and south Taiwan). They are all non-science-related majors and expected to be cognitive mature enough to learn the biology alone but have not study biological issue for a while. Therefore, they have limited prior knowledge demonstrated in the pretest. There were 30 participants in group DIPI; 21 in group DIP; 22 in group DI; and 23 served in Group D. Description about group and treatments are in the following section.
3.2 Design
1. Independent Variable
There were four experimental groups given various levels of external supports with LGD. There were four different increasing levels of the external supports. Table 3.1 had demonstrated the descriptions of every each supports. 96 participants were randomly assigned to four groups listed in Table 3.2.
Table 3.1 Descriptions of supports
Pure LGD No external support
Illustration feedback Illustrations with labeled component keywords
Prompting questions 1. Illustrations with not only labeled component keywords but also directions and functions.
2. Five extra prompting questions about circulatory functions.
Explicit Instruction 1. A 30 minutes in-class course to teach students how to read and draw, including reading skills of selecting, organizing and integrating as well as mapping the main
20
points in the text into a visualized form.
2. An exercise of LGD with teacher’s feedback and guidance.
Table 3.2 Group assignment
Experiential group Description
Group DIPE:
Drawing
+Illustrator feedback +Prompting questions +Explicit instruction;
Participants had an explicit instruction about the why and the how of “Draw for science understanding” for 30 minutes, concluding how to select that main idea, how to organize and how to integrate. While reading the text the participants were asked to use LGD to learn and they received an illustration of the main concept and also received 5 prompting questions after drawing for 20 minutes (see appendix H).
Group DIP:
Drawing
+Illustrator feedback +Prompting questions;
Participants used LGD when reading science text. They also received an illustration of the main concept and also received 5 prompting questions after drawing for 20 minutes.
Group DI:
Drawing
+Illustrator feedback;
The participants used LGD when reading science text but did not receive the prompting questions, only illustrations to support understanding.
Group D:
Pure drawing
There will be neither instruction nor external support for the participants. They drew and read the text only.
2. Dependent Variable
This experiment will also assess three posttests matching as the Dependent Variables: retention test, transfer test and post mental model assessment. Different measurement of the posttest assessments would cause the outcome inconsistent.
(1) Retention Test
21
multiple-choice items. The questions will contain factual knowledge questions in multiple choice format, assessing the recognition and the ability of retain the facts in instructional materials.(Appendix F)
(2) Transfer test
This assessment is consisted of open-ended questions to test the learner’s ability to apply the newly learned contents to new situations and to make accurate inferences. (Appendix E)
(3) Drawing test (post mental model test)
To understand the quality of participant’s metal model, this assessment intends to test if participants have the whole systematic conceptual knowledge of the text by means of drawing. A high accuracy and constructive drawing representation is consisted with structures, functions, connections between elements (relations) and system.
3.3 Material
1. Text
The science text will contain two topics. In the first section of instruction, an approximately 800-words text on “Cell Hypothesis” (in Chinese) will be used with three paragraphs to present three important concepts. The instructional Power-Point presentation includes 11 slides with ten pictures to reveal the importance and procedure of the drawing construction. The second topic in the instruction will be “Circulatory System”. This text consisted approximately 1300 words, divided into six paragraphs about three main concepts. (Appendix A and Appendix B).
2. Booklets
22
booklet contains all the questionnaires and tests (4 pages). Additionally, the booklet of DIPE group includes extra 5 pages of the drawing instructing “Draw for science understanding” outline with a sample text of Cell Theory for drawing practice.
3. Illustration feedback
The participants in group DIPE, DIP and DI had obtained the Illustration of Circulatory System (heart, vessel and circulatory system) after the drawing. The illustration had labeled the keyword; however, had not labeled the directions and functions, which represents the selecting and internal supports. (Appendix C)
4. Prompting question
The participants in DIPE and DIP obtained the Prompting Questions of Circulatory System (heart, vessel and circulatory system) after the drawing. This support had included 5 prompting questions to guide the learners checking their figures and words. What’s more, conditions with Prompting questions would also receive the directions and functions of the illustration. Overall, the Prompting Question support could regard as a propositional support (with functions and directions) and also a metacognitive support (which ask student to check their original figure), which is similar with selecting, internal and external supports. (Appendix D)
5. Explicit instruction
The participants in DIPE received a 30-min explicit instruction about “how to draw efficiently to learn” before drawing. Participants were all taught the skills for reading and drawing with selecting, organizing and integrating. They all have a
23
chance to practice the topic “cell hypothesis” and teachers would give the feedback after the learners drawing.
3.4 Measure
1. Pretest
The Pretest includes demography questionnaire, prior knowledge test, pre-mental model evaluation, and a motivation questionnaire. .
(1) Demography questionnaire
It will collect the background information of the participants, such as id, school, place of residence, gender, educational background and the investigation of the whether learner had taken any the bio-related course.
(2) Pre-factual knowledge test
The purpose of this test is to examine participants' concepts about the terms and basic structures of Circulatory System. The correct answer in one blank gains 1 point and the highest score would be 14 (see Appendix E).
(3) Questionnaire on current motivation (QCM. Rhieinberget et al, 2001)
The motivation of learning science will be measured by Questionnaire of Current Motivation. This questionnaire is composed with 18 items of 7-point Likert scale.
(4) Pre-mental model test
This assessment is intended to test knowledge about structure of the circulation system and dynamic function conveyed in the text by means of drawing. The hand-drawing about the components, the whole system and the functions is regarded as the drawer’s mental model which reveals the level of the learner’s structure of knowledge. Learners were instructed to draw representational illustration (real life like) and every instructional procedure were all presented in
24
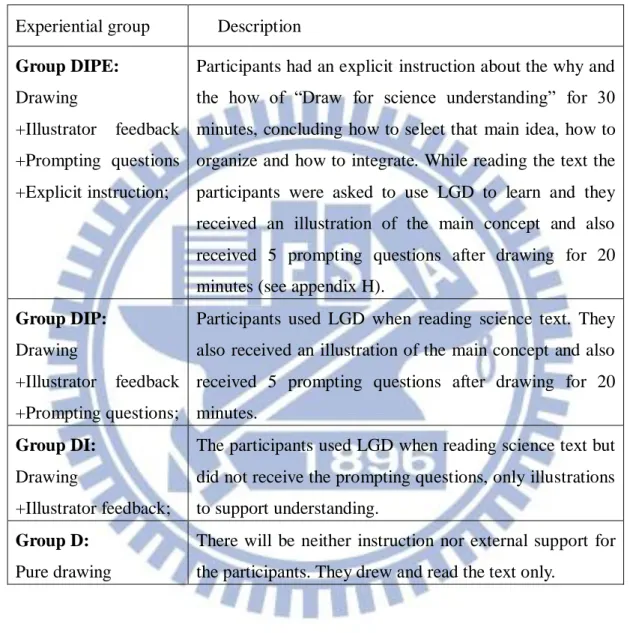
appendix H. Please draw a diagram with the quality that it could be included into science textbook. Draw Heart. Draw Blood and Vessel. Draw the Circulatory System of human being”. The mental model coding is based on the results of Butcher and Chi (Butcher, 2006; Gadgil et al., 2012) and researcher’s pilot study which would be distinguished into eight levels (in Table 1). The higher represents the higher accuracy and more constructive. A highly accurate and constructive drawing (mental model) would consist of correct visual elements, connections between elements, structures, functions, and the dynamic relations to form the systems. The pre-mental model were score by the researcher, a high school biological teacher and a student assistant from department of biomedical imaging and radiological science with reliable interrater of ICC=.98. Participants with no drawing was regarded as no understanding of the target-text and gained 0 points in level zero. Level 7 is the most complete mental model of the learners and reflected the one had totally understand the circulatory system and could earn maximum7 points.
25 Table 3.3 Mental model coding
score Level Explanation Illustration example 0 No loop No understanding No illustration 1 Ebb and flow/
Atrial and ventricular
Blood circulate or distinctions of the heart with Low-level purpose: oxygen transport. With partial structure and inaccurate links or flow directions.
2 Single loop Single loop with a circulatory of body with lower purpose. 3 Single loop with lungs or single loop with wrong description
Including the heart circulatory, the purpose of the transport and the lungs; however, lungs are not contain in the circulatory.
26 Table 3.2 Mental model coding (cont.)
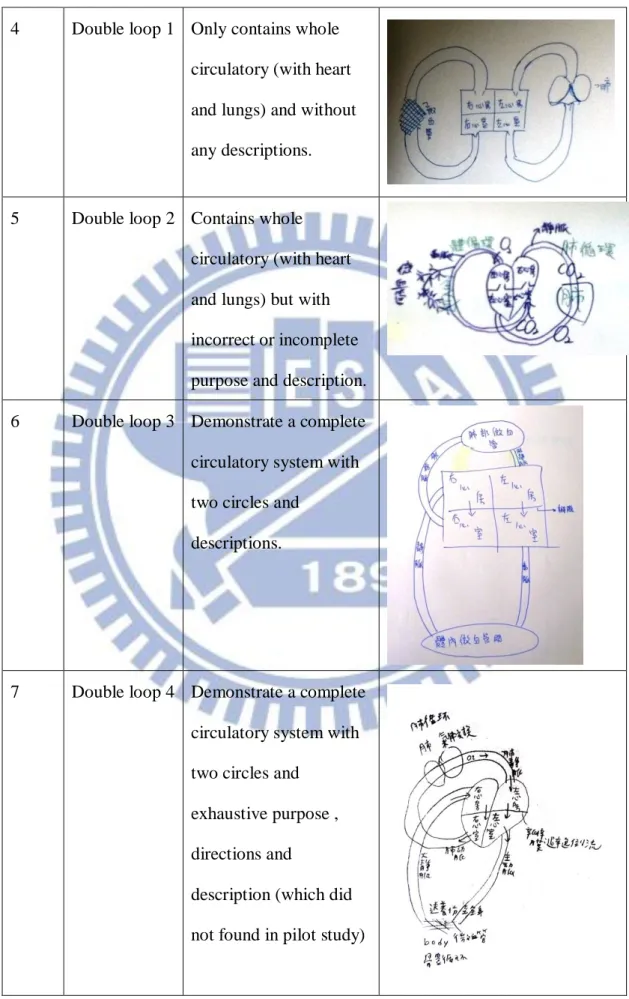
4 Double loop 1 Only contains whole circulatory (with heart and lungs) and without any descriptions.
5 Double loop 2 Contains whole circulatory (with heart and lungs) but with incorrect or incomplete purpose and description. 6 Double loop 3 Demonstrate a complete circulatory system with two circles and
descriptions.
7 Double loop 4 Demonstrate a complete circulatory system with two circles and
exhaustive purpose , directions and
description (which did not found in pilot study)
27
2. Accuracy
Accuracy is the product of the treatment and reflected the quality that the learner conducting LGD. This will be coded to examine the level of understanding. Rating methods are totally the same as the pre-mental model test in the pretest. The accuracy were score by the three experts and with reliable interrater of ICC (intraclass correlation) =.97. Participants could earn maximum7 points.
3. Posttest
The posttest score reflected the quality of learning outcome. I distribute three posttests to measure the dependent variables: Retention test, Transfer test and Post-mental model assessment. The Posttest took place right after the treatment.
(1) Post- transfer Test
There will be 5 open-ended questions to test the learner’s ability to transfer and apply the human circulation knowledge listed in the material to new situations. An example of the question states “John fell off and bruised, why didn’t he infected by bacteria? Why did he stop bleeding? Please try to explain and try to write down the reasons” The accuracy were score by the three experts and with reliable interrater of ICC=.90. Three points reflects the best understanding for each item so that participants could earn maximum 15 points in post-transfer test. (Appendix F)
(2) Post-retention Test
This multiple-choice test is intended to assess memory of the factual knowledge or recognition of the important concepts in the materials. An example is”How many organs involve in the whole complete human circulatory system?
28
An example is” What is the main purpose of the lung circulatory? (A)Gas exchange (B) Deliver the nutrients (C) Against the pathogens (D) expel the blood (Item A is correct). Please see Appendix G.
(3) Post-mental model test
The drawing construction test was intended to assess student’s comprehension and mental model by constructing illustrated representation. This drawing is intended to measure the learner’s mental model after the treatment. Every rating method was completely the same as in pretest treatment. The accuracy were score by the three experts and with reliable interrater reliability (Intra-class correlation, ICC) = .98. Participants could earn 7 points maximally.
4. Statistic
This research is tended to assess whether LGD is a useful learning strategy. I emphasized the effect of the strategy and compare with the posttest between different experimental conditions. I will conduct the statistic data by ANOVA to test if the main effects are significant and if there are interaction effect. Additionally, to investigate the influence of the treatment, I also conducted multiple regression analysis to investigate the association between the variables.
3.5 Procedure
Participants were randomly assigned to one of four conditions. Each learner was seated in individual seat. The participants from DIPE group were extra taught a lesson called “draw for science understanding” to effective use the Learner-Generative Drawing strategy for 30 minutes before the treatment. Next, the learners were given the demography questionnaire and the prior knowledge pre-test,
29
pre-mental model test and QCM (15 minute). After completing the pretest, students would receive the text and booklets for conducting LGD task. Group DIPE, DIP and DI were given appropriate supports after 20minutes and were able to revise their drawing by compare with the external supports. The Drawing group could have completely 30 minutes to draw. After the treatment, the posttest took place immediately; every participant could have 35 minutes to finish their posttest.(Appendix H)
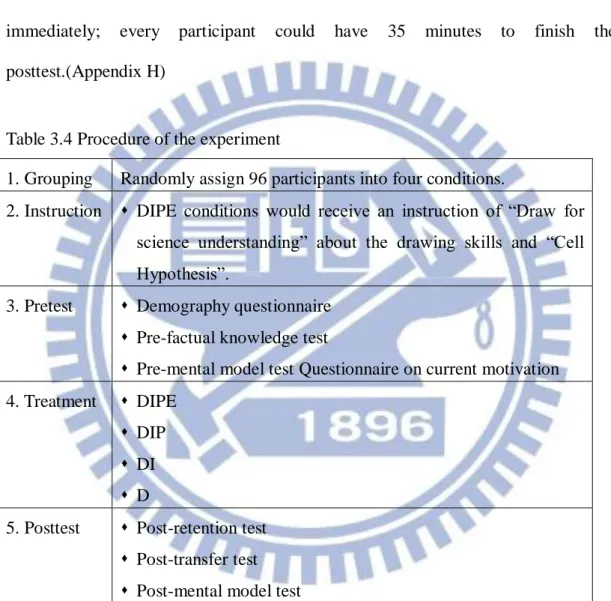
Table 3.4 Procedure of the experiment
1. Grouping Randomly assign 96 participants into four conditions.
2. Instruction DIPE conditions would receive an instruction of “Draw for science understanding” about the drawing skills and “Cell Hypothesis”.
3. Pretest Demography questionnaire Pre-factual knowledge test
Pre-mental model test Questionnaire on current motivation 4. Treatment DIPE
DIP DI D
5. Posttest Post-retention test Post-transfer test Post-mental model test
30
Chapter.4 Result
4.1 Tests of prior group differences
Before analyzing the main effect of the treatment, this study tested group differences of participants’ backgrounds, prior knowledge and motivation. The examination on group differences of gender was tested by χ2 analysis and the result showed that there was no significance among four groups (χ2=1.50, p=.22). Age difference was not found significance (F= (3, 92) =.49, p=.69, partial η2=.16) when testing by the analysis of variance (ANOVA).
Additionally, prior knowledge (pretest factual knowledge) (F= (3, 92) =.23, p=.87, partial η2=.008),pre-mental-model score (F= (3, 92) =.78, p=.51, partial η2=.025), and score of the Questionnaire of Current Motivation (QCM) (F= (3, 92) =2.49, p=.07, partial η2=.077) were all insignificant between groups. The descriptive statistics of pretest factual knowledge, pre-mental-model and motivation is demonstrated in Table 4.1.
Overall, the results indicate similarity among groups in their gender and age compositions, prior knowledge, and motivation.
4.2 Treatment effects
To examine the hypotheses of this study, an analysis of variance (ANOVA) was used to test the main effect on accuracy, retention, transfer and post mental model. Table 4.2 summarizes the descriptive statistics of the post-tests and post mental model score among four groups. Accuracy is rated by the drawing products when the
31
participants were receiving treatment, it did not showed a significant difference between grops, F = (3, 92) = 1.64, p = .18, partial η2=.06 (n.s.).
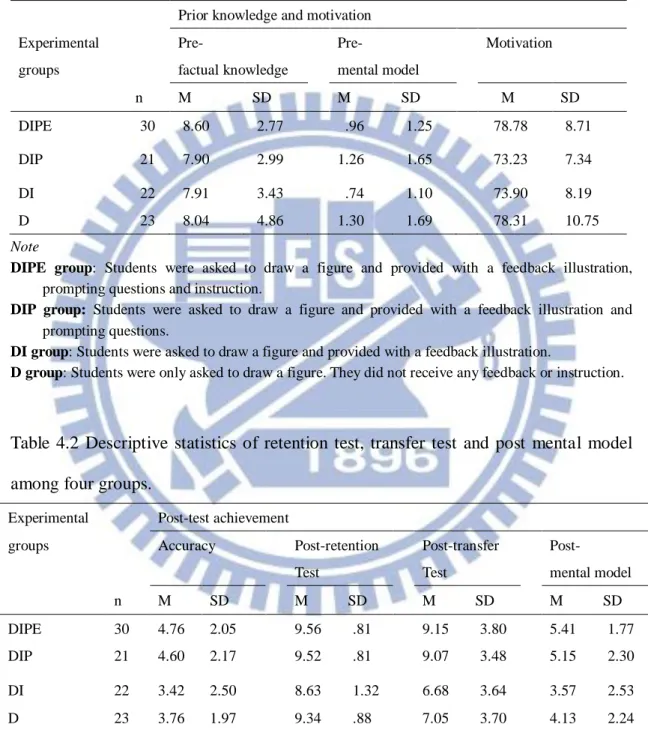
Table 4.1 Descriptive statistics of prior knowledge and motivation among four groups. Prior knowledge and motivation
Experimental groups Pre- factual knowledge Pre- mental model Motivation n M SD M SD M SD DIPE 30 8.60 2.77 .96 1.25 78.78 8.71 DIP 21 7.90 2.99 1.26 1.65 73.23 7.34 DI 22 7.91 3.43 .74 1.10 73.90 8.19 D 23 8.04 4.86 1.30 1.69 78.31 10.75 Note
DIPE group: Students were asked to draw a figure and provided with a feedback illustration, prompting questions and instruction.
DIP group: Students were asked to draw a figure and provided with a feedback illustration and prompting questions.
DI group: Students were asked to draw a figure and provided with a feedback illustration.
D group: Students were only asked to draw a figure. They did not receive any feedback or instruction.
Table 4.2 Descriptive statistics of retention test, transfer test and post mental model among four groups.
Experimental Post-test achievement
groups Accuracy Post-retention
Test Post-transfer Test Post- mental model n M SD M SD M SD M SD DIPE 30 4.76 2.05 9.56 .81 9.15 3.80 5.41 1.77 DIP 21 4.60 2.17 9.52 .81 9.07 3.48 5.15 2.30 DI 22 3.42 2.50 8.63 1.32 6.68 3.64 3.57 2.53 D 23 3.76 1.97 9.34 .88 7.05 3.70 4.13 2.24 Note
DIPE group: Students were asked to draw a figure and provided with a feedback illustration, prompting questions and instruction.
DIP group: Students were asked to draw a figure and provided with a feedback illustration and prompting questions.
DI group: Students were asked to draw a figure and provided with a feedback illustration.
32
Concerning the score of the retention posttest (multiple-choice items), the DI group achieved lower than the other three groups of DIPI, DIP and D, F = (3, 92) = 4.56, p < .05, partial η2=.129 (Table 4.3). A Games-Howell post hoc analysis shows that only retention score of the Group DI was significantly worse than it in the Group DIPI; retention scores in the groups DIPI, DIP, DI did not show statistical differences.
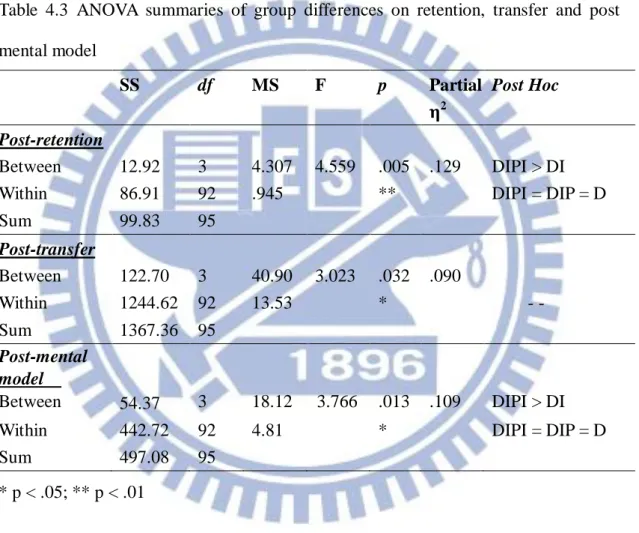
Table 4.3 ANOVA summaries of group differences on retention, transfer and post mental model SS df MS F p Partial 𝛈2 Post Hoc Post-retention Between 12.92 3 4.307 4.559 .005 .129 DIPI > DI
Within 86.91 92 .945 ** DIPI = DIP = D
Sum 99.83 95 Post-transfer Between 122.70 3 40.90 3.023 .032 .090 Within 1244.62 92 13.53 * - - Sum 1367.36 95 Post-mental model Between 54.37 3 18.12 3.766 .013 .109 DIPI > DI
Within 442.72 92 4.81 * DIPI = DIP = D
Sum 497.08 95
* p < .05; ** p < .01
In addition, there shows a significant treatment main effect on transfer test score, F= (3, 92) = 3.02, p < .05, partial η2
=.09. The Scheffe post hoc analysis showed that there is no remarkable difference between groups DIPI and DIP (transfer MDIPI = 9.15, transfer MDIP group = 9.07, t = .07, p = 1).
Regarding participants’ performance on post mental model, the result demonstrates a significant treatment main effect, F= (3, 92) =3.77, p < .05, partial
33 η2
=.109. A Game-Howell test shows that there is no significant difference between Groups DIPE and DIP again (post mental model MDIPI = 5.41, MDIP = 5.15, t = .19, p = .97). The LGD instruction seemed not effective to help DIPE students achieve higher than the DIP. However, MDIPI is significantly higher than MDI (t = 2.35, p = .05).
4.3 The comparative effects of prior knowledge, motivation and
treatment on accuracy
Multiple regressions were used to explore the effect of pre-test score, pre mental model score, QCM and treatment on accuracy. The multicollinearity diagnosis (correlation, tolerance and VIF) did not show any exceptional value. The result of this analysis had summarized in table3. The overall model R2=.26, reflected the strength of relationship between predictive variable and dependent variable was statistically significant, F (4, 88) = 7.59, p < .001. The model explained 26% variance of accuracy through prior knowledge, motivation and treatment.
Table 3 also shows the standardize estimate of regression coefficient and t value for each predictor as it entered the model. The effect reflected the standardized unit change in a predictor, controlling for other factors. Treatment, QCM and pre mental model had significantly impacted the results of accuracy; however, the pre-test did not. This result indicates that a participant with higher pre mental model and pre-motivation and receiving more supports during LGD process would perform better on accuracy. In conclusion, the supports (feedback illustration and prompting questions) seem to increase learner’s drawing accuracy during treatment; however, motivation towards the task and the participants’ integrative functional prior knowledge also play important roles in using this strategy for active learning.
34
Table.4.4 The predictive effects of treatment, motivation (QCM), prior knowledge on accuracy in a multiple regression analysis
Predictor Variable B B(SE) β t p
Treatment -.490 .177 -.255 -2.759 .007 QCM .045 .023 .184 1.991 .050 Pre-mental model .686 .161 .450 4.270 .001 Pre-factual knowledge test .037 .065 -.060 -.569 .571 Model R2 = .26 F (4, 88) = 7.59, p < .001
4.4 Qualitative analysis of the individual participant
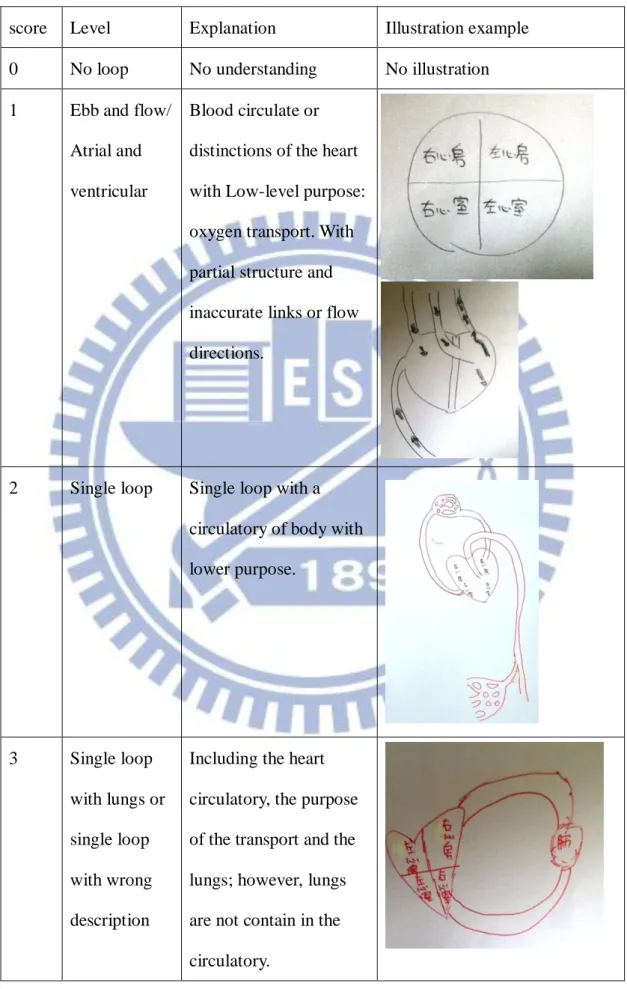
As mentioned in the method chapter, there was a pilot test conducted in a class of junior high school students asking them to learn human circulatory system with LGD. Their drawing products were used to construct a coding system for the evaluation of drawing products in the current study with non-biology major post-secondary students. Though the age and education level of the pilot study participants were different from that of the participants in this study; however, the range (level 0 to 7) of drawing quality which demonstrates the conceptual understanding of human circulatory system remained the same. I also found that the best drawing product quality (level 7), which no one achieved in the pilot study, appeared in this study. Table 4.4 depicts selected typical drawing products for 7 levels (e.g., 0 = circulatory system with no loop, 1 = ebb and flow/Atrial and ventricular, 2 =single loop, 3 = single loop with lungs or single loop with wrong description, 4 = double loop-1, 5 = double loop-2, 6 = double loop-3, 7 = double loop-4) of coding in this study.
35 Figure 4.1: Mental model coding list
0: No loop
1:
Ebb and flow/ Atrial and ventricular
2:
Single loop
3:
Single loop with lungs or single loop with wrong
36 Figure 4.1: Mental model coding list (cont.) 4: Double loop 1 5: Double loop 2 6: Double loop 3 7: Double loop 4
37
Eight cases selected from four treatment groups were listed in below for a further descriptive analysis. The observation of learners’ serial drawings could be used as another approach to validate the results obtained from the statistical analyses.
Group DIPE
Drawing products of participant A: a gradual LGD benefit learner
The drawing products of participants A showed that before DIPI treatment (drawing, illustration feedback, prompting questions and LGD instruction), the pre mental model was in the low level of 1; while the accuracy score during treatment showed pretty good improvement to a level of 5. But, from the observation note the author jot down, the author found that this individual mainly took note when reading and might allocate less time in the integration of text and drawing. When it came to the posttest, the participants had enough time to integrate text and image materials, the post mental model revealed a highest level of conceptual understanding.
Figure 4.2: Drawing products of participant A
38
Drawing products of participant B: a dramatic LGD benefit learner
This is the learner with the most dramatic transition pattern across the study procedure and there were quite many participants showed this remarkable change in group DIPI. Participants B had barley no understanding in the beginning test (pre mental model) but during the treatment the accuracy score showed B participant’s drawing achieved the best quality level of 7 and in the post-mental model the conceptual understanding was still the best. Even in the transfer test B gained 14 points.
Figure 4.3: Drawing products of participant B
Pre-mental model: 0 Accuracy: 7 Post-mental model: 7
Group DIP
Drawing products of participant C: learner with high quality knowledge
In the group DIP (drawing, illustration feedback and prompting questions), the participant C demonstrated having a high quality of knowledge in pre-mental model and there were no room for the progress. The content of participant C’s pre-mental model showed good understanding about component and organization of the circulatory system, only function of circulatory is missing. When it comes to the treatment accuracy, participant C had added the function and detailed description of
39
the circulatory system, which make the treatment accuracy and post-mental model perfect.
Figure4. 4: Drawing products of participant C
Pre-mental model: 6 Accuracy: 7 Post-mental model: 7
Group DI
Drawing products of participant D:could be give-up or poor understanding with poor motivation.
The participant D displayed poor understanding (level 0 to show no conceptual understanding of human circulatory system) all the way through pre-mental model, treatment to post-mental model. It demonstrated that this participant did not engaged in learning during the experiment.
40 Figure 4.5: Drawing products of participant D
Pre-mental model: 0 Accuracy: 0 Post-mental model: 0
Drawing products of participant E: an un-interpretable learner
Participant E did demonstrate a level 2 understanding of human circulatory system. However, the drawing product during the treatment process dropped back to level 0. I infer that he was not willing to engage in leaning. At the end of the experiment, the participant E displayed a level 4 understanding in the post-mental model. The learning transition is hard to interpret.
Figure 4.6: Drawing products of participant E