National intellectual capital in Israel and financial
crisis impact
Carol Yeh-Yun Lin*
Department of Business Administration, National Chengchi University,
64, Sec. 2, ZhiNan Road, Taipei (116), Taiwan Fax: (886)-2-29398005
E-mail: [email protected] *Corresponding author
Leif Edvinsson
Universal Networking Intellectual Capital, Posthusgatan 5, SE 761 30 Norrtalje, Sweden E-mail: [email protected]
Abstract: This paper expands our previous national intellectual capital (NIC)
research and examines the financial crisis impact. Based on ten years of data (2000 to 2009), Israel ranks number 8 among 41 countries. We also calculate the sustaining effect and boosting effect of NIC on GDP growth and GDP growth trend. Data analysis reveals that market capital and NIC are the two main factors that helped sustain Israeli GDP growth, whereas human capital and NIC are the two main factors that helped boost its GDP growth trend. However, during the financial crisis years (2007–2009), market capital and process capital together were Israel’s growth drivers. Israel advanced its NIC over the years, yet its financial capital decreased in terms of ranking. That is, the added value of Israeli NIC, particularly its renewal capital can be further enhanced.
Keywords: national intellectual capital; NIC; human capital; market capital;
process capital; renewal capital; financial capital; Israel, financial crisis.
Reference to this paper should be made as follows: Lin, C.Y-Y. and
Edvinsson, L. (2013) ‘National intellectual capital in Israel and financial crisis impact’, Int. J. Knowledge-Based Development, Vol. 4, No. 3, pp.245–273.
Biographical notes: Carol Yeh-Yun Lin is a Professor of Business
Administration at National Chengchi University in Taiwan. She received her PhD in Human Resource Development from the University of Texas at Austin in 1992. She has published extensively, with over 40 scholarly articles, six books, and 60 conference presentations. Her papers have appeared in the International Journal of Human Resource Management, Journal of Business Ethics, Long Range Planning, Health Care Management Review, Journal of Small Business Management, Journal of Psychology, and Journal of Intellectual Capital among others.
Leif Edvinsson is the pioneering contributor to both the theory and practice of intellectual capital. He was the world’s first Corporate Director of Intellectual Capital (IC) at Skandia of Stockholm, Sweden and prototyped the Skandia
Future Center as the World’s first Lab for IC. In January 1998, he received the prestigious Brain Trust’s (UK) ‘Brain of the Year’ award. He was listed by the London Business Press in 2006 as one of The 50 Most influential Thinkers in the World. He is listed in the global ‘Who’s Who’, an associate member of The Club of Rome, and co-Founder and Chairman of The New Club of Paris, which focuses on knowledge economy agenda.
1 Introduction
Over the past few decades, intangible assets, such as knowledge, patents, and innovation, have been identified as fundamental sources of wealth and progress. As knowledge assets contribute to a country’s growth and have significant implications for future national value, they represent the source of the competencies and capabilities deemed essential for national economic growth, human development, and quality of life (Malhotra, 2003). Consequently, countries rich in intangible assets fare better in terms of national wealth than those whose assets are limited to land, tools, and labour (Malhotra, 2003; World Bank, 1998).
The recognition that intangibles are one of the most important sources of prosperity and progress has prompted an increasing need for developing more understanding of intellectual capital; as a result, studies of intellectual capital and related topics have proliferated over the years. In addition to firm level studies, a number of intellectual capital assessments have also taken place at the national level (e.g., Sweden, Denmark, The Nordic Project, and Israel) and at the regional level (e.g., the Arab nations and the Pacific Islands studies) (Bontis, 2004; Bounfour, 2003; Schiuma et al., 2008; Stahle and Bounfour, 2008).
Although the assessment of national intellectual capital (NIC) cannot explain in full or predict an abrupt occurrence such as a sudden stock market plunge, currency depreciation, regional political strife, or global financial crisis, it did reflect a nation’s past efforts in terms of human resource development, national economic relationships, infrastructural investment, renewal capability building, and national financial management.
Israel attracts our attention mainly because as early as 1998, Pasher and associates (Pasher and Shachar, 2005) had conducted Israeli NIC study. In addition, Israel had a fast recovery from the 2008 global financial crisis even though it is a small, resource constrained, and politically unstable country. How did it achieve such a performance? Does intangible asset play a part in its economic development? These are the two questions we would like to explore in this study. Hopefully, our research findings can shed some lights for building a sustainable country.
With a major focus on Israel and the impact of financial crisis, a brief introduction of the country and its economic situation facilitates the understanding of our data analysis and research findings. Broadly speaking, Israel has a technologically advanced market economy. Its GDP, after contracting slightly in 2001 and 2002 due to the Palestinian conflict and troubles in the high-technology sector (dot.com bubbles), grew about 5% per year from 2004–2007 (CIA, 2012). Still maintaining a positive GDP growth in 2008, Israel slipped to negative GDP growth in 2009 (CIA, 2012). Although
Israel was not immune from the global economic crisis, its economy fared better than other developed economies with a relatively early recovery (Buchwald, 2009; CIA, 2012; Friedberg, 2009). The global economic downturn affected its economy primarily through reduced demand for its exports in the USA and EU (total 70% of Israeli exports). However, foreign direct investment (FDI) in Israel did not suffer from this economic downturn. In 2008, its FDI totalled US $10.5 billion, up US $500 million from 2007 and its high-tech companies have been able to raise US $2.08 billion from local and foreign venture investors, 18% above the US $1.76 billion raised in 2007 (Buchwald, 2009).
Throughout the crisis, Israeli manufacturers implemented flexible methods of employment, such as reducing overtime, collective vacations, and work week shortening, which enabled them to avoid widespread dismissals and retain skilled workers for future use (Brosh, 2011). During the financial crisis, leading international rating agencies such as Fitch, Standard & Poor (S&P), and Moody’s continue to express confidence in the Israeli economy. Recovery began in Israel’s industrial exports, immediately with the recovery in world trade, and was very rapid. As a result, the 2008 global financial crisis spurred only a brief recession in Israel (CIA, 2012; Rosenberg, 2010).
In what follows, we briefly introduce the concept of ‘NIC’ and present its measurement model and NIC rankings with a special focus on Israel. Attempting to enrich this field of study, this paper presents our most updated findings covering 41 countries with ten years data, spanning from 2000 to 2009. The value of a longitudinal study is that it offers abundant information for trend analysis, especially crossing the troubled years of 2008 global financial crisis. Hopefully, the findings of this ten-year national level intellectual capital analysis provide a direction for Israel as well as for other nations to benchmark and to make wiser intangible assets investment decisions in an era of knowledge economy.
2 National intellectual capital
During the past decade, knowledge assets and intellectual capital have been attracting an increasing amount of attention, not only from academics and CEOs, but also from national policy makers. A World Bank (1998) report points out that the adoption of policies to increase a nation’s intellectual wealth can improve people’s lives, besides giving them higher incomes.
Yet, a majority of intellectual capital studies have been analysed particularly from the interest of the business firms to explain the differences between the accounting value and the market value as possible basic source of competitive advantages in companies (Bontis, 2001; Edvinsson, 2002). Gradually, the firm level methodologies have been adopted to compare the intellectual capital indices at the national or regional level. However, the intellectual capital of a nation requires the articulation of a comprehensive system of variables that helps uncover and manage that nation’s invisible wealth. Past studies either propose models from a limited perspective (e.g., inputs or intellectual property rights) or models containing too many variables to be easily replicated for trend analysis. This paper presents a moderate set of NIC indices that are valid and can be easily replicated for follow-up studies.
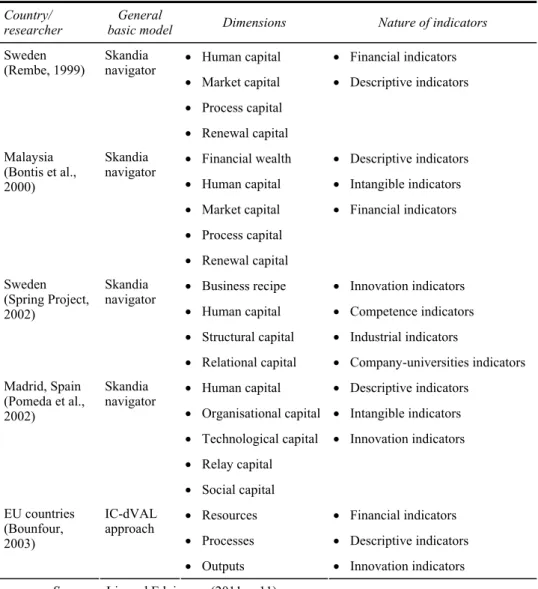
Intellectual capital is defined as “intellectual material – knowledge, information, intellectual property, experience – and is the roots for future earning capabilities” (Edvinsson and Malone, 1997; Stewart, 1997). The intellectual capital of a nation includes the hidden values of individuals, enterprises, institutions, communities and regions that are the current and potential sources for wealth creation (Bontis, 2004). In addition, NIC represents the management at a macro-economic level that gives direction to future economic development [Andriessen and Stam, (2004), p.11]. In the global competition, features such as educational system, international trade, infrastructure, and renewal capability affect national competitiveness and constitute the major components of NIC [Lin and Edvinsson, (2011), p.1]. Based on literature review exhibited in Table 1, this study selected five most commonly used components – human capital, market capital, process capital, renewal capital, and financial capital to represent NIC.
Table 1 Dimensions and nature of indicators for measuring NIC
Country/
researcher basic model General Dimensions Nature of indicators • Human capital • Financial indicators • Market capital • Descriptive indicators • Process capital
Sweden
(Rembe, 1999) Skandia navigator
• Renewal capital
• Financial wealth • Descriptive indicators • Human capital • Intangible indicators • Market capital • Financial indicators • Process capital Malaysia (Bontis et al., 2000) Skandia navigator • Renewal capital
• Business recipe • Innovation indicators • Human capital • Competence indicators • Structural capital • Industrial indicators Sweden
(Spring Project, 2002)
Skandia navigator
• Relational capital • Company-universities indicators • Human capital • Descriptive indicators
• Organisational capital • Intangible indicators • Technological capital • Innovation indicators • Relay capital Madrid, Spain (Pomeda et al., 2002) Skandia navigator • Social capital
• Resources • Financial indicators • Processes • Descriptive indicators EU countries
(Bounfour, 2003)
IC-dVAL approach
• Outputs • Innovation indicators Source: Lin and Edvinsson (2011, p.11)
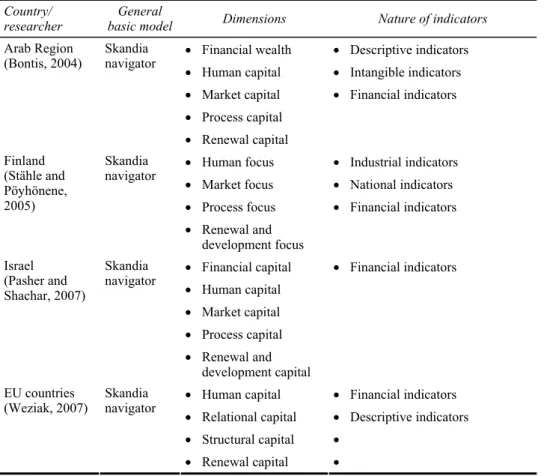
Table 1 Dimensions and nature of indicators for measuring NIC (continued) Country/
researcher basic model General Dimensions Nature of indicators • Financial wealth • Descriptive indicators • Human capital • Intangible indicators • Market capital • Financial indicators • Process capital
Arab Region
(Bontis, 2004) Skandia navigator
• Renewal capital
• Human focus • Industrial indicators • Market focus • National indicators • Process focus • Financial indicators Finland (Stähle and Pöyhönene, 2005) Skandia navigator • Renewal and development focus
• Financial capital • Financial indicators • Human capital • Market capital • Process capital Israel (Pasher and Shachar, 2007) Skandia navigator • Renewal and development capital
• Human capital • Financial indicators • Relational capital • Descriptive indicators • Structural capital •
EU countries
(Weziak, 2007) Skandia navigator
• Renewal capital • Source: Lin and Edvinsson (2011, p.11)
Expanded from the above mentioned five capital components, we propose a NIC measurement model and then test this model by using the widely accepted International Institute for Management Development (IMD) databases, which contain both quantitative and qualitative indicators.
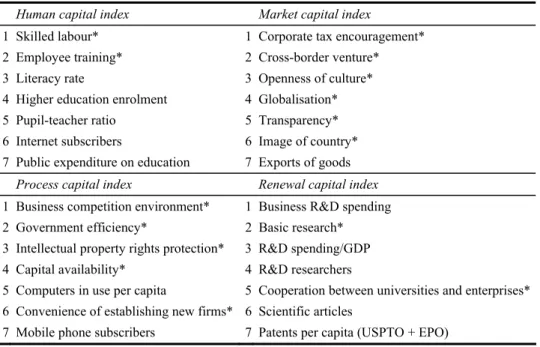
Indicators we used were decided in three rounds. In the first round, extensive literature review was conducted to come up with a long list of indicators as exhibited in Appendix 1. In the second round, variables that were used in relevant studies were matched with the IMD World Competitiveness Yearbook. Market capital turned out to have the fewest number of variables supported by previous studies. In the third round, a focus group was formed to obtain feedback regarding the appropriateness of the selected variables. With input from ten business school professors who also engaged in intellectual capital-related research, focal variables were finalised, as shown in Table 2. Financial capital is included as it is a key indicator of national wealth and represents the output dimension of the input-process-output theory. Balance in the number of variables for four types of capital (seven variables each, excluding financial capital) as well as in the number of quantitative and qualitative variables (14 vs. 15) was achieved.
Table 2 Variables in each type of capital utilised by this study Human capital index Market capital index
1 Skilled labour* 1 Corporate tax encouragement* 2 Employee training* 2 Cross-border venture* 3 Literacy rate 3 Openness of culture* 4 Higher education enrolment 4 Globalisation* 5 Pupil-teacher ratio 5 Transparency*
6 Internet subscribers 6 Image of country* 7 Public expenditure on education 7 Exports of goods Process capital index Renewal capital index 1 Business competition environment* 1 Business R&D spending 2 Government efficiency* 2 Basic research* 3 Intellectual property rights protection* 3 R&D spending/GDP 4 Capital availability* 4 R&D researchers
5 Computers in use per capita 5 Cooperation between universities and enterprises* 6 Convenience of establishing new firms* 6 Scientific articles
7 Mobile phone subscribers 7 Patents per capita (USPTO + EPO) Notes: Financial capital is the logarithm of GDP per capita adjusted by purchasing power
parity. Variables marked with an asterisk are rated qualitatively using a scale of 1–10.
Consequently, a total of 29 indicators were selected and explained hereunder. They include seven each for human capital, market capital, process capital, and renewal capital, and a single indicator (GDP per capita adjusted by purchasing power parity) representing financial capital.
The first type of NIC, human capital, is the competencies of individuals in realising national goals (Bontis, 2004). According to Organization for Economic Cooperation and Development (OECD, 2000), human capital consists of knowledge about facts, laws, and principles in addition to knowledge relating to teamwork, and other specialised and communication skills. Education is the foundation of human capital. The variables used in this study include the amount of skilled labour, the degree of employee training, the rate of literacy, the level of enrolment in institutions of higher education, the pupil-teacher ratio, the number of internet subscribers, and public expenditure on education.
The second type of national capital, market capital, is similar to external relational networking and social capital in a micro setting in that it represents a country’s capabilities and successes in providing an attractive and competitive incentive in order to meet the needs of its international clients, while also sharing knowledge with the rest of the world (Bontis, 2004). The present study takes into consideration investment in foreign countries and achievements in foreign relations, as well as exports of goods and services. In this study, the authors focus primarily on each country’s corporate tax encouragement, cross-border ventures, openness to foreign cultures, degree of globalisation, and transparency of economic information, as well as the image that the country projects abroad, and the country’s exports of goods.
The third type of national capital, process capital, comprises the non-human sources of knowledge in a nation. Embedded in a country’s infrastructure, these sources facilitate
the creation, accessibility, and dissemination of information. This type of capital is measured through fair business competition environment, government efficiency, intellectual property rights protection, the availability of capital, the number of computers per capita, the ease with which new firms can be established, and the number of mobile phone subscribers.
The fourth type of national capital, renewal capital, is defined as a nation’s future intellectual wealth and the capability for innovation that sustains a nation’s competitive advantage. Business R&D spending, basic research, R&D spending as a percentage of GDP, the number of R&D researchers, the level of cooperation between universities and enterprises, scientific articles, and USPTO and EPO (patent number recorded in both United States Patent and Trademark Office and European Patent Office) per capita are included in this type of capital.
The fifth type of national capital, financial capital, is represented by a single indicator: the logarithm of GDP per capita adjusted by purchasing power parity. This is the most common measurement of the financial wealth of a nation.
Using the indicators listed in Table 2, we collected data for 41 countries from the IMD World Competitiveness Yearbook. The data analysed in this paper, therefore, describes 41 countries over a period of ten years, spanning from 2000 to 2009.
In this study, there are two different types of data: data with an absolute value, such as ‘patents per capita’, and data with a qualitative rating based on a scale of 1 to 10, such as ‘image of country’. Although subjective, qualitative rating on the degree or magnitude of certain variables is unavoidable, as evaluating intangible assets cannot be fully represented by merely adding up absolute numbers. For a meaningful integration of the quantitative score and qualitative rating, the ratio of the absolute value relative to the highest value of each quantitative variable was calculated and multiplied by 10 to transform the number into a 1-to-10 score. The data transformation procedures have been repeated for all numerical indicators of human capital, market capital, process capital, and renewal capital. Financial capital is represented by the logarithm of GDP per capita adjusted by the purchasing power parity of each country, calculated its ratio to the highest value and then transformed it into a 1-to-10 score. The NIC ranking for 41 countries is shown in Appendix 2.
3 NIC of Israel
Israel recovered from the 2008 global financial crisis very fast, which triggered our interest to explore further concerning the potential connection between its NIC and economic development.
Based on Appendix 2 NIC ranking, Israel ranks number eight among a total of 41 countries. Particularly, Israel is strong in renewal capital and is ranked number five, very likely for its highest R&D investment of 4.86% GDP, comparing to Sweden 3.75%, Finland 3.5%, and Japan 3.44%. Its human capital is also fairly good and is ranked number six, very likely for its second highest educational investment of 8.3% GDP, next to Iceland 8.4% and followed by Mexico 7.5% and Denmark 7%.
The high degree of Israeli human capital and renewal capital has its background. Defence industries in Israel led its industrial sector in R&D and high-tech intensity through most of the first five decades of its existence. The country devoted a large share of its resources to defence purposes, putting a high priority on the development of
modern armed forces with sophisticated military technologies and equipment. This buildup for highly skilled workers, scientists and engineers affected public resources allocated to universities and research institutions. It was estimated that during the ‘80s, 65% of the national expenditure on R&D were defence related with only 13% oriented towards civilian industries; in addition, about half the scientists and engineers employed in the industrial sector worked in defence industries (Peled, 2001).
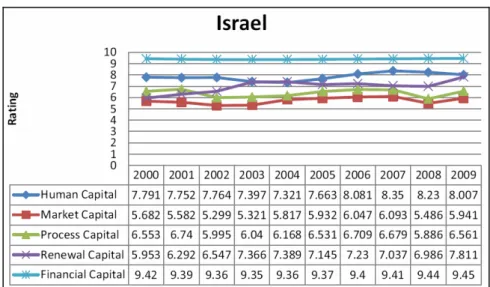
Figure 1 shows the NIC development in Israel over the studied ten years. Comparing the scores of 2000 and 2009, human capital and market capital have a little improvement; process capital and financial capital (based on 1–10 scale) are almost the same; and renewal capital has the greatest improvement among the five types of capital. Particularly, market capital and process capital declined in 2008 and bounced back a little in 2009 very likely influenced by the 2008 global financial crisis.
Figure 1 Trends of intellectual capital in Israel (see online version for colours)
According to a report submitted to Israel National Council for Research & Development Science [Samuel Neaman Institute, (2010), p.16], Israel’s success in leveraging scientific and technological R&D into economic growth can be traced back to the previously mentioned massive public investment in research and higher education after its independence in 1948. Harvesting from those investments, the development of manufacturing and service industries based on advanced knowledge, scientific and technological development and trained human resources has allowed Israel to attain impressive rates of economic growth, of which about one-third originates in knowledge-intensive industry.
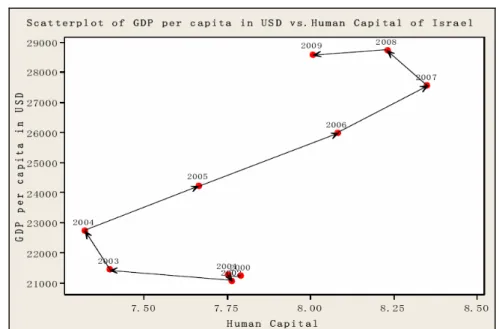
Figure 2 to Figure 5 indicate the co-development paths of capital components and GDP per capita (ppp) in Israel. Figure 2 shows that from 2004 to 2007, the higher the human capital the higher the GDP per capita (ppp). Although human capital decreases from 2007 to 2008, it still developed with the GDP growth (vertical progression). However, a further decrease from 2008 to 2009 has suspended its relationship with the economic development (horizontal regression). To further examine the main reasons of Israeli human capital decrease during the financial crisis, we revisited our raw data of each individual indicator over the studied ten years. Three indicators were found to have
a relatively large scale declines during 2007, 2008 and 2009, including higher education enrolment (9.26, 8.82, 7.16), pupil-teacher ratio (8.13, 7.41, 7.31), and internet subscribers (8.83, 9.17, 8.57). It showed that financial stress during the crisis had hindered Israeli education.
Figure 2 Scatterplot of GDP per capita (ppp) in USD vs. human capital of Israel (see online
version for colours)
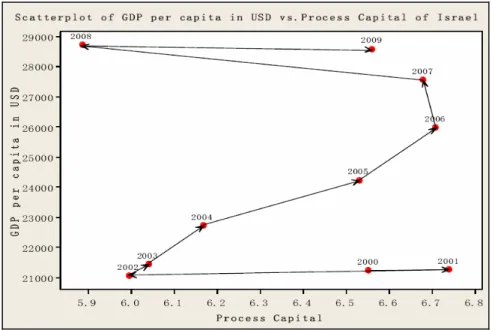
Figure 3 Scatterplot of GDP per capita (ppp) in USD vs. market capital of Israel (see online
Figure 3 also indicates that the higher the market capital the higher the GDP per capita (ppp) from 2002 to 2007. The sharp decline in market capital in 2008 and then bounced back in 2009 exactly reflected the effect of the global financial crisis, described in the introduction section. Our further analysis of the market capital raw data revealed that five indicators had a relatively large scale declines during 2007 and 2008 but rebounded in 2009. They are corporate tax encouragement (6.23, 5.12, 6.65), openness of culture (8.14, 7.86, 9.96), globalisation (7.73, 7.07, 7.13), image of country (6.05, 4.0, 5.09), and exports of goods (1.80, 1.64, 1.56). Apparently, trade-related indicators were impacted by the financial crisis.
Process capital exhibited in Figure 4 has a similar development pattern as that of market capital. That is, the higher the process capital the higher the GDP per capita (ppp) from 2002 to 2006. Israeli process capital had a little decline in 2007, then a sharper decline in 2008, yet it bounced back in 2009. Our further investigation of the raw data indicated that six indicators had a relatively large scale fluctuation during 2007, 2008, and 2009. They are fair business competition environment (6.27, 4.90, 5.82), government efficiency (3.07, 2.60, 3.29), intellectual property rights protection (6.52, 5.86, 6.98), capital availability (6.18, 4.38, 6.18), convenience of establishing new firms (7.64, 6.74, 7.38), and mobile phone subscribers (9.08, 8.39, 7.68). Some government operations were negatively impacted by the financial crisis. For example, the country’s capital availability was reduced greatly in 2008.
Figure 4 Scatterplot of GDP per capita (ppp) in USD vs. process capital of Israel (see online
version for colours)
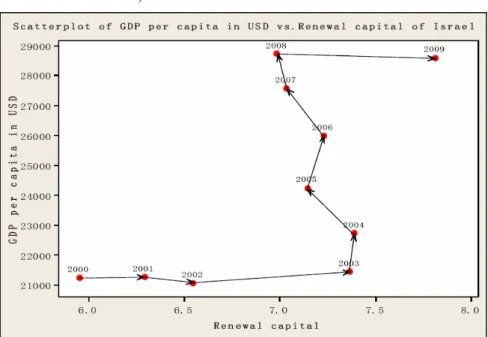
Figure 5 shows that Israeli renewal capital declined a little from 2003 to 2008, yet its GDP kept on growing. In other words, the correlation between Israeli renewal capital and GDP per capita (ppp) is low. In addition, the global financial crisis did not negatively impact its renewal capital. Our further analysis of the renewal capital raw data indicated
that only one indicator – basic research (7.09, 6.33, 8.39) had a relatively large scale score fluctuation during 2007, 2008, and 2009.
Figure 5 Scatterplot of GDP per capita (ppp) in USD vs. renewal capital of Israel (see online
version for colours)
To explore further the connection between NIC and GDP per capita (ppp) in Israel, we investigated the sustaining effect and boosting effect of NIC based on two papers by Stahle (Stahle and Bounfour, 2008; Stahle and Stahle, n.d.). To know the dynamics of NIC over years, they recommended to correlate the present level of indicators with present level of GNP annual growth as the sustaining effect and to correlate the present level of indicators with the trend of GNP annual growth as the boosting effect.
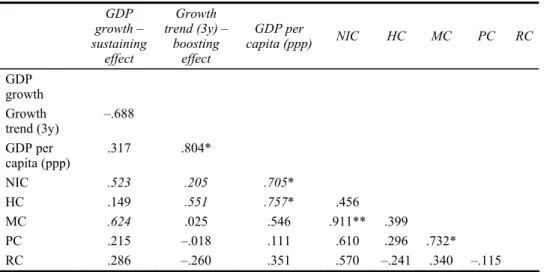
Table 3 exhibits both sustaining effect and boosting effect of Israeli NIC over ten years (2000–2009). GDP growth was calculated as the annual percentage change with respect to the previous year, whereas GDP growth trend was the trend value based on the previous three years of GDP per capita (ppp). Excluding GDP-related indicators, Table 3 shows that market capital (MC) has the best sustaining effect (.624) on GDP growth, followed by overall NIC (.523). Human capital (.551) has the best boosting effect on Israeli GDP growth trend, followed by overall NIC (.205). For the regular correlation, NIC (.705) and human capital (.757) are significantly correlated with GDP per capita (ppp). That is, higher NIC and higher human capital came together with higher GDP in Israel.
To detect whether the scenario would become different during the financial crisis, we further examined the sustaining effect based on three years data (2007–2009). We skipped the boosting effect as the specified data did not meet the requirement of having previous three years data for calculating every year trend value. Table 4 shows market capital (MC) and process capital (PC) had significant and high sustaining effects (.998 and .999) on Israeli GDP growth during the financial crisis. That is, during the years of global financial turmoil, market capital and process capital helped sustain Israel’s GDP
growth. For regular correlation, none of the intellectual capital is significantly correlated with GDP per capita (ppp).
Table 3 Correlation table of ten years (2000–2009) data for Israel
GDP growth – sustaining effect Growth trend (3y) – boosting effect GDP per capita (ppp) NIC HC MC PC RC GDP growth Growth trend (3y) –.688 GDP per capita (ppp) .317 .804* NIC .523 .205 .705* HC .149 .551 .757* .456 MC .624 .025 .546 .911** .399 PC .215 –.018 .111 .610 .296 .732* RC .286 –.260 .351 .570 –.241 .340 –.115 Notes: *p < .05 and **p < .01
Table 4 Correlation table of three years (2007–2009) data for Israel
GDP growth –
sustaining effect capita (ppp) GDP per NIC HC MC PC RC
GDP growth GDP per capita (ppp) .724 NIC .977 –.599 HC .008 –.696 –.206 MC .998* –.766 .961 .071 PC .999* –.694 .985 –.033 .995 RC .500 .236 .674 –.862 .444 .536 Note: *p < .05
3.1 Short-term and long-term intellectual capital
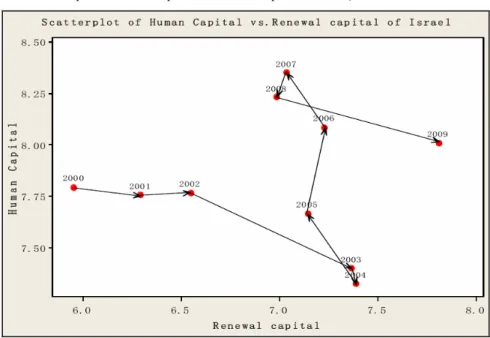
Short-term intellectual capital refers to market capital and process capital; whereas long-term intellectual capital means human capital and renewal capital. In our previous study [Lin and Edvinsson, (2011), p.324], we found that the combined increase in human capital and renewal capital would lead to a nation’s long term development; as human capital takes time to develop and renewal capital enhancement relies on good human capital. Once advanced to a certain level, they are not susceptible to change. On the other hand, the combined increase in market capital and process capital might result in more immediate economic development when a given nation is willing to invest its time and resources toward their improvement, such as more actively engaging in international trades and building better infrastructure. Figure 6 plotted the short-term-oriented market capital and process capital, which indicates a relatively large scale changes in ten years.
Market capital was up to the 6.1 level in 2007, yet slid to 5.5 level in 2008, and then rose again to 5.9 level in 2009. Process capital was at the 6.75 level in 2001, slid to 6.0 level in 2002, then gradually rose to 6.7 level in 2006 and 2007, yet slid to 5.9 level again in 2008 (very likely because of the impact of financial crisis), and then increased to 6.6 level in 2009. The fluctuation indicated the vulnerability of the short-term intellectual capital to the external environment influence.
Figure 6 Scatterplot of market capital vs. process capital of Israel (see online version for colours)
Comparing to Figure 6, Figure 7 shows a relatively stable path of human capital and renewal capital. Human capital had a clear increase from 2004 to 2007, yet declined a little from 2008 to 2009. After four consecutive years of growth (2000 to 2003), Israeli renewal capital almost stood still from 2004 to 2008, yet progressed significantly from 2008 to 2009.
In Israel, the short-term and long-term intellectual capitals have different development patterns. Although fluctuated in a relatively large scale, its short-term intellectual capital showed an upward trend from 2008 to 2009. On the contrary, its long-term human capital exhibited a downward trend from 2008 to 2009. Figure 7 sends a warning for relevant decision makers to ponder upon.
3.2 Ranking changes of intellectual capital
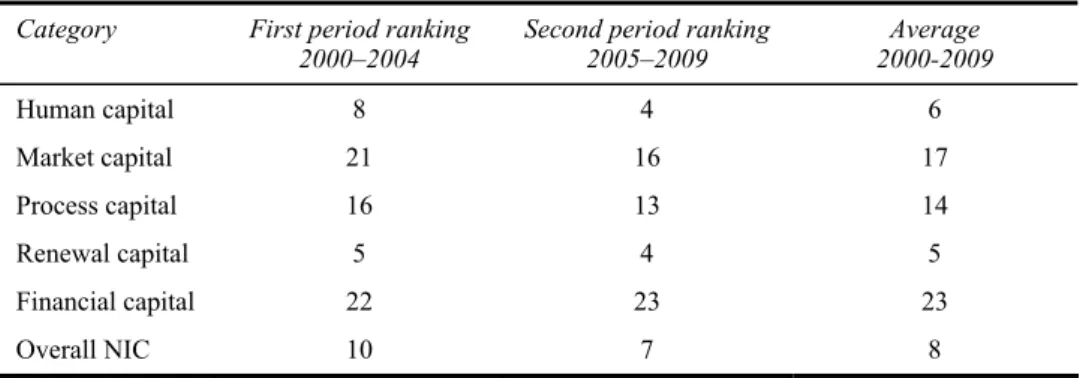
In order to further probe the dynamics and changes of NIC over the years, we have separated the data into the first five years and the second five years, with 2004 as the cut-off year. Comparing the ranking of the first period (2000–2004) and the second period (2005–2009), Table 5 shows that Israeli human capital improved from ranking 8 to ranking 4; market capital from ranking 21 to ranking 16, process capital from ranking 16 to ranking 13, renewal capital from ranking 5 to ranking 4 and overall NIC from ranking 10 to ranking 7. However, its financial capital decreased from first period ranking 22 to second period ranking 23. During the past ten years, Israel has NIC ranking advancement in every type of intellectual capital, except financial capital based on 1–10 scale. These statistics indicate that from 2005 to 2009, Israel has better NIC than some other countries that were ahead of it in 2000–2004.
However, financial capital decrease of one rank in the second period sent a signal for attention. Ranking advancement in human capital, market capital, process capital, and renewal capital was not accompanied with better financial standing in the studied 41 countries. That is, some other countries that were behind Israel in the four capitals had better financial performance. Actually, in real dollar value, the GDP per capita (ppp) of Israel has been increased from US $21,233 in 2000 to US $28,581 in 2009, with a growth rate of 34.61%. Since the 1–10 score is the relative ratio against the greatest number in the investigated 41 countries, the ranking decrease represents that the GDP per capita (ppp) of Israel had been surpassed by other countries, even though there was an actual monetary growth.
Table 5 Israel’s NIC ranking comparison between two time periods
Category First period ranking
2000–2004 Second period ranking2005–2009 2000-2009 Average
Human capital 8 4 6 Market capital 21 16 17 Process capital 16 13 14 Renewal capital 5 4 5 Financial capital 22 23 23 Overall NIC 10 7 8
Table 6 GDP per capita (ppp) over ten years for NIC ranking sixth to tenth countries G D P pe r c apit a ( pp p) 20 00 –2 00 9 200 0 200 1 200 2 200 3 200 4 200 5 20 06 20 07 200 8 200 9 G ro w th % M ea n U S A 35 ,2 52 36 ,0 65 36, 95 0 38, 32 4 40 ,4 51 42 ,6 81 44, 82 3 46, 57 7 47, 15 5 45, 93 4 30. 30 41, 42 1 Ic el an d 26 ,9 43 28 ,3 12 28, 62 1 29, 72 5 32 ,5 75 35 ,2 72 37, 13 3 39, 76 3 40, 63 5 37, 85 3 40. 49 33, 68 3 Is ra el 21 ,2 33 21 ,2 56 21, 05 8 21, 43 7 22 ,7 13 24 ,2 22 25, 97 5 27, 55 4 28, 71 5 28, 58 1 34. 61 24, 27 4 N eth er la nds 29 ,7 32 30 ,7 57 31, 08 0 31, 70 6 33 ,1 10 35 ,0 21 37, 33 0 39, 84 7 41, 32 3 39, 87 7 34. 12 34, 97 8 C ana da 28 ,9 79 29 ,8 47 30, 88 3 31, 84 3 33 ,4 09 35 ,1 50 36, 94 3 38, 44 9 39, 03 1 37, 94 7 30. 95 34, 24 8
Table 7 Liability index for the sixth to tenth NIC ranking countries
US dollars Mean GDP per capita (ppp) USA Iceland Israel Netherlands Canada
USA 41,421
Iceland 33,683 7,738 -
Israel 24,274 17,147 9,409 -
Netherlands 34,978 6,443 –1,295 –10,704 -
Canada 34,248 7,173 –565 –9,974 730 -
To investigate the possible explanation of Israel’s relatively weak financial capital, we have prepared Table 6 and Table 7. Assuming that being number eight in the overall NIC ranking, Israel should be compatible with the countries ranked sixth to tenth, we therefore provide the data of USA, Iceland, Israel, the Netherlands and Canada in the same table for easier comparison. Table 6 shows the GDP per capita (ppp) in real dollar value of these five countries from 2000 to 2009, among which Israel has the lowest mean GDP. Table 7 is the liability index (value difference) of these five countries. The statistics in italics can be interpreted, for example as “USA surpasses Israel in mean GDP (2000–2009) by US $17,147”. In other words, with about one point difference in NIC score (Appendix 2), Israel (36.39) lagged behind the USA (37.34) by average GDP per capita (ppp) of US $17,147. In the same vein, Israel has a mean GDP liability of US $9,409 comparing with that of Iceland, US $10,704 comparing with that of the Netherlands, and US $9,974 comparing with that of Canada. That is, the financial capital of Israel falls behind the four NIC compatible countries. In the future, Israel can work on increasing the added value of NIC to boost its economic development.
3.3 Other intangible assets
National intellectual capital is one approach to examine a country’s intangible assets. To gain a more comprehensive view of Israel’s future soft power and to understand its standing in the global landscape, Table 8 further displays a comparative table of the national intellectual capital sixth to tenth countries for a total of 16 indicators published in 2011 by various world organisations, including OECD and United Nations. These statistics reveal something interesting in supplementing our research findings. For instance, Israel invests 8.3% GDP on education, yet Israeli students’ PISA performances do not match up with this high educational investment, being the lowest performer in the five countries. Specifically, science, mathematics and reading performance of Israeli students ranked 42, 42, and 33 respectively – far behind those of the Netherlands ranked 7, 8, and 8 respectively. Although Israel’s current human capital ranks very high (#6) out of 41 countries, its future workforce may lose international competitiveness with the above reported PISA performance.
Table 8 NIC-related indicators and ranking Overa ll N IC41 ra nk in g GDP p er capit a ( ppp) gr owt h 200 9 v s. 20 00 1 P opu la tion (000) 2 Edu. exp en .# /% 3 HDI 4 PI SA scien ce #/ sco re PI SA ma th .# / sc or e PI SA rea ding #/ sco re 5 Br oa d ban d/ pop ul . HC 41 # 6 G lob al is at io n# MC4 1# U S A 6 30. 30% 313 ,2 32 6/ 6. 64 4 19 /5 02 26/ 48 7 11 /5 00 27. 1% 7 7 20 Ic el and 7 40. 49% 311 1/ 8. 4 17 26 /4 96 17/ 50 7 12 /5 00 33. 2% 3 --- 6 Is ra el 8 34. 61% 7,4 73 2/ 8. 3 15 42 /4 55 42/ 44 7 33 /4 74 25. 8% 6 21 17 N et he rla nds 9 34. 12% 16, 84 7 22/ 5.2 7 7/ 522 8/5 26 8/ 508 35. 6% 13 3 3 C ana da 10 30. 95% 34, 03 1 10/ 5.9 8 7/ 529 9/5 27 5/ 524 29. 7% 4 8 12 7 Qual it y of li fe #/ sco re 8 E-re ad in ess #/ sco re 9 Int er ne t us ersh ip / po pu l. 10 M obil e te le pho ne #/ sco re PC 41 # 11 R& D #/% 12 In no va tio n sc or e RC41 # 13 Wo rl d co mp .# 14 Gl ob al co m p. #/ sco re 15 ESI#/ score 16 EPI# / sco re U S A 18/ 7.9 4 5/8. 60 77. 3% 71 /9 4. 8 12 8/ 2. 76 - 4 3 4/ 5. 43 45 /5 2. 9 61/ 63 .5 Ic el and 14/ 8.6 1 --- 97. 6% 50 /1 08 .1 7 12/ 2.6 5 0.4 8 8 30 31 /4 .6 8 5/ 70 .8 1/ 93 .5 Is ra el 24/ 7.1 3 27 /7 .0 9 71. 6% 28 /1 25 .8 14 1/ 4. 86 - 5 17 24 /4 .9 1 62 /5 0. 9 66/ 62 .4 N et he rla nds 8/9. 10 3/8. 64 88. 6% 27 /1 27 .7 8 19/ 1.7 1 0.4 9 10 12 3/ 5. 33 40 /5 3. 7 47/ 66 .4 C ana da 7/9. 15 9/8. 33 77. 7% 10 0/ 68 .7 13 18/ 1.8 4 - 14 7 10 /5 .3 0 6/ 64 .4 46/ 66 .4 No te s: ‘ #” ref ers t o t he ran kin g a m on g r esp ec ti ve m em bers an d all th e nu m bers are th e m ost cu rren t d ata av ai lab le in 20 11 . Sou rc e: 200 9 P op ul ati on R ou nde d by Th ou sa nd ( 00 0) ; ‘ E du ca ti on e xpe nd itu re – r ank in g/ % of e duc at io n e xp endit ur e’ ; HD I – U nit ed N at ions H uman Develo pm en t I nd ex R an ki ng (2 00 8) ; PI SA R ank ing/ Sc or e – 20 06 O E C D I nte rn at io nal As se ss m en t o f St ud en t Sc ie nc e, M ath . a nd Re ad ing Pe rf or m anc e R ank in g B as ed o n 57 C ountr ie s an d Ac tu al Sc or es ; ‘ P ercen ta ge o f b ro ad ba nd in ter net su bs crib er s o f total po pu la ti on ’ (2 00 9); G loba li za tion I nde x Ra nk ing Out of 7 2 C ou ntr ie s (20 07 ); ‘Qu al ity o f li fe ran kin g o ut o f 5 7 co un tr ies ’; E -r ea di ne ss R ank in g O ut of 70 C oun tr ie s (2 00 8) ; Percen ta ge o f I ntern et Us ersh ip ; ‘M ob ile te le ph on e su bs cr ib er s ra nk ing ou t of 1 33 c ou ntr ie s’ ; ‘ R & D e xp en di tur e – pe rc en ta ge of G D P ’; Eur ope an I nn ov at ion Sc or eb oa rd R ank in g Out of 33 C ou ntr ie s (20 08 ); ‘I MD Wo rld C om pet it ive ne ss ran ki ng o ut o f 5 7 co un tri es’; ‘G lo ba l co m pe ti ti ve ne ss out of 13 3 c oun tr ie s’ ; E nv ir onme nt al S us tai na bi li ty In de x (ESI ) Ou t o f 14 9 Co un tr ie s; Env ir onme nt al Pe rf or ma nc e I nd ex (EPI )
In addition, Israel’s globalisation (ranked 21) and e-readiness (ranked 27) also lagged behind the other four countries. Furthermore, quality of life, environmental sustainability index (ESI) and environmental performance index (EPI) are also the lowest in this country cluster. Relatively low degree in globalisation and e-readiness may explain the lower than expected market capital (ranked 17), also the lower than expected process capital (ranked 14) exhibited in Appendix 2. Market capital and process capital are the two important factors that lead to short-term economic growth. To become more compatible with other countries in this country cluster, policy makers of Israel can pick up the comparative information presented in this paper for more focused improvement.
4 Financial crisis impact
Since Israel has relatively good NIC, it is appealing to look into the impact of 2008 global financial crisis, the level of influence, and its relationship with Israel’s intellectual capital. This section examines the status of financial crisis in Israel, government’s coping measures, its recovery, and relationship with intellectual capital.
According to Rosenberg (2010), Israel experienced a mild recession as a result of the global financial crisis – a testament to policies adopted by the government over the previous decade. Israeli was the last economy among 29 economies surveyed by the OECD to enter into a recession (fourth quarter 2008) and among the first to exit (second quarter 2009), making it by far the shortest downturn among the group.
At the outbreak of global financial crisis, with 70% of Israeli exports to the USA and Europe, and with Israeli exports to the US accounting for almost 17% of Israeli GDP, it was inevitable that Israel’s economy was hurt by the economic downturn in the USA. Fortunately, Israel’s real estate market never experienced the kind of bubble that left lenders overseas with large losses. In addition, Israeli banks largely shunned the exotic financial instruments that brought down so many USA and European lenders and insurers.
Yet, Israel’s economy did deteriorate during the global financial crisis. Figure 8 maps the ten years development in terms of real GDP growth per capita, unemployment rate, government subsidies % GDP, and consumer price inflation. There is a clear sign of GDP growth decrease from 2007 to 2009, which agrees with Buchwald’s (2009) report that the global economic crisis has impacted Israel mainly via the decline in its growth rate. Figure 8 also shows a rising unemployment rate from 2008 to 2009; however, government subsidies % GDP only increased a little bit; yet, consumer price inflation hiked in 2008 and then decreased a little in 2009.
To cope with the economic downturn, Israeli government offered as much as 12 billion shekels (local currency) in guarantees to commercial banks to help them raise capital, but the banks in the end had no need of the assistance. It also allocated 1.1 billion shekels in support of private investment funds buying corporate bonds from issuers facing difficulties rolling over debt. As of January 2010, only about 10% of the amount had been used. Likewise, only about 700 million shekels of a 2.6-billion-shekel fund for small and medium-sized business had been taken up. For the broader economy, Israeli government also boosted research and development assistance to the technology sector, improved unemployment terms, and allocated 6 billion shekels for export guarantees (Rosenberg, 2010). The OECD estimated in January 2010 that the total cost of these
stimulus measures to date, including the cost of tax increases, had been no more than 0.5% of GDP. Figure 9 indicates that Israeli general government debt in 2008 and 2009 was actually reduced comparing with pre-crisis years.
Figure 8 Economic development in Israel (see online version for colours)
Figure 9 Total general government debt % GDP (see online version for colours)
For a better presentation of the relationship between NIC and financial crisis in Israel, we have prepared Figure 10. With a total of 41 countries in the background (each bubble represents a country), Figure 10 shows the relative position of Israeli co-development path of NIC and GDP per capita (ppp). From 2000 to 2006, the graph clearly shows that the higher the NIC the higher the GDP per capita (ppp). However, the backward path of its NIC from 2007 to 2008 and the rebound in 2009 agrees with Israeli economic development during the financial crisis. In other words, the impact of financial crisis on Israel is reflected in its GDP per capita (ppp).
Figure 10 The co-development path of NIC and GDP per capita (ppp) in Israel (see online version
for colours)
Although the scatterplots exhibited from Figure 2 to Figure 7 explain the correlations between GDP per capita (ppp) and each individual capital only, Table 3 and Table 4 did show the value of NIC in sustaining and boosting Israeli GDP growth and GDP growth trend. Over ten years, its market capital and overall NIC were the main factors that helped sustain Israeli GDP growth; in the same period, human capital and overall NIC were the main factors that helped boost its GDP growth trend. During the financial crisis (2007–2009), market capital and process capital were the two main drivers that helped Israel sustain its GDP growth.
5 Conclusions
Nowadays, most of the advanced nations are aware of competitiveness comes from innovation (Andriessen and Stam, 2004; Lin and Edvinsson, 2012; Markkula and Kune, 2012), and innovation comes from people and the intangibles. The intangibles are said to be the key driving force for future national development. As a result, in Europe there is a quest for promoting the competitive investment into intangibles, also called the Lisbon agenda, from the EU summit in Lisbon, Portugal in 2002. The aspiration is to lift the investment of R&D to the level of 3% of GDP for EU-12 countries. This highlights the magnitude and the shift of investments into intangibles as well as the need for a systematic intellectual capital report and the outcome of the value creation based on these expenditures. This growing space of intangible investments is among others demanding more strategic intelligence, or knowledge navigation capability on the society.
Israel recovered from the 2008 global financial crisis very fast, mainly because of the government’s swift responses to stabilise its economy, investors’ confidence in Israeli economy, and its strong economic system. Israel entered the crisis with solid fundamentals, including a resilient banking sector, years of prudent fiscal policy, a series of liberalising reforms, high growth rate, low unemployment rate, and current account surplus (Buchwald, 2009; CIA, 2012; Friedberg, 2009). As a result, the banks in the end had no need for financial assistance and only 10% of the government supported private investment funds had been used.
Israel also had a head start in terms of R&D (4.86% GDP in 2011) and high-technology investment, demonstrated from the little influence of financial crisis on its renewal capital. Unfortunately, those investments did not effectively translate to the bottom line financial performance from the statistics reported in this study, very likely because of the high percentage (65%) of defence-related R&D (Pasher and Shachar, 2005). Rosenberg’s (2010) following comments may also provide partial explanation.
“Israel’s technology sector is relatively disconnected from broader domestic economic policy, little concerned with local demand ….. Since the mid-1990s, the sector has developed into an industry of perpetual innovation characterized by a recurrent cycle of start-up companies that conceive and develop new technology, finance it with venture capital, and prove it in the marketplace before selling themselves to bigger, overseas companies...”
Such start-up industry has been criticised for it does not translate its R&D achievements into employment, long-term generators of revenue or profit as illustrated by the relatively low contribution of high-tech exports to total industrial exports. Nowadays, Israel faces the growing global technology competition. This intensifying rivalry is reflected in competition over foreign investments that provide crucial capital for technological development, and over professionals who acquire their scientific, technological, and managerial training in Israel [Samuel Neaman Institute, (2010), p.16]. Israel’s reducing R&D researchers (Rosenberg, 2010) and concerns over future human resources quality as reflected in students’ PISA performance may pose challenges for sustaining competitiveness. In addition, its declining long-term human capital (Figure 7) also sent a warning signal for coping measures.
Before the financial crisis, we found that the higher the NIC the higher the GDP per capita (ppp) in Israel. The global financial stress affected not only Israeli real economy but also its national intellectual development with a clear backward progression, except renewal capital. Although Israeli government has invested a high percentage of GDP on R&D and the success of its innovation start-ups are globally known, Table 3 shows that its renewal capital did not stand out as the key factor having outstanding correlation with either GDP per capita (ppp), or GDP growth, or GDP growth trend. On the contrary, market capital and NIC are the two main factors that helped sustain its GDP growth; in addition, human capital and NIC are the two main factors that helped boost its GDP growth trend during 2000-2009. Such finding posits an important issue for further pursuit.
Furthermore, Table 4 reveals that during the years of the financial crisis (2007–2009), market capital and process capital (short-term intellectual capital) helped sustain Israeli GDP growth with statistical significance. However, these two capitals did not significantly correlate with GDP per capita (ppp) during the financial crisis as well as over ten-year period of the study. This finding explains that short-term intellectual capital
alone is not sufficient to help a nation sustain its lasting GDP growth. In other words, for durable national growth, long-term intellectual capital needs to be developed.
As with other social science studies, this research has the following four limitations. First, our data analysis results rely on the quality of the data source. Second, secondary data is always a few years behind the time of research with the most current development missing. Third, the IMD qualitative data we used are based on experts’ rating with unavoidable subjectivity. Fourth, proxy indicators have an inherent inability to fully represent the construct. However, this study advances our own previous NIC studies by adding the sustaining effect and boosting effect of NIC and by looking into a specific country for a more in-depth analysis.
NIC research is gaining importance in an era of knowledge economy and increasing global competition. Continuous follow-up studies on NIC provide valuable information for policy makers to formulate more focused national development strategies. Future research can explore the NIC of other countries with unique features, expand the years of study when more recent data become available, and calculate linear growth potential and exponential growth potential introduced by Stahle and Bounfour (2008) for a single country as well as for country comparisons.
During 2011, more and more nations are recovering from the 2008 global financial crisis. Israel’s future competitiveness may lie on how to transform its high level intellectual capital into real economic development and how to capitalise its R&D and innovation capability to create rooted industries for future sustainability. Hopefully, research findings of this study may shed some lights for relevant policy makers to strategise coping measures for future national development and well-being.
References
‘Education expenditure – ranking/% of education expenditure’, 2009 IMD World Competitiveness Yearbook.
‘Global competitiveness out of 133 countries’, The Global Competitiveness Report 2009–2010, http://www.weforum.org/pdf/GCR09/GCR20092010fullreport.pdf (accessed 30 May 2011). ‘IMD World Competitiveness ranking out of 57 countries’, 2009 IMD World Competitiveness
Yearbook.
‘Mobile telephone subscribers ranking out of 133 countries’, The Global competitiveness Report 2009–2010, updated June 2009 [online] http://www.weforum.org/pdf/GCR09/ GCR20092010fullreport.pdf (accessed 30 May 2011).
‘Percentage of broadband internet subscribers of total population’ (2009) The Global Competitiveness Report 2009–2010, updated June 2009 [online] http://www.weforum.org/pdf/ GCR09/GCR20092010fullreport.pdf (accessed 30 May 2011).
‘Quality of life ranking out of 57 countries’, 2009 IMD World Competitiveness Yearbook. ‘R&D expenditure – percentage of GDP’, 2009 IMD World Competitiveness Yearbook.
2009 Population Rounded by Thousand (000), updated July 2009 [online] https://www.cia.gov/ (accessed 30 May 2011).
Andriessen, D. and Stam, C. (2004) The Intellectual Capital of the European Union: Measuring the Lisbon Agenda [online] http://www.intellectualcapital.nl/artikelen/ICofEU2004.pdf (accessed 20 October 2012).
Bontis, N. (2001) ‘Assessing knowledge assets: a review of the models used to measure intellectual capital’, International Journal of Management Reviews, Vol. 3, No. 1, pp.41–60.
Bontis, N. (2004) ‘National intellectual capital index: a United Nations initiative for the Arab region’, Journal of Intellectual Capital, Vol. 5, No. 1, pp.13–39.
Bontis, N., Chua, W. and Richardson, S. (2000) ‘Intellectual capital and the nature of business in Malaysia’, Journal of Intellectual Capital, Vol. 1, No. 1, pp.58–100.
Bounfour, A. (2003) ‘The IC-dVal approach’, Journal of Intellectual Capital, Vol. 4, No. 3, pp.396–412.
Buchwald, D. (2009) ‘Israel & global economic crisis’, Focus Quarterly, Summer, Vol. 3, No. 2 [online] http://www.jewishpolicycenter.org/969/israel-global-economic-crisis (accessed 1 October 2012).
Central Intelligence Agency (CIA) (2012) The World Factbook, USA Central Intelligence Agency [online] https://www.cia.gov/library/publications/the-world-factbook/geos/ch.html (accessed 1 October 2012).
Edvinsson, L. (2002) ‘The new knowledge economics’, Business Strategy Review, Vol. 13, No. 3, pp.72–76.
Edvinsson, L. and Malone, M. (1997) Intellectual Capital, Harper Business, New York.
Environmental Performance Index (EPI) [online] http://www.yale.edu/epi/files/2008EPI_Text.pdf (accessed 30 May 2011).
Environmental Sustainability Index (ESI) Out of 149 Countries [online] http://www.yale.edu/ esi/ESI2005_Main_Report.pdf (accessed 30 May 2011).
E-readiness Ranking Out of 70 Countries (2008) Economist Intelligence Unit [online] http://en.wikipedia.org/wiki/E-readiness#Economist_Intelligence_Unit_e-readiness_rankings (accessed 30 May 2011).
European Innovation Scoreboard Ranking Out of 33 Countries (2008) [online] http://www.proinno-europe.eu/EIS2008/website/docs/EIS_2008_Final_report.pdf (accessed 30 May 2011).
Friedberg, R. (2009) Economic Highlights: 4th Quarter 2008, State of Israel, Ministry of Finance, International Affairs Department, January [online] http://eng.mni.gov.il/FinanceIsrael/Docs/ En/EconomicHighlights/EconomicHighlights-2008-4.pdf (accessed 1 October 2012).
Globalization Index Ranking Out of 72 Countries (2007) [online] http://www.foreignpolicy.com/ story/cms.php?story_id=4030 (accessed 30 May 2011).
HDI – United Nations Human Development Index Ranking (2008) (ranking 1–75: high human development; 76–153: medium human development; 154–179: low human development) [online] http://hdr.undp.org/en/statistics/ (accessed 30 May 2011).
Lin, Y.Y. and Edvinsson, L. (2011) National Intellectual Capital: A Comparison of 40 Countries, Springer Publishing Co., NY.
Lin, Y.Y. and Edvinsson, L. (2012) ‘Navigating intellectual capital of nations for service innovation in the European Union’, Open Innovation 2012, European Commission, pp.118–122.
Malhotra, Y. (2003) Managing and Measuring Knowledge Assets in the Public Sector, Working Paper, Syracuse University.
Markkula, M. and Kune, H. (2012) ‘Pioneering regions and societal innovations as enablers for the Europe 2020 strategy’, Open Innovation 2012, European Commission, pp.48–61.
OECD (2000) ‘International science and technology co-operation: towards sustainable development’, Proceedings of the OECD Seoul Conference, OECD, Paris.
Pasher, E. and Shachar, S. (2005) The Intellectual Capital of the State of Israel, Ministry of Industry, Trade and Labor, State of Israel.
Peled, D. (2001) Defence R&D and Economic Growth in Israel: A Research Agenda, Samuel Neaman Institute for Advanced Studies in Science and Technology [online] http://econ.haifa.ac.il/~dpeled/papers/ste-wp4.pdf (accessed 1 October 2012).
Percentage of Internet Usership, 30 June 2009 updated [online] http://www.internetworldstats. com/stats.htm (accessed 30 May 2011).
PISA Ranking/Score – 2006 OECD International Assessment of Student Science, Math. and Reading Performance Ranking Based on 57 Countries and Actual Scores, OECD International Assessment of Student Performance (PISA) [online] http://www.oecd.org/dataoecd/15/ 13/39725224.pdf (accessed 30 May 2011).
Pomeda, J.R., Moreno, C.M., Rivera, C.M. and Martil, L.V. (2002) ‘Towards an intellectual capital report of Madrid: new insights and developments’, presented at The Transparent Enterprise. The Value of Intangibles, 25–26 November, Madrid, Spain.
Rembe, A. (1999) The Governmental Invest in Sweden Agency – ISA: Report 1999, Halls Offset AB, Stockholm.
Rosenberg, D. (2010) ‘The Israeli economy: after the financial crisis, new challenges’, MERIA Journal, Vol. 14, No. 1 [online] http://www.gloria-center.org/2010/03/rosenberg-2010-03-06/ (accessed 1 October 2012).
Samuel Neaman Institute (2010) Science, Technology and Innovation Indicators in Israel: An International Comparison, Submitted to Israel National Council for Research & Development. Schiuma, G., Lerro, A. and Carlucci, D. (2008) ‘The knoware tree and the regional intellectual capital index: an assessment within Italy’, Journal of Intellectual Capital, Vol. 9, No. 2, pp.283–300.
Spring Project (2002) [online] http://cordis.europa.eu/data/PROJ_FP5/ACTIONeqDndSESSION eq21722 200595ndDOCeq104ndTBLeqEN_PROJ.htm (accessed 1 October 2009).
Stahle, P. and Bounfour, A. (2008) ‘Understanding dynamics of intellectual capital of nations’, Journal of Intellectual Capital, Vol. 9, No. 2, pp.164–177.
Stähle, P. and Pöyhönene, A. (2005) ‘Intellectual capital and national competitiveness: a critical examination. Case Finland’, Proceedings of the 6th European Conference of Knowledge Management (ECKM), University of Limerick, Limerick.
Stahle, P. and Stahle, S. (n.d.) Intellectual Capital and National Competitiveness: Conceptual and Methodological Challenges [online] http://scholar.google.com.tw/scholar?q=intellectual+ capital+and+national+competitiveness+conceptual+and+methodological+challenges&hl=en& as_sdt=0&as_vis=1&oi=scholart&sa=X&ei=ogWNUO3rPOPHmAWEr4DQAg&ved=0CBcQ gQMwAA (accessed 1 October 2012).
Stewart, T.A. (1997) Intellectual Capital: The New Wealth of Organizations, Nicholas Brealey Publishing, New York.
Weziak, D. (2007) Measurement of national intellectual capital application to EU countries’, IRISS Working Paper 2007-13 [online] http://iriss.ceps.lu/documents/irisswp81.pdf (accessed 1 October 2011).
World Bank (1998) World Development Report: Knowledge for Development, Oxford University Press, Washington.
Appendix 1
Indicator data sources for each type of capital
Capital Variables Sources
1 World Bank 2 OECD 3 APEC
4 US Department of Commerce (2000) 5 Commission of European Community (2000) Skilled labour
6 Singapore Department of Trade and Industry (2001) 1 World Bank
2 US Department of Commerce (2000) Employee training
3 Australia Department of Industry, Science and Resource Branch (2000) 1 World Bank
2 Australia Department of Industry, Science and Resource Branch (2000) Literacy rate
3 Bontis (2004) 1 World Bank
2 Australia Department of Industry, Science and Resource Branch (2000) Higher education enrolment 3 Bontis (2004) 1 World Bank Pupil-teacher ratio 2 Malhotra (2000) 1 APEC 2 US Department of Commerce (2000) 3 Commission of European Community (2000) Internet subscribers
4 Australia Department of Industry, Science and Resource Branch (2000) 1 World Bank
2 Australia Department of Industry, Science and Resource Branch (2000) Human
capital
Public expenditure on education
3 Pomeda et al. (2002) Corporate tax 1 World Bank
2 Focus group
Cross-border venture Focus group Openness of culture 1 World Bank
2 Bontis (2004)
3 Malhotra (2002)
Globalisation 1 APEC
2 Malhotra (2000)
Transparency 1 World Bank
Market capital
2 Focus group
Indicator data sources for each type of capital (continued)
Capital Variables Sources
Image of country 1 Malhotra (2003)
2 Focus group
Exports of goods 1 APEC Market
capital
2 Malhotra (2000)
Competition environment 1 World Bank
2 APEC Government efficiency 1 World Bank
2 APEC 1 World Bank
Intellectual property
rights protection 2 APEC Capital availability 1 World Bank
2 APEC 3 US Department of Commerce (2000) 4 Commission of European Community (2000)
5 Malhotra (2002)
1 World Bank 2 APEC
3 Australia Department of Industry, Science and Resource Branch (2000)
4 Singapore Department of Trade and Industry (2001) Computers in
use per capita
5 Malhotra (2000) 1 World Bank
2 Commission of European Community (2000) Convenience of
establishing new firms
3 Singapore Department of Trade and Industry (2001) Mobile phone subscribers 1 World Bank
2 OECD 3 APEC 4 Australia Department of Industry,
Science and Resource Branch (2000) Process
capital
5 Singapore Department of Trade and Industry (2001) Business R&D spending 1 World Bank
2 OECD 3 APEC
4 US Department of Commerce (2000) 5 UK Department of Trade and Industry (2000) 6 Australia Department of Industry,
Science and Resource Branch (2000) R&D
researchers
7 Malhotra (2000)
Indicator data sources for each type of capital (continued)
Capital Variables Sources
Basic research 1 World Bank
2 APEC R&D spending/GDP 1 World Bank
2 OECD 3 APEC
4 Commission of European Community (2000) 5 Australia Department of Industry,
Science and Resource Branch (2000)
6 Singapore Department of Trade and Industry (2001)
7 Bontis (2004)
1 World Bank
2 OECD 3 APEC 4 Australia Department of Industry,
Science and Resource Branch (2000)
5 Bontis (2004)
6 Malhotra (2000)
1 World Bank 2 OECD 3 APEC
4 UK Department of Trade and Industry (2000) Cooperation between
universities and enterprises
5 Australia Department of Industry, Science and Resource Branch (2000) Scientific articles 1 World Bank
2 UK Department of Trade and Industry (2000)
3 Malhotra (2000)
1 World Bank
2 US Department of Commerce (2000) 3 Commission of European Community (2000) 4 Australia Department of Industry,
Science and Resource Branch (2000)
5 Singapore Department of Trade and Industry (2001) 6 Bontis (2004)
R&D researchers
Patents per capita (USPTO + EPO)
7 Malhotra (2000) Source: Lin and Edvinsson (2011, pp.27–29)
Appendix 2
National intellectual capital score and ranking for 41 countries
20 00~ 20 09 Huma n ca pi ta l M ark et c api ta l Proc ess c apit al Re ne w al capi ta l Fi nanc ia l c api ta l Ov er al l N IC M ean 6. 48 5. 55 5. 55 3. 90 9. 18 30 .6 6 SD 1. 22 0. 98 1. 48 2. 09 0. 69 5 .8 3 Co un tr y Sc or e Ra nk in g Sc ore Ra nk in g Sc ore Ra nk in g Sc ore Ra nkin g Sc or e Ran ki ng Sc or e Ra nki ng A rg entin a 5. 11 34 3 .3 5 41 2. 70 41 1. 43 38 8 .6 4 34 21 .2 4 41 A ustr alia 7. 31 12 6 .2 2 13 7. 11 6 4. 63 18 9 .6 9 10 34 .9 5 13 A ustr ia 7. 13 14 6 .3 1 11 6. 99 9 5. 01 13 9 .7 1 8 35 .1 4 12 B elgi um 7. 36 10 5 .6 6 19 6. 00 19 4. 78 15 9 .6 4 13 33 .4 5 18 B razi l 4. 54 39 4 .6 4 34 3. 11 40 1. 72 36 8 .4 4 36 22 .4 5 38 C anad a 8. 06 4 6 .2 4 12 6. 60 13 5. 00 14 9 .7 2 7 35 .6 2 10 Ch il e 5. 25 32 6. 63 4 5. 16 28 1 .7 2 35 8. 74 31 27 .4 9 29 C hin a 4. 42 40 5 .2 2 26 3. 72 34 2. 03 31 7 .7 1 39 23 .1 0 36 C zech R epu bl ic 5.74 30 5 .6 1 21 5.26 27 2.68 23 9 .2 0 27 28 .4 9 25 De nma rk 8. 59 1 6. 60 5 7. 61 2 6 .2 0 7 9. 68 11 38 .6 9 4 F inlan d 7. 74 8 6 .5 2 7 7. 73 1 7. 79 3 9 .5 9 17 39 .3 8 2 F ran ce 6. 81 19 4 .4 0 38 5. 73 21 4. 67 17 9 .6 0 16 31 .2 1 21 G er m an y 6. 56 23 5 .5 1 22 6. 37 15 5. 75 9 9 .6 2 15 33 .8 0 16 G reece 5.82 29 4 .4 8 36 4.56 30 2.11 28 9 .4 1 22 26 .3 7 30 H ung ar y 6. 57 22 5 .3 7 24 5. 12 29 2. 37 27 9 .0 1 28 28 .4 4 26 Icel an d 8. 13 3 6 .5 6 6 7. 03 7 5. 91 8 9 .7 0 9 37 .3 1 7 In dia 3. 94 41 5 .2 5 25 3. 38 36 1. 88 32 7 .1 2 41 21 .5 6 39 Ir eland 7. 00 16 7 .0 5 2 6. 89 11 3. 93 21 9 .7 8 4 34 .6 5 14 Is ra el 7. 84 6 5 .7 2 17 6. 39 14 7. 06 5 9 .4 0 23 36 .3 9 8 It al y 6. 26 26 4 .4 4 37 5. 34 25 2. 62 24 9 .5 3 19 28 .1 8 27 Ja pan 7. 36 11 4 .7 8 32 5. 94 20 6. 52 6 9 .5 8 18 34 .1 8 15
National intellectual capital score and ranking for 41 countries (continued) 2000 ~2009 H uman c apit al Mar ke t capita l Process capi ta l Renewa l cap ital Financia l cap ita l Overall NI C Mean 6.48 5.55 5.55 3.9 0 9.18 30.6 6 SD 1.22 0.98 1.48 2.0 9 0.69 5.83 Cou nt ry Scor e Ranking Scor e Ranking Sc or e R anki ng Score Ranking Sc or e Ranking Score Ranki ng K orea 6.78 20 5.07 27 5.35 24 4.20 20 9.31 25 30.7 1 22 M ala ys ia 6.11 27 6.48 8 5.34 26 2.07 30 8.69 32 28.6 9 24 M ex ico 4.92 35 4.72 33 3.18 39 1.21 41 8.76 30 22.7 9 37 N etherl ands 7.28 13 6.80 3 7.00 8 5.19 10 9.74 6 36.0 2 9 N ew Ze al and 6.97 17 5.98 14 6.23 18 3.63 22 9.38 24 32.2 0 20 N orwa y 7.96 5 5.87 16 6.93 10 4.76 16 10.00 1 35.5 2 11 Ph ilippines 4.91 36 4.58 35 3.20 38 1.34 40 7.41 40 21.4 5 40 Po la nd 6.00 28 3.94 40 3.52 35 1.85 33 8.85 29 24.1 7 33 Po rtugal 6.38 24 4.89 31 5.36 23 2.08 29 9.25 26 27.9 7 28 Rus sia 5.46 31 4.06 39 3.21 37 2.59 26 8.69 33 24.0 1 34 Sing ap ore 7.03 15 8.34 1 7.51 3 5.13 11 9.90 2 37.9 0 5 So uth Afr ica 4.85 37 4.96 29 4.33 31 1.73 34 8.41 37 24.2 8 32 Sp ai n 6.32 25 5.05 28 5.37 22 2.60 25 9.49 20 28.8 3 23 Sw eden 8.38 2 6.38 10 7.26 5 7.97 2 9.66 12 39.6 5 1 Sw itz erl and 7.57 9 6.39 9 7.38 4 8.00 1 9.76 5 39.1 0 3 Taiwan 6.92 18 5.90 15 6.28 16 5.04 12 9.45 21 33.5 9 17 Thailand 5.14 33 5.70 18 4.31 32 1.39 39 8.18 38 24.7 1 31 Turke y 4.55 38 4.93 30 3.86 33 1.54 37 8.60 35 23.4 8 35 U K 6.64 21 5.39 23 6.24 17 4.53 19 9.63 14 32.4 4 19 U S A 7.83 7 5.65 20 6.85 12 7.11 4 9.90 3 37.3 4 6