國
立
交
通
大
學
電控工程研究所
碩
士
論
文
多通道行動與無線
EEG 系統之新式設計
A New Design of
Multi-channels Mobile and Wireless EEG System
研 究 生:王琬茹
指導教授:林進燈 教授
多通道行動與無線
EEG 系統之新式設計
A New Design of Multi-channels Mobile and Wireless EEG System
研 究 生:王琬茹 Student:Wan-Ru Wang
指導教授:林進燈 Advisor:Chin-Teng Lin
國 立 交 通 大 學
電 控 工 程 研 究 所
碩 士 論 文
A ThesisSubmitted to Institute of Electrical Control Engineering College of Electrical and Computer Engineering
National Chiao Tung University in partial Fulfillment of the Requirements
for the Degree of Master
in
Electrical and Computer Engineering July 2011
Hsinchu, Taiwan, Republic of China
多通道行動與無線 EEG 系統之新式設計
學生:王琬茹
指導教授:林進燈 博士
國立交通大學電控工程研究所碩士班
摘要
在過去的研究中,大多數的學者使用包含強大功能的標準化量測儀器來收錄 高訊號品質的腦電位(EEG)訊號;然而,由於此套腦電位系統較笨重而巨大,這 也造成在日常生活當中收錄腦波變成一項困難的任務。因此我們提出一套多通道 行動與無線腦電位系統足以容易應用於醫療用途、居家照護控制介面,以及科學 認知實驗等等。此套系統包含三個部份:(1)乾電極、(2)多通道行動無線腦電位 擷取電路裝置,和(3) 腦電位展示程式。其中乾電極不需要依靠電極膠來降低皮 膚與電極的阻抗值的前置準備工作,卻比起濕電極有更好的長時間偵測品質。而 實作出來的電路裝置能為16 個輸入通道提供服務,並且體積小、重量輕巧。此 外,後端展示程式能透過無線通訊介面接收腦電位訊號,並且將數位資料存成檔 案以利線下分析。 在本研究中,我們也設計出一套系統驗證的方法逐步為我們的系統驗證出效 能。從最後的結果中,我們得知此套系統有72-95%的程度相似於 Neuroscan 公 司出產的標準化量測系統;而結合在多通道腦電位擷取電路裝置的乾電極不僅可 以量測到與濕電極相似的腦電位訊號特徵,也能在oddball 認知實驗當中量測到 相當微小的事件相關電位(ERP)訊號,並與濕電極所量到的訊號有 93-95%的相似程度。總結來說,我們宣稱此套系統量測腦電位確實有可靠的訊號品質,並且可 以方便地應用於日常生活當中。
關鍵詞:腦電位系統、腦電位、行動與無線腦電位擷取電路、多通道、乾電極、 系統驗證、P300、Oddball 實驗
A New Design of
Multi-channels Mobile and Wireless EEG System
Student: Wan-Ru Wang
Advisor: Dr. Chin-Teng Lin
Institute of Electrical Control Engineering
College of Electrical and Computer Engineering
National Chiao Tung University
Abstract
In past study, most of researchers used standard measurement instrument which produced strong functions to monitor EEG activity with high signal quality. However, recording EEG trends to be a difficult task in dairy life during to hardly moving the heavy, huge, and wired EEG system. Hence, we mention a multi-channels mobile and wireless EEG system which can be easily used for medical application, home care control interface, cognitive experiments, and so on. The system includes three parts: (1) dry sensors, (2) multi-channels mobile and wireless EEG acquisition circuitry, and (3) EEG display program. Dry sensor needs not any skin preparation with conductive gels to maintain small skin-sensor impedance but still make the better long-term monitoring performance than wet sensor. The circuitry is implemented to serve 16-channel inputs and has a miniature area and light. In addition, back-end display program receives EEG data via wireless communication and can also save digital data as a file for off-line analysis.
In this study, we also design the method of system verification to verify the performance of our system step by step. Finally, the results show that our circuitry and program is 72-95% correlate to standard measurement instrument like Neuroscan system. Dry sensor applied in multi-channels device can not only monitor the similar EEG feature with wet sensor but also detect pretty tiny EEG signal even ERP in Oddball task with 93-95% correlation with wet sensor. In conclusion, we demonstrate our proposed system is exactly reliable and can be conveniently applied in dairy life.
KEYWORD: EEG system, electroencephalogram, mobile and wireless EEG acquisition circuit, multi-channels, dry sensor, system verification, P300, oddball task
誌謝
本論文的完成,首先要感謝指導教授林進燈博士這兩年來的悉心指導,讓我 學習到許多寶貴的知識,在學業及研究方法上也受益良多。另外也要感謝口試委 員們的建議與指教,使得本論文更為完整。 其次,感謝林伯昰博士、陳聖夫博士和柯立偉博士在我研究期間,不吝惜給 予我指導方針。感謝實驗室學長張哲睿、劉育航教導我硬體偵錯的方法;陳世安 學長和研究助理王林宇協助我完成系統認證實驗;感謝腦科學研究中心提供我完 善的研究資源;感謝為我研究貢獻腦波的十名受測者,願意彈性配合我的實驗時 間毫無怨言;感謝岡儒、胤宏、小昭在我熬夜做研究的日子裡,經常陪我吃宵夜 為我加油打氣;感謝珍珍學姐偶然的一番話,啟發我在繁雜的數據當中找到呈現 成果的核心理路。 感謝我的父母親無條件支持我為研究領域的付出,在我受挫時總第一時間關 心我,和你們共享天倫之樂是我的福氣,相信你們看到我的成長也會備感光榮。 此外,最要感謝我的生命導師教導我如何心安心定完成研究,開啟我智慧讓我事 半功倍,沒有祢,將沒有本篇論文的準時完成。 謹以本論文獻給我的家人及所有關心我的師長朋友們。Contents
摘要…... iii Abstract ... v 誌謝…... viiChapter 1 Introduction
... 1 1.1 EEG system ... 1 1.2 Previous Work ... 3 1.3 Motivation ... 7 1.4 Organization of Thesis ... 8Chapter 2 Material and Method
... 92.1 Biosignals ... 9
2.1.1 Electroencephalogram (EEG) ... 10
2.1.2 Electrooculography (EOG) ... 12
2.1.3 Electromyogram (EMG) ... 13
2.2 EEG Signal Preprocessing ... 14
2.3 Method of Data Acquisition and Record ... 15
2.3.1 System Overview ... 15
2.3.2 Dry Sensor ... 16
2.3.3 Multi-channels Mobile and Wireless EEG Acquisition Circuitry ... 19
2.3.3.1 Front-End Filter and Amplification Circuit ... 20
A. Instrumentation Amplifier ... 21
B. High Pass Filter ... 22
2.3.3.2 Multiplexer ... 24
2.3.3.3 Analog to Digital Converter and Micro-controller ... 25
A. Timer Interrupt ... 26
B. Analog to Digital Converter ... 27
C. Moving Average ... 30
D. UART Interface ... 31
2.3.3.4 Wireless Transmission ... 32
2.3.3.5 Power Management ... 33
A. Power Supply Circuit ... 33
2.3.4 Implementation of the EEG Acquisition Circuitry ... 35
2.3.5 EEG Display Program... 36
2.3.5.1 Receive Package and Display ... 37
A. Package Protocol ... 37
B. Display Digital Data to Analog Signal ... 38
2.3.5.2 Save Data as a File ... 38
2.3.5.3 User’s Guide ... 39
2.4 Experiment: P300 and Oddball task ... 41
2.4.1 P300 ... 41
2.4.2 Oddball Task ... 43
Chapter 3 Experiment Results and Discussion
... 483.1 System Verification of Simulated Signals ... 49
3.1.1 Performance Test in Time Domain ... 49
3.1.2 Performance Test in Frequency Domain ... 50
3.2 Circuitry and Program test compared to reference system ... 52
3.2.1 Participant ... 53
3.2.2 Experiment Procedure and Presentation ... 53
3.2.3 Method of Analysis ... 55
3.2.4 Experiment Results ... 56
3.2.4.1 Blink Action Comparison Results ... 56
A. Time-Domain Correlations ... 56
B. Frequency-Domain Correlations ... 58
3.2.4.2 Tooth Action Comparison Results ... 59
A. Time-Domain Correlations ... 59
B. Frequency-Domain Correlations ... 61
3.2.4.3 Normal Action Comparison Results ... 62
A. Time-Domain Correlations ... 62
B. Frequency-Domain Correlations ... 65
3.2.5 Discussion ... 66
A. Blink Action State ... 66
B. Tooth Action State ... 67
C. Normal Action State ... 67
3.3 Sensor Basic Test ... 69
3.3.1 Participant ... 70
3.3.2 Experiment Procedure and Presentation ... 70
3.3.3 Method of Analysis ... 73
3.3.4 Experiment Results ... 75
B. The Best Trial Data in Blink Action ... 76
C. The Best Trial Data in Close Action ... 78
D. The Best Trial Data in Tooth Action ... 79
E. The Best Trial Data in Normal Action ... 81
F. The Worst Trial Data ... 82
3.3.5 Discussion ... 83
A. Sensor Test for All Subjects and All Positions ... 83
B. The Similarities between Dry Sensor and Wet Sensor ... 85
3.4 Sensor Test in Oddball Task ... 87
3.4.1 Participant ... 87
3.4.2 Experiment Procedure and Presentation ... 87
3.4.3 Method of Analysis ... 89
3.4.4 Experiment Results ... 90
3.4.5 Discussion ... 92
A. P300 of Single Stimulus ... 92
B. P300 of Oddball Task ... 92
C. Comparison between Dry and Wet Sensor ... 94
Chapter 4 Conclusions and Future Works
... 954.1 Conclusions ... 95
4.2 Future Works ... 96
List of Figures
Fig. 1- 1: the outward appearance of Quik-cap produced by Neuroscan [6]…………. 4
Fig. 1- 2: The outward appearance of SynAmps RT produced by Neuroscan [6] ... 5
Fig. 2- 1: EEG activities in different frequency bands [5] ... 11
Fig. 2- 2: Blink features ... 13
Fig. 2- 3: The recommended derivation of EOG ... 13
Fig. 2- 4: The EMG electrodes recorded pattern of chin muscle tension [12] ... 14
Fig. 2- 5: The diagram of EEG preprocessing. ... 14
Fig. 2- 6: System overview of our proposed EEG system. ... 15
Fig. 2- 7: (A) Several images of the proposed dry EEG sensor are shown. (B) An exploded view of the proposed dry sensor is presented. Each probe includes a probe, plunger, spring, and barrel.[13] ... 17
Fig. 2- 8: Impedance change data representing the skin-electrode interface on the (a) forehead (F10) and (b) at hairy sites [13] ... 18
Fig. 2- 9: Long-term impedance variation measurements on the forehead site (F10) for wet and dry electrodes [13] ... 19
Fig. 2- 10: Circuitry frameworks overview ... 19
Fig. 2- 11: Left- the RG decides the gain of preamplifier, and the high pass filter of preamplifier decided by RG and C. Right- block diagram of INA2126 ... 21
Fig. 2- 12: Simulation of amplifier’s frequency response in stage 1 ... 22
Fig. 2- 13: High-pass filter circuits. ... 23
Fig. 2- 14: Simulation of amplifier’s frequency response in stage 2. ... 23
Fig. 2- 15: Simulation of amplifier’s total frequency response. ... 24
Fig. 2- 16: The outer appearance and block diagram of CD74HC4067 ... 25
Fig. 2- 17: MSP430 Architecture [14] ... 26
Fig. 2- 18: Operating flow chart in MSP430F1611 ... 26
Fig. 2- 19: Timer A up mode for interrupt function of MSP430F1611 ... 27
Fig. 2- 20: ADC12 Block Diagram [14] ... 28
Fig. 2- 21: Diagram of the sampling and conversion with timer A trigger ... 29
Fig. 2- 22: Transmission buffer ... 29
Fig. 2- 23: Result of noise cancellation by using moving average [15] ... 31
Fig. 2- 24: PCB Blue Tooth antenna [16] ... 33
Fig. 2- 25: Power supply circuit ... 33
Fig. 2- 27: Left- Charging circuit in our portable bio-signal acquisition system. Right-
Block diagram of BQ24010DRC ... 34
Fig. 2- 28: The outward appearance of implemented circuitry ... 35
Fig. 2- 29: TXT file contexts ... 39
Fig. 2- 30: User interface with opening window ... 39
Fig. 2- 31: Appearance of display Program within receiving process ... 40
Fig. 2- 32: (a) P300 [24] (b) Context updating theory of P300 [18] ... 41
Fig. 2- 33: Schematic illustration of the single-stimulus (top), oddball (middle), and three-stimulus (bottom) paradigms [20] ... 44
Fig. 2- 34: Experimental scene description [21] ... 44
Fig. 2- 35: Grand averaged ERP from visual modalities for each task difficulty, stimulus type, and recording site (n = 16) [21] ... 45
Fig. 2- 36: Relationship between P300 and target-to-target interval (TTI) [21] ... 46
Fig. 3- 1: System verification overview ... 48
Fig. 3- 2: Result of 5Hz simulated signal test ... 49
Fig. 3- 3: result of non-linear simulated signal test ... 50
Fig. 3- 4: Results of different frequency test ... 51
Fig. 3- 5: Diagram of circuitry and program test compared to reference system ... 52
Fig. 3- 6: Experiment environment and setting view ... 54
Fig. 3- 7: Experiment procedure in one trial ... 54
Fig. 3- 8: Sensor positions in this experiment, referring to 10-20 system (Guideline for Standard Electrode Position Nomenclature, 2006) ... 55
Fig. 3- 9: The best performance of time domain at FP1 (up) and T3 (down) within “Blink” ... 56
Fig. 3- 10: The best performance of time domain at CZ (up), T4 (mid), OZ (down) within “Blink” ... 57
Fig. 3- 11: The best performance of frequency domain at FP1 (left), T3 (right) within “Blink” ... 58
Fig. 3- 12: The best performance of frequency domain at CZ (left), T4 (right) within “Blink” ... 58
Fig. 3- 13: The best performance of frequency domain at OZ within “Blink” ... 59
Fig. 3- 14: The best performance of time domain at FP1 within “Tooth” ... 59
Fig. 3- 15: The best performance of time domain at T3 (up), CZ (mid), T4 (down) within “Tooth” ... 60
Fig. 3- 16: The best performance of time domain at OZ within “Tooth” ... 61
Fig. 3- 17: The best performance of frequency domain at FP1 (left), T3 (right) within “Tooth” ... 61
Fig. 3- 18: The best performance of frequency domain at CZ (left), T4 (right) within
“Tooth” ... 62
Fig. 3- 19: The best performance of frequency domain at OZ within “Tooth” ... 62
Fig. 3- 20: The best performance of frequency domain at FP1 (left), T3 (mid), CZ (down) within “Normal” ... 63
Fig. 3- 21: The best performance of time domain at T4 (up), OZ (down) within “Normal” ... 64
Fig. 3- 22: The best performance of frequency domain at FP1 (left) and T3 (right) within “Normal”... 65
Fig. 3- 23: The best performance of frequency domain at CZ (left), T4 (right) within “Normal” ... 65
Fig. 3- 24: The best performance of frequency domain at OZ within “Normal” ... 65
Fig. 3- 25: overall results of circuitry and program test. ... 68
Fig. 3- 26: Diagram of sensor basic test ... 69
Fig. 3- 27: Experiment environment of sensor basic test ... 71
Fig. 3- 28: The view of sensor placement. (a) Ground, (b) Dry sensor and wet sensor, (c) Reference ... 71
Fig. 3- 29: The procedure of sensor basic test in one trial ... 72
Fig. 3- 30: Positions of dry sensor and wet sensor in sensor basic test ... 72
Fig. 3- 31: No-use data for floating case and saturation case ... 73
Fig. 3- 32: Diagram of analysis method in sensor basic test ... 74
Fig. 3- 33: Overall results of sensor basic test ... 75
Fig. 3- 34: The best performance of Blink at FP1 ... 76
Fig. 3- 35: The best performance of Blink at T3 (up), CZ (mid), OZ (down) ... 77
Fig. 3- 36: The best performance of Close at FP1 (up), T3 (mid), CZ (down) ... 78
Fig. 3- 37: The best performance of Close at OZ ... 79
Fig. 3- 38: The best performance of Tooth at FP1 ... 79
Fig. 3- 39: The best performance of Tooth at T3 (up), CZ (mid), OZ (down) ... 80
Fig. 3- 40: The best performance of Normal at FP1 (up), T3 (mid), CZ (down) ... 81
Fig. 3- 41: The best performance of Normal at OZ ... 82
Fig. 3- 42: The worst performance during to 60-Hz Electromagnetic Interference .... 82
Fig. 3- 43: The worst performance during to motion artifact ... 83
Fig. 3- 44: The worst performance during to DC shifting ... 83
Fig. 3- 45: Procedure of oddball experiment ... 88
Fig. 3- 46: Positions of dry sensor and wet sensor in oddball task ... 88
Fig. 3- 47: No-use data for floating case, saturation case, and DC shifting ... 89
Fig. 3- 48: ERP of s01 (left-up), s02 (right-up), s03 (left-down), s04 (right-down) in oddball task ... 90
Fig. 3- 49: ERP of s05 (left-up), s06 (right-up), s07 (left-mid), s08 (right-mid), s09
(left-down), s10 (right-down) in oddball task ... 91
Fig. 3- 50: Sensor overall comparison in oddball task ... 94
Fig. 3- 51: Sensor comparisons for all subjects in oddball task ... 94
Fig. 4- 1: The 16-channel electrode positions ... 96
List of Tables
Table 1: Medical and physiological parameters [29] ... 9
Table 2: Common band of EEG [46] ... 10
Table 3: Feature of blink behaviors ... 12
Table 4: Stage details of front-end filter and amplification circuitry ... 20
Table 5: Data format (channel number) ... 30
Table 6: Specification of implemented hardware system ... 36
Table 7: Header of package ... 37
Table 8: data information of package ... 37
Table 9: Channel data ... 37
Table 10: data-encoding method ... 37
Table 11: The maximum and average correlations of time domain at every position within “Blink” ... 58
Table 12: The maximum and average correlations of frequency domain at every position within “Blink” ... 59
Table 13: The maximum and average correlations of time domain at every position within “Tooth” ... 61
Table 14: The maximum and average correlations of frequency domain at every position within “Tooth” ... 62
Table 15: The maximum and average correlations of time domain at every position within “Normal”... 64
Table 16: The maximum and average correlations of frequency domain at every position within “Normal” ... 66
Table 17: Analysis results of Blink in sensor basic test ... 75
Table 18: Analysis results of Close in sensor basic test ... 75
Table 19: Analysis results of Tooth in sensor basic test ... 76
Chapter 1 Introduction
1.1 EEG system
In conventional scalp EEG, the recording is obtained by placing electrodes on the scalp with a conductive gel or paste, usually after preparing the scalp area by light abrasion to reduce impedance due to dead skin cells. Many systems typically use electrodes, each of which is attached to an individual wire. Some systems use caps or nets into which electrodes are embedded; this is particularly common when high-density arrays of electrodes are needed.
Electrode locations and names are specified by the International 10–20 system [1] for most clinical and research applications (except when high-density arrays are used). This system ensures that the naming of electrodes is consistent across laboratories. In most clinical applications, 19 recording electrodes (plus ground and system reference) are used. [2] A smaller number of electrodes are typically used when recording EEG from neonates. Additional electrodes can be added to the standard set-up when a clinical or research application demands increased spatial resolution for a particular area of the brain. High-density arrays (typically via cap or net) can contain up to 256 electrodes more-or-less evenly spaced around the scalp.
Each electrode is connected to one input of a differential amplifier (one amplifier per pair of electrodes); a common system reference electrode is connected to the other input of each differential amplifier. These amplifiers amplify the voltage between the active electrode and the reference (typically 1,000–100,000 times, or 60–100 dB of voltage gain). In analog EEG, the signal is then filtered (next paragraph), and the EEG signal is output as the deflection of pens as paper passes underneath. Most EEG systems these days, however, are digital, and the amplified signal is digitized via
an analog-to-digital converter, after being passed through an anti-aliasing filter. Analog-to-digital sampling typically occurs at 256–512 Hz in clinical scalp EEG; sampling rates of up to 20 kHz are used in some research applications.
During the recording, a series of activation procedures may be used. These procedures may induce normal or abnormal EEG activity that might not otherwise be seen. These procedures include hyperventilation, photic stimulation (with a strobe light), eye closure, mental activity, sleep and sleep deprivation. During (inpatient) epilepsy monitoring, a patient's typical seizure medications may be withdrawn. The digital EEG signal is stored electronically and can be filtered for display. Typical settings for the high-pass filter and a low-pass filter are 0.5-1 Hz and 35–70 Hz, respectively. The high-pass filter typically filters out slow artifact, such as electrogalvanic signals and movement artifact, whereas the low-pass filter filters out high-frequency artifacts, such as electromyographic signals. An additional notch filter is typically used to remove artifact caused by electrical power lines (60 Hz in the United States and 50 Hz in many other countries). [3] As part of an evaluation for epilepsy surgery, it may be necessary to insert electrodes near the surface of the brain, under the surface of the dura mater. This is accomplished via burr hole or craniotomy. This is referred to variously as "electrocorticography (ECoG)", "intracranial EEG (I-EEG)" or "subdural EEG (SD-EEG)". Depth electrodes may also be placed into brain structures, such as the amygdala or hippocampus, structures, which are common epileptic foci and may not be "seen" clearly by scalp EEG. The electrocorticographic signal is processed in the same manner as digital scalp EEG (above), with a couple of caveats. ECoG is typically recorded at higher sampling rates than scalp EEG because of the requirements of Nyquist theorem—the subdural signal is composed of a higher
predominance of higher frequency components. Also, many of the artifacts that affect scalp EEG do not impact ECoG, and therefore display filtering is often not needed.
A typical adult human EEG signal is about 10µV to 100 µV in amplitude when measured from the scalp [4] and is about 10–20 mV when measured from subdural electrodes.[5]
1.2 Previous Work
The international standard measurement instrument like Neuroscan system is used for cognitive experiments by many researchers. Neuroscan provides state of the art systems for the acquisition and analysis of EEG and ERP data. The systems are integrated platforms, designed to allow uncompromising solutions for seamless recording and analysis of EEG data across a variety of domains. Neuroscan has developed multiple hardware (Quik-Cap Electrode Placement System and SynAmps RT) and software systems (SCAN Acquisition software) that combine to build the ideal platform for a particular area of research. Because of this flexibility, the components and the platforms Neuroscan build are not limited to any specific area of research, providing flexibility to move from recordings in one area to another, often, and with the same configuration.
Quik-Cap Electrode Placement System (Quik-Caps, EEG, Fig. 1-1) – Neuroscan offers a variety of Quik-Caps to provide speedy, consistent application of up to 256 electrodes. Quick-Caps are manufactured of highly elastic breathable Lycra material with soft neoprene electrode gel reservoirs for enhanced patient comfort. All electrodes are placed according to the International 10-20 electrode placement standard. Quik-Caps are available in a variety of electrode configurations from 12 to 256 channels as well as in 5 different sizes, and with a variety of electrode materials to meet every lab requirement. Neuroscan strongly recommends the use of Ag/Ag/Cl -
Fig. 1- 1: the outward appearance of Quik-cap produced by Neuroscan [6] sintered electrodes because of their durability and ease of cleaning and re-use. Each cap offering is designed to cover a specific range of sizes.
Using the past two decades of experience and best available technology, Neuroscan is pleased to offer the SynAmps RT (Fig. 1-2) to the Neuroscience community. Dedicated to high-density recordings, SynAmps RT is a 70 Channel amplifier system, consisting of 64 monopolar, 4 bipolar and 2 high-level channels. Each channel has a dedicated 24 bit A-to-D, to ensure the most accurate sampling available. Active Noise Cancellation is an integral feature of the SynAmps RT design, providing unparalleled noise immunity. This ensures an accurate representation of the neurophysiological activity even in the most hostile electromagnetic environments. Using the latest technology has not only allowed us to make the SynAmps RT our most capable amplifier ever, it has also allowed us to put it into a small, cost effective package.
SynAmps RT Consists of Three Components: (1) Headbox - Each Headbox consists of 70 channels, and multiple Headboxes can be linked together to build high-density systems. Our modular approach to amplifiers provides a simple and flexible upgrade path.
All of the essential electronics have been moved to the Headbox. Our low noise 24 bit A-to-D chip allows for low gain to be used while still maintaining the resolution required for the most critical researcher. Data is digitized immediately in the headbox and transmitted to the host computer via a high-speed USB-2 connection guaranteeing lossless transmission. Quality of the signal is assured by our impedance testing circuitry, which allows you to verify impedance both on the Headbox and in a software display. Touch-proof connectors are provided to allow for the greatest flexibility, while our high-density connector permits Quik-CapTM to be easily connected. Inputs for high-level signals are also provided, allowing you to capture the time series data of other measures along with the EEG. (2) System Unit - Serving as a hub for multiple Headboxes, the system unit is the distribution center, assuring absolute synchronization of sampling and triggers between all of the Headboxes. The System Unit is also the communication center with the host computer. Using a USB2 connection, the system unit ensures accurate transmission of data and trigger timing information. (3) Power Unit - Isolation of the subject from the power mains is a critical safety aspect of a complete system. The Power Unit houses a medical grade transformer, allowing you to connect those devices that contact the subject to one reference point. This assures that leakage currents and proper grounding meet world wide certification safety requirements for patient connected devices.
The SCAN Acquisition software serves as the interface to the SynAmps and NuAmps. SCAN Acquisition provides a multitude of recording options which are saved in unique files that can be recalled for each experiment, ensuring that each individual data set is acquired with the same parameters. Even with the numerous options for acquiring the data the software is straightforward and simple to use. The SCAN Analysis software is a comprehensive tool for processing and analyzing EEG and ERP data. With decades of combined experience and active research collaborations with major research labs world wide, the research and development team has strived to implement every major data processing and analytical tool that is typically used as a transform into the SCAN software. The latest advancements included a programming-based batch processing language, a PCA/ICA filter toolbox and EKG and Blink reduction tools. As new developments occur in the field of neuroscience, Neuroscan will continue to develop its solutions for your research.[6]
1.3 Motivation
In this study, we mention the EEG system for wireless and mobile EEG
acquisition purpose. In past study, the standard EEG measurement instruments were very heavy, huge and wired to be not suitable for dairy life applications. We propose the EEG system can overcome the drawback of them, and minimize the hardware frameworks for convenience and light weight. Moreover, we also expect the EEG system monitoring multi-channels signals. In miniature area of hardware system, to implement as possible as we can most channels to simultaneously monitor EEG activities on the whole head.
Traditional wet electrode as Quick-cap produced by Neuroscan needs skin preparation of spread conductive gels between electrodes and skin sites to reduce impedance. In this study, we try to combine dry sensors in our EEG system to measure multi-channels input signals. The goal will be also achieved that this EEG system can be used in dairy life as medical application and the others. Long-term monitoring in EEG system is increasingly important for home care. In sum of the above motivation, we expect to implement miniature multi-channels mobile and wireless EEG system combining dry sensors. In addition, the system also has good reliability for long-term monitoring.
1.4 Organization of Thesis
In chapter 2, the material and method of implementing our proposed EEG system
will be introduced. We will also illustrate the background knowledge of P300 and Oddball task for the following experiment. In chapter 3, we will design the method of system verification and apply it to our system for presenting the performance. There will be four verifying processes going on. We will explain the analysis results for four kinds of verification and discuss how good it can be not only in general test but in standard cognitive experiments. Finally, in chapter 4, we will summarize all consequents as overall conclusions and mention the future works for our system.
Chapter 2 Material and Method
In this chapter, we try to design an EEG system including portable, wireless, multi-channels but miniature specification. It needs not conduction gels for conveniently wearing and taking off for any user in daily life. For these purposes, we research how to establish the most complete and strongest functions using finite hardware resources. In the experimental process, we try to verify our system by going on three experiments. One is the circuitry and program test compared to reference system, one is sensor basic test, and the other is sensor test in Oddball task. Thus, in this chapter, the thesis of P300 and Oddball task is introduced to preview background knowledge of system verification experiment.
2.1 Biosignals
Biosignal is a summarizing term for all kind of signals that can be measured and monitored from biological beings. The term biosignal is often used to mean bio-electrical signals but in fact, biosignal refers to both electrical and non-electrical signals. The study only considers electrical ones. Electrical biosignals are usually taken to be electric current produced by the sum of electrical potential differences across a specialized tissue, organ or cell system like the nervous system. Thus, among the best-known bio-electrical signals are the following difference types [8]. The difference types of Electrical potentials which may be measured on the brain are listed in Table 1[9].
Table 1: Medical and physiological parameters [9]
Parameter Principal Measurement Range of Parameter
EEG 20uV-200uV EMG 10uV-5000uV EOG 50uV-3500uV
2.1.1 Electroencephalogram (EEG)
Electroencephalography (EEG) is the measurement of electrical activity produced by the brain as recorded from electrodes placed on the scalp. When measuring from the scalps, recorded the EEG signal is about 20-200uV for a typical adult human. And a common system reference electrode is connected to the other input of each different amplifier. These amplifiers amplify the voltage between the active electrode and the reference (typically 1,000–100,000 times, or 60–100 dB of voltage gain). The EEG is typically described in terms of rhythmic activity and transients. The rhythmic activity is divided into bands by frequency. The common band of EEG is shown as Table 2 [5] and Fig.2-1.
Table 2: Common band of EEG [5]
Type Frequency (Hz) Delta Up to 4 Theta 4 – 7 Alpha 8 – 13 Beta 13 – 30 Gamma 30-100
Delta wave tends to be the highest in amplitude and the slowest waves. It is seen normally in adults in slow wave sleep. It is also seen normally in babies.
Theta wave is seen normally in young children. It may be seen in drowsiness or arousal in older children and adults; it can also be seen in meditation. Excess theta for age represents abnormal activity. On the contrary this range has been associated with reports of relaxed, meditative, and creative states.
Alpha wave is the "posterior basic rhythm" (also called the "posterior dominant rhythm" or the "posterior alpha rhythm"), seen in the posterior regions of the head on both sides, higher in amplitude on the dominant side. It emerges with closing of the
Fig. 2- 1: EEG activities in different frequency bands [5]
eyes and with relaxation, and attenuates with eye opening or mental exertion. The posterior basic rhythm is actually slower than 8 Hz in young children (therefore technically in the theta range).
Beta wave is seen usually on both sides in symmetrical distribution and is most evident frontally. Beta activity is closely linked to motor behavior and is generally attenuated during active movements. Low amplitude beta with multiple and varying frequencies is often associated with active, busy or anxious thinking and active concentration.
Gamma rhythms are thought to represent binding of different populations of neurons together into a network for the purpose of carrying out a certain cognitive or motor function.[5]
2.1.2 Electrooculography (EOG)
Electrooculography (EOG) is a technique for measuring the resting potential of the eyeball. Mostly, there are two electrodes placed above and below the eye, and the resulting signal is called vertical EOG. If the eye is moved from center position toward left or right, then one of the electrodes would see the positive side of the eyeball and the other would see the negative side. There would be a potential difference between the electrodes. If we assumed the resting potential as a constant, then the potential difference become a measure for the eye position called eye movement measurements [10].
Eye movement measurements is usually used as a reference of stages of sleep which included three main stages called: awake, REM and NREM. Eye movement is significantly difference during these three stages, so lots of research of sleep used this measurement to observe variation. In this study, the vertical EOG is derived using three electrodes: input, reference and ground. Two electrodes (FP1,FP2) are placed above the left and right eyes as the input and the other below the right ear as the reference signal. There is also an electrode as ground fixed on the center of forehead (the same as the ground signal of EEG). The feature (Fig. 2-2) of these blink behaviors is listed in Table 3. The recommended placement of EOG is shown as Fig 2-3.
Table 3: Feature of blink behaviors Behavior Description
Blink amplitude A typical blink has an amplitude of 400uV Blink duration Nearly 200ms – 400ms for one blink
Fig. 2- 2: Blink features
GND
REF
IN
Fig. 2- 3: The recommended derivation of EOG
2.1.3 Electromyogram (EMG)
Electromyography (EMG) is a technique for evaluating and recording the electrical activity produced by skeletal muscles. EMG is performed using an instrument called an electromyograph, to produce a record called an electromyogram. An electromyograph detects the electrical potential generated by muscle cells when these cells are electrically or neurologically activated.[11]
The brainwave acquisition system not only regularly monitors EEG signal across cortex by time to time, but also may measure electrical activity produced by skeletal muscles near the chin when users grinding or gripping their teeth. This EMG signal which is transmitted along chin muscle surrounding to the skin on the brain is referred to high-frequency and high-amplitude noise of brainwave. Hence, one of goals of EEG preprocessing technique is to remove EMG noise as much as possible to enhance EEG signal-to-noise ratio.
Fig. 2- 4: The EMG electrodes recorded pattern of chin muscle tension [12]
2.2 EEG Signal Preprocessing
The EEG preprocessing steps are shown in Fig. 2-5. Raw data which generated from cortex in the brain consists of whole frequency, and electrical activity in which is very tiny to be easily covered by other higher-amplitude potentials or noises produced from body. DC is one of unwelcome noises. Thus, for the microvolt-scale EEG data of interest, the input one-channel EEG signal passes a high-pass filter with a cutoff frequency of 0.1 Hz in first step. Next, the filtered data which has around 20uV-200uV of potential range is amplified to 5500 times, and then output around 110mV-11V of potential range. Before amplified data being saved to buffer, it will be down sampled to 125Hz first for the purpose of reducing data size, and be filtered 60Hz noise from the environment by moving average. Finally, the digital data saved in the buffer accomplishes EEG preprocessing.
2.3 Method of Data Acquisition and Record
In this session, we focus on this whole system hardware. Following the design flowchart, we will introduce the design methods of hardware circuits and firmware structures steps by steps.
2.3.1 System Overview
Fig. 2- 6: System overview of our proposed EEG system.
The major work in this study is to establish a hardware system which can be applied to front-end dry sensors and back-end received program to implement a multi-channels mobile and wireless EEG system. Our proposed EEG system has three parts as Fig. 2-6: (1) dry sensors, (2) a multi-channels mobile and wireless EEG acquisition circuitry, (3) an EEG display program.
Human brain is sphere-like and also has a little of resistance in hair site. One dry sensor was created to have multi-metal-columns of adjustable length, so it could perfectly fit user’s curvature skin on the brain just like wet sensor, avoid hair site, and let user feel non-pricking as well as comfortable. Every dry sensor placed on the whole head continuously monitored electrical activity carried from the cortex of user’s brain, and transmited EEG signals to front-end filter and amplification circuit
via linking wires. Multi-channels front-end circuit included Instrumentation amplifiers, filters and amplifiers for upgrading Signal-to-Noise Ratio (SNR) of received raw EEG data. Moreover, the 0.1Hz high-pass filter could reduce DC shifting influence of dry sensors and exactly improve innate shortcoming of dry sensors. Then, multi-channels signals would be sequentially passed to micro-controller by a 16-to-1 multiplexer of fast switching rate. For being limited by the speed of multiplexer, the output signal was down sampled to 125Hz. Then, an Analog-to-Digital Converter (A/D) transferred analog signal to digital data. Buffer saved digital data until UART receiving request of wireless transmission circuit. If the request was accepted, UART would transmit the multi-channels digitized data to Wireless Transmission Circuit, and then Wireless Transmission Circuit carried the whole EEG data to back-end EEG display program in PC via Bluetooth. In this EEG preprocessing, Power Management Circuit always provided stable 3V to every chip of hardware system. If the power was too low, Power Management provided power until 0.8V by which micro-controller would be off.
The major work of back-end record program in PC, which simultaneously received events of experiment and EEG digital data from Bluetooth, was to show the multi-channels digital-to-analog signal on a frame in real-time and also saved all digital data as a file.
2.3.2 Dry Sensor
In the present study, novel dry-contact sensors for measuring EEG signals without any skin preparation are designed, fabricated by an injection molding manufacturing process and experimentally validated. Conventional wet electrodes are commonly used to measure EEG signals; they provide excellent EEG signals subject to proper skin preparation and conductive gel application. However, a series of skin
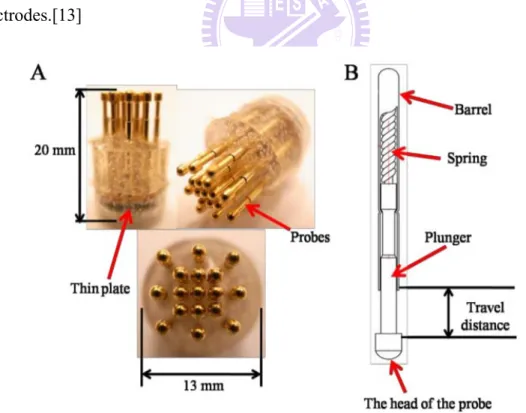
preparation procedures for applying the wet electrodes is always required and usually creates trouble for users. To overcome these drawbacks, novel dry-contact EEG sensors were proposed for potential operation in the presence or absence of hair and without any skin preparation or conductive gel usage. The dry EEG sensors designed to include a probe head, plunger, spring, and barrel (Fig. 2-7). The 17 probes were inserted into a flexible substrate using a one-time forming process via an established injection molding procedure. With these 17 spring contact probes, the flexible substrate allows for high geometric conformity between the sensor and the irregular scalp surface to maintain low skin-sensor interface impedance. Additionally, the flexible substrate also initiates a sensor buffer effect, eliminating pain when force is applied. The proposed dry EEG sensor was reliable in measuring EEG signals without any skin preparation or conductive gel usage, as compared with the conventional wet electrodes.[13]
Fig. 2- 7: (A) Several images of the proposed dry EEG sensor are shown. (B) An exploded view of the proposed dry sensor is presented. Each probe includes a probe,
In this study, we use dry sensors to monitor EEG activity which is distributed on the whole head because of dry sensors would be verified more suitable for hairy-site placement and long-term measurement than wet electrodes. As Fig. 2-8 shown, the results indicate that the impedance of the proposed dry EEG sensor is close to that of the wet electrode and is even lower on the hairy site. Significantly, the flexibility of the proposed dry EEG sensor is effective in tightly contacting the scalp surface and providing clear EEG signals without any skin preparation or conductive gel usage.[13] As Fig. 2-9 shown, the drawback of wet electrodes which could not maintain the same impedance in long time, but dry sensor can improve this problem to maintain the pretty tiny varies of impedance compared to wet sensor. After measuring one hour, the impedance of wet sensor eventually is larger than of dry sensor.
Fig. 2- 8: Impedance change data representing the skin-electrode interface on the (a) forehead (F10) and (b) at hairy sites [13]
Fig. 2- 9: Long-term impedance variation measurements on the forehead site (F10) for wet and dry electrodes [13]
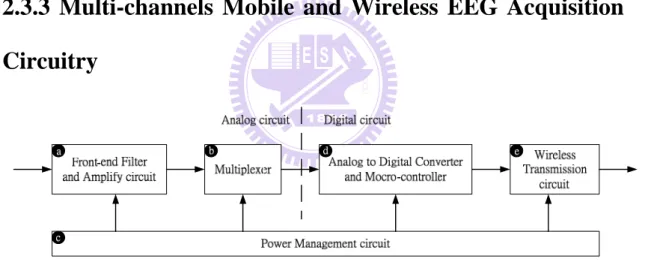
2.3.3 Multi-channels Mobile and Wireless EEG Acquisition
Circuitry
Fig. 2- 10: Circuitry frameworks overview
The multi-channels mobile and wireless EEG acquisition circuitry combines the power, amplifier, high pass filter, ADC, and wireless controller into one. It is a light weight, miniature, and wireless monitor for recording EEG signals. It owns 16-channel EEG-signal measurement. The multi-channels mobile and wireless EEG acquisition circuitry mainly contains two subsystem: (1) analog circuit: (a) front-end filter and amplification circuit, (b) multiplexer, (c) power management circuit; (2) digital circuit: (a) analog to digital converter and micro-controller, (b) wireless
transmission circuit and. The diagram of the mobile and wireless EEG acquisition circuitry is shown as Fig. 2-10.
In this study, the major work is we miniaturize the physical size of hardware as possible as we can, but do not decrease the necessary functions of EEG system. So that sometimes we have to trade of size and function to get the best performance to implement it. Finally, the EEG hardware system can amplify original signal to 5500 times, filter upper 0.1Hz frequency band, and sample to 125Hz digital data. As the following, we explain sequentially the procedure of trading of size and function in every function module.
2.3.3.1 Front-End Filter and Amplification Circuit
The front-end circuit consisted of Instrumentation amplifier and high-pass filter. In some researches, other circuit designs preferred to use unit gain filters and one variable gain amplifier. Moreover, they didn’t use a high-pass filter to cut-off the noise in low frequency band. In this study, Dry sensor has an innate shortcoming because motion artifact and DC shifting. To improve them, front-end circuit needs high pass filter to maintain the typical EEG information in low power range without saturation. Besides, if the total magnification is very large about 5500 times, the filter circuit has to include “big” capacities. For miniaturization purpose, it’s not an ideal design. Once technically allocating two stages for amplifying, this problem can be solved. Hence, we design two stages (Table 4) in which the first stage is Instrumentation amplifier including high pass function, and the second stage is also high pass filter amplifier.
Table 4: Stage details of front-end filter and amplification circuitry
Stage Amplifier Gain High-pass cut-off frequency
1 Instrumentation amplifier 5.5 0.1
A. Instrumentation Amplifier
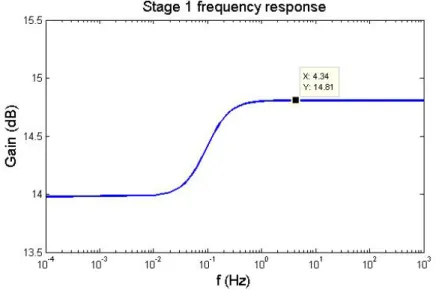
Instrumental amplifier INA2126 was used as the first stage of analog amplifier. INA2126 consists of 2 channel instrumentation amplifiers into one package. INA2126 owns an ultra low input current and a high common-mode rejection ratio (CMRR) about 90dB. A high CMRR is important in applications that the signal of interest is represented by a small voltage fluctuation superimposed on a (possibly large) voltage offset, or when relevant information is contained in the voltage difference between two signals. Instrumental amplifier INA2126 provided not only the function of gain, but also that of one stage high pass filter by adding a capacitor. The output voltage of the INA2126 is referenced to the voltage on the reference terminal. INA2126EA/250G4 we selected was DBQ package drawing and about 5mm x 6mm size. The Instrumentation amplifier circuit design is shown in Fig. 2-11 and the simulation of frequency response is in Fig. 2-12.
Fig. 2- 11: Left- the RG decides the gain of preamplifier, and the high pass filter of preamplifier decided by RG and C. Right- block diagram of INA2126
80 5 G k Gain R = + 0 1 2 G f R C π = ⋅ ⋅
Fig. 2- 12: Simulation of amplifier’s frequency response in stage 1
B. High Pass Filter
In this thesis, operational amplifiers were used to achieve the function of band-pass filter. The AD8609 is quad micro-power rail-to-rail input and output amplifiers and low dc offset was chosen to be high pass filter. Fig. 2-13 shows one channel High-pass filter circuits. The 3dB cutoff frequency of high pass was decided by passive components R3, R4, C1 and C2; and the other component R1, and R2 are responsible for enhancing magnification. AD8609AR we selected was 14-Lead SOIC package description and about 8.5mm x 6mm size. Fig. 2-14 shows the simulation of amplifier’s frequency response (EEG) in stage 2 and Fig. 2-15 shows the simulation of amplifier’s total frequency response.
2 1 1 R Gain R = + 3 4 1 2 1 2 H f R R C C π =
Fig. 2- 13: High-pass filter circuits.
Fig. 2- 15: Simulation of amplifier’s total frequency response.
2.3.3.2 Multiplexer
As shown forward, for Multi-channels EEG system design, we select INA2126 x 8 and AD8609 x 4 to measure 16 channel bio-signals. The analog information would carry to next stage – analog-to-digital converter (A/D), but the number of A/D is finite. Hence there was need a multiplexer sequentially pass analog information to A/D. In other words, the major work of Multiplexer is Allocating finite resource to Multi-channels.
In addition, next issue is which stage multiplexer suited to serve. To consider that tiny analog signal mixing noise from environment go through multiplexer may mix other noise more, the amplified analog signal (noise is smaller than real EEG signal) fitted to be the input of multiplexer. Therefore, Multiplexer placed behind front-end circuit and forward A/D of micro-controller.
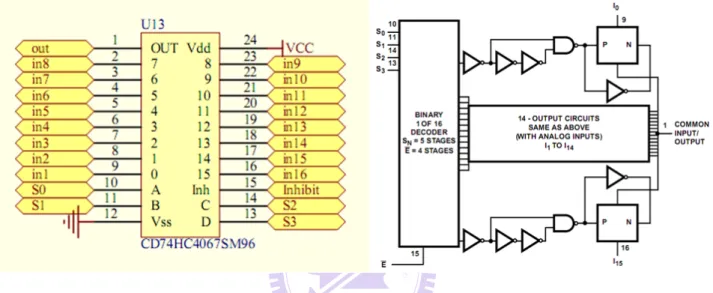
CD74HC4607 is a 16-to-1 multiplexer, and it can be fabricated to about 8mm x 8mm size (CD74HC4607SM96) by very small package SSOP. We researched the sizes of 2-to-1 multiplexer x 8, 4-to-1 multiplexer x 4, and 8-to-1 multiplexer x 2 were all not smaller than a 16-to-1 multiplexer for the smallest package in existing fabrication procedure. As shown by Fig. 2-16, select pin S0, S1, S2, and S3 and
select-valid pin Inhibit was linked to output pin of micro-controller. Output pin - out was linked to A/D of micro-controller. Multiplexer should achieve passing analog signal from input to output into 250 us in which micro-controller make select pin “On”. Because the maximum transmission time of CD74HZ4607 is about 300 ns in 25°C temperature, it made no problem for high-speed 16-to-1 Multiplexer CD74HZ4607.
Fig. 2- 16: The outer appearance and block diagram of CD74HC4067
2.3.3.3 Analog to Digital Converter and Micro-controller
For the data acquisition system, it needs a controller to organize the working of ADC and encode the digital data to Bluetooth module by UART port.The MSP430 is particularly well suited for wireless RF or battery powered applications. The MSP430 incorporates a 16-bit RISC CPU, peripherals, and a flexible clock system that interconnect using a von-Neumann common memory address bus (MAB) and memory data bus (MDB) shown as Fig. 2-17. The clock system is designed specifically for battery-powered applications. Dedicated embedded emulation logic resides on the device itself and is accessed via JTAG using no additional system resources. We configure with built-in 16-bit Timer A, a fast 12-bit A/D converter, one
universal serial synchronous/asynchronous communication interfaces (USART) and 4M Hz external oscillator to development our design [14].
Fig. 2- 17: MSP430 Architecture [14]
Timer A triggers Analog to Digital Converter, and buffers the output data of ADC until buffer full. And then all buffer data will be transmitted via USART. The operating flow chart in MSP430F1611 was shown in Fig. 2-18.
Fig. 2- 18: Operating flow chart in MSP430F1611
A. Timer Interrupt
set first, as shown in Fig. 2-19. When the timer counted to the TACCR0 value, the TACCR0 CCIFG interrupt flag would be set. When the timer counted from TACCR0 to zero, the TAIFG interrupt flag would be set. In our Mobile EEG acquisition module, 4.096MHz crystal oscillator was used as system clock of MSP430F1611, and TACCR0 is set to 1024 for making a rate 4 kHz.
4.096M
T AC C R 0= 1024
4k =
Fig. 2- 19: Timer A up mode for interrupt function of MSP430F1611
Time A uses 4 kHz to control select pin of multiplexer via output pin of MSP430, so the switching rate from one channel to the other one is 2 kHz. When finishing the sequential visit for all channels, total time is 8 ms. In this way, our propose system can implement 125Hz of sampling rate to catch analog signal.
B. Analog to Digital Converter
In this system, for passing the signal through wireless, it needs an analog to digital converter to convert the continuous signal to discrete number. To suit with the filtered and amplified signal from front-end circuit, built in ADC of MSP430 was chosen to be an analog to digital converter.
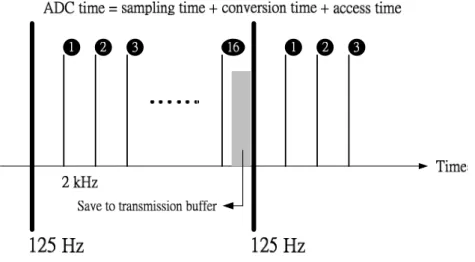
Fig. 2-20 shows ADC12 Block Diagram. The ADC12 module supports fast, 12-bit analog-to-digital conversions. The module implements a 12-bit SAR core, sample select control, reference generator and a 16 word conversion-and-control
buffer. The conversion-and-control buffer allows up to 16 independent ADC samples to be converted and stored without any CPU intervention [14]. The ADC12 inputs are multiplexed with the port P6 (A0-A7) pins, which are digital CMOS gates. An analog-to-digital conversion is initiated with a rising edge of the sample input signal SHI. The signal SHI will be set by interrupt routine of timer A at 2 kHz. The ADC12 module is configured by three control registers, ADC12CTL0, ADC12CTL1 and ADC12MCLTx. Those registers are set to enable core, select conversion clock, set conversion mode, sample and input channels define. In our system, we used the “one channel, single conversion each” mode. In this mode, the certain channel is sampled and converted once. Fig. 2-21 shows a diagram for sampling time and conversion time of ADC with trigger by timer A. Therefore, the conversion time of ADC is fast enough to fit the requirement of the sampling rate of the whole system. The ADC result of each channel will be 12 bits long in the form of an unsigned integer whose value is: 4095* Ax -
Vr+ -
Fig. 2- 21: Diagram of the sampling and conversion with timer A trigger
Fig. 2- 22: Transmission buffer
When conversion results are written to a selected ADC12MEMx, the corresponding flag in the ADC12IFGx register is set. An interrupt request is generated if the corresponding ADC12IEx bit and the GIE bit are set. After ADC12IFGx register set, the interrupt service routine of ADC started. In the interrupt service routine, we buffered ADC12MEMx. Next, a moving average filter was used to remove 60-Hz power interference, and then filtered signal data was encoded before wireless transmission. Fig. 2-22 shows transmission buffer, and Table 5 shows data format saved in transmission buffer.
Table 5: Data format (channel number)
Header information data
ff 74 (1) high byte (1) low byte (2) high byte (2) low byte …… (16) high byte (16) low byte
C. Moving Average
Moving average, also called rolling average or running average, is usually used to analyze a set of data points by creating a series of averages of different subsets of the full data set. Moving average can be applied to any data set, however, it is most commonly used with time series data to smooth out short-term fluctuations and highlight longer-term trends or cycles. The choice between short- and long- term, and the setting of moving average parameters depends on the requirement of application. Mathematically, moving average is a type of convolution and is similar to a low-pass filter used in signal processing. The moving average filter is optimal for a common task: reducing random noise while retaining a sharp step response. This makes it as the premier filter for time domain encoded signals.
Given a sequence
{ }
N1 i ia = , the output of an n-moving average is a new sequence
{ }
1 1N n i i
s =− + defined as the average of subsequences of n terms. The formula of moving
averaging was shown as followings.
1 1 1i n i j j s a n + − = =
∑
Therefore, the sequences s of n-moving averages when n n=2,3 can be expressed
as
(
)
2 1 2 2 3 1 1 , ,..., 2 n n s = a +a a +a a − +a(
)
3 1 2 3 2 3 4 2 1 1 , ,..., 3 n n n s = a +a +a a + +a a a − +a − +aFig. 2-23 shows the results of noise cancellation by using moving average. A function generator was used to generate sin wave, and our portable bio-signal acquisition system was used to record this signal. If our portable acquisition module was close to some electric instruments, the signal recorded from the acquisition module would be easily influenced by noise of 60 Hz power line. In the above figure of Fig. 2-23, it showed that the original sin wave had been contaminated by 60Hz power-line noise. After filtering by using moving average with 2-point moving window, we found moving average could effectively remove power-line noise, as shown in the below figure of Fig. 2-23.
_ 125
_ _ 2.08
60 60
Sample rate
Num of window= = =
Fig. 2- 23: Result of noise cancellation by using moving average [15]
D. UART Interface
In asynchronous mode, USART connected MSP430 to external systems via two external pins, URXD and UTXD. In UART mode, USART transmitted and received characters at a bit rate asynchronously to another device. Timing for each character
was based on the selected baud rate of USART. In our study, the transmitter and receiver used the same baud rate. For initializing UART, RX and TX had to be enable first, and then decided the baud rate of UART and disable SWRST. The required division factor N for determining baud rate was listed as followings:
BRCLK N
baud rate
=
Here, BRCLK was 4 MHz, and baud rate was 115200 bit/s. After initializing UART, the micro-controller could transmit data filtered by moving average to BLUE TOOTH module via UART.
2.3.3.4 Wireless Transmission
Bluetooth is a wireless protocol utilizing short-range communication technology to facilitate data transmission over short distances from fixed and/or mobile devices. The intent behind the development of Bluetooth was the creation of a single digital wireless protocol, capable of connecting multiple devices and overcoming issues arising from synchronization of these devices. In this study, Bluetooth module BM0203 was used. BM0203 is an integrated Bluetooth module to ease the design gap and uses CSR BuleCore4-External as the major Bluetooth chip. CSR BlueCore4-External is a single chip radio and baseband IC for Bluetooth 2.4GHz systems including enhanced data rates (EDR) to 3Mbps. It interfaces to 8Mbit of external Flash memory. When used with the CSR Bluetooth software stack, it provides a fully compliant Bluetooth system to v2.0 of the specification for data and voice communications. All hardware and device firmware of BM0203 is fully compliant with the Bluetooth v2.0 + EDR specification. Bluetooth operates at high frequency band to transmit wireless data, so it can be perfect worked by using a PCB antenna, as shown in Fig. 2-24.
Fig. 2- 24: PCB Blue Tooth antenna [16]
2.3.3.5 Power Management
Power Management circuit in our Mobile EEG acquisition circuitry includes two parts: one is power supply circuit, and the other is charging circuit.
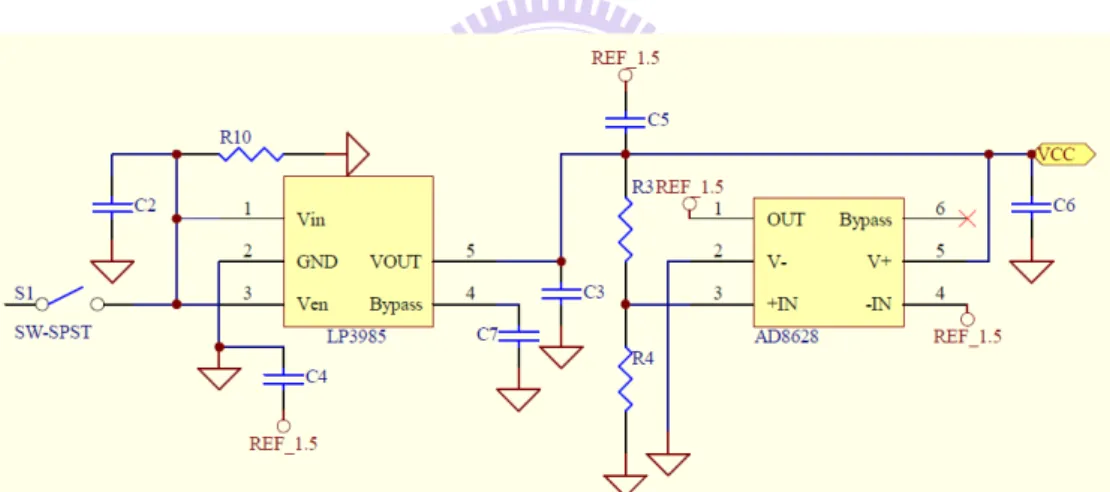
A. Power Supply Circuit
Fig. 2- 25: Power supply circuit
In our portable bio-signal acquisition system, the operating voltage VCC was at 3V, and the virtual ground of analog circuit was at 1.5V. In order to provide stable 1.5V and 3V voltage, a regulator LP3985 (Fig. 2-26) was used to regulate battery voltage to 3V. LP3985 is a micro-power, 150mA low noise, and ultra low dropout CMOS voltage regulator. The maximum output current can support 550mA. Furthermore, the turn-on time can reach 200μs. A voltage divider circuit was used to divide 3V voltage into 1.5V, and a unity amplifier constructed from AD8628 was used to provide a voltage buffer. The total power supply circuit was shown in Fig. 2-25.
B. Charging Circuit
The charging circuit BQ24010DRC had integrated power FET and current sensor for 1-A charging applications. The maximum charging current can arrive at 1A. The battery’s power would be detected automatically by charging circuit and switched to charging mode when battery’s power was not enough. BQ24010DRC also protected battery to avoid over charging or over driving [16]. The charging circuit was shown in Fig. 2-27.
Fig. 2- 27: Left- Charging circuit in our portable bio-signal acquisition system. Right- Block diagram of BQ24010DRC
2.3.4 Implementation of the EEG Acquisition Circuitry
The demand factors of our proposed EEG acquisition circuitry are lightweight, miniature, multi-channels, portable, wireless, and long-time monitoring. All of these are indeed implemented on a board, which is called “16-channel EEG device”. This device is only 50mm x 60mm large finally. Furthermore relative standard EEG measurement system like Neuroscan system, it improves convenience, practicality, and wide application. Real-time operation test verifies this circuit can be used about 10 hours. Hence, it is suitable for general long-term monitoring in daily life for most of users, even through for medical use and for scientific experiments. The outward appearance of implemented circuitry is showed by Fig. 2-27.
In design procedure, we found out the best parameters of circuit by MATLAB simulation. Moreover, the cut-off frequency of high-pass filter is 0.2Hz for physical device different from 0.1Hz we expected. Although a little error in design, the device measures EEG activity of interest is very enough. Besides the cut-off frequency, the other specifications of device are almost same as our design. As Table shown, the specification of 16-channel EEG device is listed. Table 6 shows Specification of implemented hardware system.
Table 6: Specification of implemented hardware system
Type Mobile and Wireless EEG Acquisition Circuitry
Channel Number 16
Size 50 mm × 60 mm
Weight < 50 g
Power 3V
Power capacity about 10 hours
Battery rechargeable Lithium 3.7V 450mAh
Recharge port Mini USB
Power Supply Rejection Ratio 88 dB
Input impedance 10 GΩ
Input Common Mode Rejection Ratio 90 dB
Input signal range ± 272.7 uV compared to reference potential
Gain 5500
Bandwidth 0.2 Hz ~ 62.5Hz
ADC resolution 12 bits
Sampling rate 125 Hz
Communication interface Bluetooth 2.0
Transmission baud rate 115200 bit/s
2.3.5 EEG Display Program
EEG display program is designed for two purposes: (1) display record EEG data on the frame, (2) save record data to a file. This session explains the method of display program steps by steps.
2.3.5.1 Receive Package and Display
A. Package Protocol
For display purpose, we expected the program received transmission digital data package continuously via Bluetooth. The data package format follows MSP430 encoding which explained in Table 5 of session 2.3.3.3 B. which is including one byte of header, one byte of data information, and 16 channel data. The program recognizes out package header through checking receiving data from byte to byte. On the other words, this program owns itself communication protocol, which once finding out common header, begins to decode certain package information and the following fix length of data. Table shows package protocol and function (2-1) shows decode thesis.
_ _
_ 2data value, _ 2data value
Sampling rate= Channel number= (2-1)
Table 7: Header of package
Header Data information
f f Sampling rate Channel number
Table 8: data information of package
data value 0 1 2 3 4 5 6 7 8 9 10
Sample Rate / Channel number
1 2 4 8 16 32 64 128 256 512 1024
Table 9: Channel data
Channel data
(1) high byte (1) low byte (2) high byte (2) low byte …… (16) high byte (16) low byte Table 10: data-encoding method
High byte Low byte
B. Display Digital Data to Analog Signal
The actual EEG signal needs a function to convert digital data to analog data. See the thesis:
_
_
_ _ ( ) _ _
2ADC resolution
data value
Actual EEG signal= ×Power −Virtual GND potential
12 _ ( 3) 0.5 2 data value = × −
The program already defaults ADC resolution is 12 bits and isn’t adapted by user interface. As for the actual potential value is not influence the method of display. After the program receive the 0-4096 range of data value, it just plots multi-channels data values in width-required frame, and shows the curve length according to sampling rate from package information and the number of display second from user interface.
2.3.5.2 Save Data as a File
Display program which was installed in the computer continuously receives digital data packages one by one via Bluetooth if it is started. In the beginning, user interface would ask user whether to save data as a file or not. If the save request is set, the program not only displays real-time converted analog signal but also saves received digital data as a TXT-format file simultaneously. In the TXT file, data package is saved as a row value once, and each channel data is saved as column value. The first column means the first channel data, and the second column means the second channel ones, and so on. From left to right put each channel data in order and the final column means the 16-th channel data or event value if user needs. Incidentally referring, the program record received event data with the rate of receiving. Program would get event file name and event input comport from user interface. So that every time the program receives one package, it synchronously checks certain input comport whether receiving event information or not. If event
value appears, the program recognizes it and save a value in final column behind 16 columns. However, if event value doesn’t appears, the program just save zero value in this event column. As following, Fig. 2-29 shows data appearance in TXT file.
a Package received once
Event column if needed
certain Channel data received by time
Left to right: Channel 1 to 16
Fig. 2- 29: TXT file contexts
2.3.5.3 User’s Guide
As Fig. 2-30 shown, the 1st row mentions certain Bluetooth module using now. After opening this program, user can click “Refresh” button to search existing Bluetooth modules in finite distance. The 2nd row asks user that this program is going to display how much time for EEG real-time signal. The 3rd row asks user whether to save receiving data as a TXT file or not. If yes, please select a new file name. The 4th row asks user whether simultaneously receiving event value via a specified comport or not. The 5th row asks user whether to let program automatic checking the synchronization between event and channel data. After finished above request menu, user can click “Beginning” button to start this program. In addition to, to click “Quit” button stops this ongoing program. Moreover, Fig. 2-31 shows the window once starting to receive EEG data.
2.4 Experiment: P300 and Oddball task
For system verification purpose, we need a standard cognitive experiment to make sure our proposed mobile and wireless system can measure tiny EEG activity even though Event-Related Potential (ERP). Thus, we introduce P300 and Oddball task in this session progressively.
2.4.1 P300
Event-related potential (ERP) refer to averaged EEG responses that are time-locked to more complex processing of stimuli; this technique is used in cognitive science, cognitive psychology, and psychophysiological research. An event-related potential (ERP) is any measured brain response that is directly the result of a thought or perception. More formally, it is any stereotyped electrophysio- logical response to an internal or external stimulus.[24]
Fig. 2- 32: (a) P300 [24] (b) Context updating theory of P300 [18]
The P300 (Fig. 2-32 (a)) is a positive component of the event-related potential (ERP) that peaks 300ms or more (up to 900 ms) after a stimulus. Unlike some of the earlier evoked potentials, it is supposed to be an “endogenous” component in the
sense that it depends very much on the processing of the stimulus context and levels of attention and arousal (Polich and Kok 1995). The P300 has commonly been investigated with “oddball” paradigms, in which occasional relevant (“target”) stimuli have to be detected in a train of frequent irrelevant “non-target” or “standard” stimuli. Such oddball paradigms reliably yield P300 responses with a parietocentral scalp distribution to target compared to standard stimuli irrespective of stimulus (visual, auditory, somatosensory) or response (button press, counting) modality. Interestingly, P300 responses are also observed when trains of regular stimuli are interrupted by stimulus omissions, which underlines the endogenous nature of this component.
The amplitude of the P300 increases with lower probability and higher discrimination of targets. Its latency increases when targets are harder to discriminate from standards but not when response times increase for other reasons. P300 latency is thus an attractive tool to separate the mental chronometry of stimulus evaluation from response selection and execution (Coles and others 1995). The P300 is widely believed to be a neural signature of the mechanisms required to change the mental model of the environment to make an appropriate response (Polich 2003). In terms of classical cognitive domains, both attention (selecting the deviant stimulus from the train of irrelevant stimuli) and working memory (supporting this process by maintaining the features of the standard stimulus for comparison) seem to be involved. However, the higher amplitude of the P300 for easily discriminated targets (that is, when demand on working memory should be low) and the lower amplitude in tasks with high memory load (Kok 2001) indicate that the interplay between attention and working memory in the generation of the P300 is not straightforward and certainly not simply additive.[18]
![Fig. 1- 2: The outward appearance of SynAmps RT produced by Neuroscan [6]](https://thumb-ap.123doks.com/thumbv2/9libinfo/8402998.179311/20.892.140.756.882.1118/fig-outward-appearance-synamps-rt-produced-neuroscan.webp)
![Table 2: Common band of EEG [5]](https://thumb-ap.123doks.com/thumbv2/9libinfo/8402998.179311/25.892.200.677.550.754/table-common-band-of-eeg.webp)
![Fig. 2- 4: The EMG electrodes recorded pattern of chin muscle tension [12]](https://thumb-ap.123doks.com/thumbv2/9libinfo/8402998.179311/29.892.198.711.134.313/fig-emg-electrodes-recorded-pattern-chin-muscle-tension.webp)
![Fig. 2- 8: Impedance change data representing the skin-electrode interface on the (a) forehead (F10) and (b) at hairy sites [13]](https://thumb-ap.123doks.com/thumbv2/9libinfo/8402998.179311/33.892.106.778.560.950/impedance-change-representing-electrode-interface-forehead-hairy-sites.webp)