Competitive Advantages
Wei-Ru Chen
Depar tment of Inter national Business National Taiwan Univer sity
50, Lane 144, Keelung Rd. Sec. 4, Taipei, Taiwan R.O.C.
Ming-J e Tang (pr esenter ) Depar tment of Inter national Business
National Taiwan Univer sity
50, Lane 144, Keelung Rd. Sec. 4 Taipei, Taiwan, Republic of China Tel: 011-886-2-2363-8424
Fax: 011-886-2-2363-8399 email: ibtang@ccms.ntu.edu.tw
2
Industr y Str uctur e and Resour ces as Deter minants of Sustainable
Competitive Advantages
Abstr act
This paper utilizes 6-year American manufacturing business data to examine the existence and determinants of persistent superior returns. It presents that industry-level imitation barriers accruing to market power and industry structure, and firm-level resources renewal variables derived from resource-based view and dynamic capabilities paradigm, have significant impact on the sustainability of competitive advantages of the first half business. In addition, we also find that the industrial environment factors influence the sustainability of superior returns not only through direct effects, but also via interactive effects with firm level factors.
Introduction
The quests for competitive advantages and how to sustain competitive advantages to achieve superior performance are two primary issues in strategic management. Based on the Neoclassical perfect competition model, however, due to perfect information and resource mobility, no extra profits and thus no sustainable competitive advantages exist when the market reaches equilibium. Volumes research has discussed the attributes of resources and capabilities that constitute a competitive advantage. Early in the Neoclassical perfect competition model, Later theories in industrial organziation, resouce-based view of the firm, and strateigc management generally recongize the existence of above-normal returns owing to industrial structure and/or heterogeneous reosurces possessed by the firm.
dAlthough sustaiable competitive advantage could theoretically exist, a fundamental question is, empirically, whether sustainable competitive advantages do exist in the industry
ittive adavntages and Many scholars recently devoted to the theoretical development of sustainable competitive advantages. They focused on identifying what are the attributes of resources, capabilities to be competitive advantages and finding out by what mechanisms can these advantages be sustained. However, do sustainable competitive advantages really exist in the increasingly changing marketplace ? How to measure the existence ? Early in the Neoclassical perfect competition model, there exists no excess profit at market equilibrium because of perfect information and resource mobility. Later theories in industrial economics and business strategy, however, recognize the existence of above-normal returns owing to industrial structure or heterogeneous resources possessed by a firm. The first purpose of this paper is to examine the existence of sustainable competitive advantages by verifying the sustainability of superior financial performance related to competitors.
4
The next important question is what effect the sustainability of competitive advantages ? In Bain-type industrial organization (IO) economics and competitive forces model (e.g., Porter), industrial structure (e.g., entry barriers, concentrations) and market power (e.g., market shares, firm size) are regarded as the industry level isolating mechanisms for dominant firms to protect their current competitive advantages from imitation. Further, the resource-based theory (e.g., Rumelt, Wernerfelt, Barney) and dynamic capabilities paradigm (e.g., Teece, Winter) emphasized not only on isolating mechanisms, but also on continuous resources renewal and technology innovation. The second purpose of this paper is to examine the combination effects derived from the above two research streams on the sustainability of competitive advantages.
Previous empirical studies used to argue whether industry effects or firm effects play more important roles on business-unit returns (e.g., Schmalaensee, Rumelt). Most of them, however, didn’t identify what are the contents of each effect. This paper is going to explore how the specific contents of industry factors (e.g., industrial sales fluctuation, market demand growth), firm-level factors, and cross effects of both influencing the sustainability of competitive advantages of first half leading firms.
Sources of persistent above-normal returns
There are different rationales in explaining sources of above-normal returns among previous theories developed in industrial organization economics and business strategy paradigms (Conner, 1991; Teece, Pisano & Shuen, 1997). This section briefly reviews the evolution of these theories.
Neoclassical Perfect Competition Theory
In the perfect competition model, the firm combines resources to produce products. Under the assumption of standardized products, numerous firms in the markets, no entry barriers and each firm as a price taker (Stingler, 1957; Singer, 1981), firms are identical to obtain the right inputs because of perfect information and resource mobility. Thus, the individual firm’s objective to maximize profits yields a market equilibrium
of zero economic returns. There do not exist above-normal returns of any firm.
Bain-type IO and Competitive Forces Approach
The scholars in Bain-type IO regarded that the firm maximizes profits through
exercises of monopoly power or by colluding with other firms. Thus, much attention in this school has been paid to test the “structure-conduct-performance” paradigm (Bain, 1954; Chandler, 1962). In this paradigm, industry structure (e.g., degree of concentration, barriers to entry, product differentiation, vertical integration) determines firm conduct (e.g., pricing, advertising), which in turn determines performance (e.g., profitability, efficiency)(Tirole, 1988). Several empirical studies, thereafter, particularly gave attention to the relationship between firm size, market share, industry concentration and firm profits (e.g., Hall & Weiss, 1967; Gale, 1972; Shepherd, 1972). It’s worth to note that , unlike the perfect competition view, the Bain-type IO supports the existence of persistent above-normal returns. Owing to heterogeneity in firm size (Mann, 1966), entry barrier (Shepherd, 1972) or market share (Gale, 1972), A few dominant firms may obtain higher rate of returns in the long run.
Another paradigm emphasizing the exploitation of market power is competitive forces approach. Pioneered by Portor (1980), this approach points out that the industry
structure strongly influences the competitive strategies available to firms and profitability of firms. In the competitive forces model, five industry-level forces— entry barriers, threat of substitution, bargaining power of buyers, bargaining power of suppliers, and rivalry within industry incumbents— determine the inherent profit potential of an industry. Some industries become more “attractive” because they create structure impediments to competition and thus, can obtain monopoly rents. From the view of competitive forces approach, rents are created largely at the industry level rather than the firm level. It is the industry structure attributes (e.g., entry barriers) or the scale of firms that allow firms better opportunities for creating sustainable competitive advantages (Teece, Pisano & Shuen, 1997).
6
This stream of strategy research placed little emphasis on the impact of idiosyncratic firm attributes on a firm’s competitive position. These models basically assume that, first, firms within an industry are identical in terms of strategic resources they control and the strategies they pursue (Portor, 1984; Rumelt, 1984); Second, the heterogeneity developed in an industry will be short lived because the resources that firm used to implement their strategies are highly mobile (Barney, 1986).
Resource- Based Theory
In the resource-based view, the firm seeks unique, costly-to-copy inputs to generate
above-normal returns. Unlike the previous IO theories’ focus on the impact of a firm’s environment on its competitive position, the resource-based theory put more emphasis on the rents accruing to the idiosyncratic firm attributes or possession of scarce firm-specific resources. This model assumes that, first, firms within an industry may be heterogeneous with respect to different bundles of productive or strategic resources they possess; second, these resources may not be perfectly mobile across firms owing to either costly to copy or inelastic in supply, and thus heterogeneous can be long lasting (Penrose, 1959; Barney, 1991; 1997:142).
In the language of traditional strategic analysis, firm resources including all assets, capabilities, firm attributes, knowledge, information, organizational process, etc. are utilized by firms to implement their strategies (Porter, 1981). However, not all resources can help firms to generate above-normal returns. From the resource-based view, the persistence of rents largely depends on the features of the resources themselves. As Barney (1991) pointed out, a firm resource must have the following four attributes to be a sustainable competitive advantage: (1) it must be valuable, in the sense that it exploits opportunities or neutralizes threats in a firm’s environment, (2) it must be rare among a firm’s current and potential competition, (3) it must be imperfectly imitable, no matter owing to the unique historical condition, causal ambiguity or social complexity, (4) there cannot be strategically equivalent substitutes for this resource (Figure 1). In addition, Coyne (1986) and Hall (1992) identified
several capability differentials as the sources of sustainable competitive advantages. They are functional differentials (e.g., knowhow), cultural differentials (e.g., perception of high quality, ability to learn), positional differentials (e.g., reputation, location) and regulatory differentials (e.g., patents, contracts).
Figure 1 attributes to be a sustainable competitive advantage (Barney, 1991)
Dynamic Capabilities
Recent studies pointed out that the rapid environment change accruing to complex technological developments have altered the nature of competitive battles, particularly in technology intensive industries such as semiconductors, information services, telecommunications, computers, and even in industries in which the technology is intensively used, such as airlines, banks and electric utilities. This kind of new competitive landscape is characterized by (1) increasing risk or uncertainty and
decreasing forecastability, (2) ambiguity of industrial boundaries (Bettis & Hitt, 1995). Previously dominant firms may lost their industry leadership if they cannot successfully sustain and disruptive technological innovations when technology-driven environment changes the nature of current competitive advantages (Christensen & Bower, 1996; Clemons, 1997). Thus, in the environment of hypercompetition— an
environment in which advantages are rapidly created and eroded, D’Aveni and Gunther (1994) argued, the goal of a company is to disrupt, not to sustain advantages. Followed Schumpeter’s concept of “creative destruction” (1950: ch.7, 8), the hypercompetition
approach set the strategic goal for firms to disrupt the industry to create new advantages and erode those of competitors. By creating a series of these disruptions,
Firm resource heterogeneity Firm resource immobility Value Rareness Imperfect imitability Substituability Sustained competitive advantage
8
companies can keep one step ahead of their competitors, moving from one temporary advantage to the next. Similar to this rationale, Day (1997) argued that the creation and maintenance of advantages is a dynamic cycle. In this dynamic cycle, the firm has to put impediments to protect current advantages (barriers to imitation), and
continuously keep investing in new assets and capabilities (resources renewal).
Hence, in the fast moving environment, the strategy that just accumulates valuable assets is often not enough to support a significant competitive advantage. Winners in the modern marketplace need to demonstrate timely responsiveness and rapid and flexible product innovation, coupled with the management capability to efficiently coordinate and redeploy internal and external competencies. Thus, Teece, Pisano & Shuen (1997), drawling from the evolution concept proposed by Nelson and Winter (1982), referred to this ability as “dynamic capability”— the firm’s ability to integrate,
build and reconfigure internal and external competence to address rapidly changing environment. The new competitive advantage of firms lies with its organizational and managerial processes, shaped by its specific asset position, and the path available to it
(Figure 2). The key point of this approach, also the most significant difference from resource-based view, is that entrepreneurial activity cannot lead to immediate replication of unique organizational skills through simply entering a market and piecing the parts together overnight. Furthermore, the behavior and performance of particular firms may be quite hard to replicate, even if its coherence and rationality are observable.
Figure 2 dynamic capabilities paradigm (Teece, Pisano & Shuen, 1997) organizational and managerial processes
specific asset position
Pathdependence
Dynamic capabilities
Theoretical Development and Hypotheses
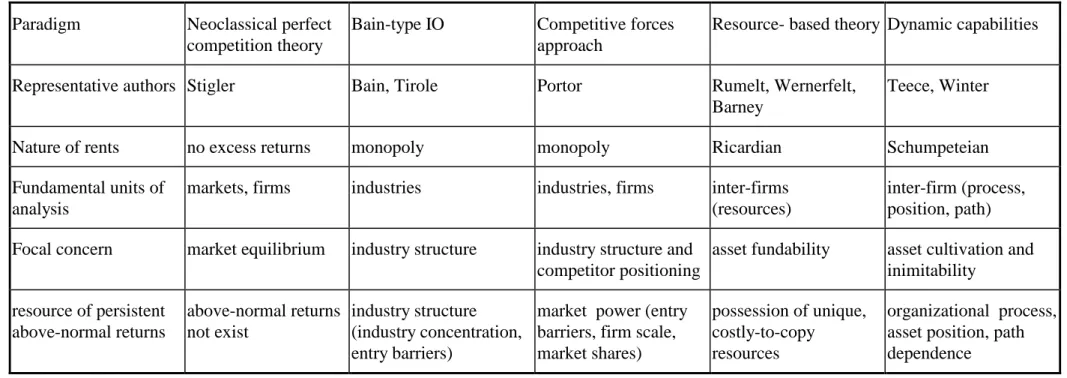
Table 1 shows the comparison of different paradigms in explaining sources of persistent above-normal returns. Except the neoclassical perfect competition theory, the other models, although with different rationales, support the existence of persistent above-normal returns. We also believe in the heterogeneity of firms as sources of persistent superior returns, and thus establish the first hypothesis:
H1: Ther e exists sustainability of super ior r etur ns of the fir st half leading fir ms.
Using a more industrial level analysis, Bain-type IO and the competitive forces model regards the industry structure and market power as the most important resources of abnormal returns of dominant firms. From this point of view, we construct firm’s market share, size and industrial concentration as proxy variables of industry-level isolating mechanisms of leading firms.
By contrast, the resource-based theory and dynamic capabilities paradigm represent an more inter-firm view to identify what characteristics of valuable resources accruing to the heterogeneity of firms are, and to see how competencies are built, accumulated, and integrated. Firms not only used the isolating mechanisms to protect current advantages from imitation, but also renewed their capabilities in order to sustain competitive advantages for gaining abnormal returns. Literature in these theories did revealed rich attributes of various kinds of strategic assets or organizational capabilities that could be sustainable competitive advantages. However, it is difficult to measure the inter-firm level isolating mechanisms (e.g., impediments to imitation, first-mover advantages) or the organizational renewal process. We can only, from the inter-firm view, identify the ratios of firm’s capital expenditure and increasing investments as proxies of resources renewal. Thus, we establish the second hypothesis:
H2: The industr y-level isolating mechanisms identified fr om industr ial str uctur e and mar ket power , and the r enewal investments dr awn fr om r esour ce-based view ar e positively r elated to the sustainability of leading fir m’s super ior r etur ns.
Table 1 Comparison of different approaches in explaining sources of persistent above-normal returns Paradigm Neoclassical perfect
competition theory
Bain-type IO Competitive forces approach
Resource- based theory Dynamic capabilities
Representative authors Stigler Bain, Tirole Portor Rumelt, Wernerfelt,
Barney
Teece, Winter
Nature of rents no excess returns monopoly monopoly Ricardian Schumpeteian
Fundamental units of analysis
markets, firms industries industries, firms inter-firms (resources)
inter-firm (process, position, path) Focal concern market equilibrium industry structure industry structure and
competitor positioning
asset fundability asset cultivation and inimitability resource of persistent above-normal returns above-normal returns not exist industry structure (industry concentration, entry barriers)
market power (entry barriers, firm scale, market shares)
possession of unique, costly-to-copy
resources
organizational process, asset position, path dependence
the more variance of business performance. Schmalaensee (1985) used the 1975 data from the Line of Business Program of the U.S. Federal Trade Commission (FTC) to estimate the variance components of profit rates. He found that: (1) firm effects did not exist, (2) market share effects accounted for a negligible fraction of the variance in business unit rates of return, (3) industry effects were important and accounted for at least 75% of the variance in industry returns, and 20% of the variance in business unit returns. By contrast, Rumelt (1991) also used 4 years FTC LB data, but distinguished between stable and fluctuating effects. He showed small stable industry effects and very large stable business-unit effects. This suggests the importance of firm-specific factors rather than industry factors. Jocobson (1988), Hansen and Wernerfelt (1989) made the similar findings.
These empirical studies revealed industry or firm effects on business unit returns, but they didn’t identify what are the contents of each effect. Owing to recent studies’ emphasis on rapid environment changes altering the nature of competition, we construct two variables, industrial sales fluctuation and market demand growth rate, as the contents of industry factors. Our purpose is to explore how the industrial environment change effects directly or interactively with firm-level factors to influence the sustainability of superior returns among the first half leading firms. Here we establish the last hypothesis:
H3: The industr ial envir onment factor s, fir m-level factor s or cr oss effects of both significantly influence the fir m’s sustainability of super ior r etur ns.
Methods
Data
The business-level data is obtained from COMPUSTAT database. The sample used in
this paper consists of 645 American manufacturing business in 58 industry sectors. Sample firms are selected by following criteria: (1) the business’s annual sales volume exceeds 1 million U.S. dollars, (2) the business contains complete 6 years (1991-1996)
12
profit data, (3) the number of the business of its 4 digit industry exceeds 10. (4) the firm’s 6-year average ROS is in the first half position of its industry. Each sample business unit is classified into its 4-digit industry by the SIC code of its major product. The industry-level data, in which CR4 is gathered from 1992 Census of Manufactures
published by U.S. Census Bureau, and industrial shipments from 1991-1995 Annual Survey of Manufactures published by U.S. Department of Commerce.
Research Models
In previous research, sustainable competitive advantages are defined as valuable to, inimitable by, and can help firms to outperform competitors. Thus, we regard relative superior performance within its 4 digit industry as possession of competitive advantages. Furthermore, a firm is said to have sustainable competitive advantages when it can sustaining the first position relative to competitors in the same industry for a period of time. The dependent variable (SUS) is constructed as the business-unit’s persistence of the relative superior returns on sales (RROS),
SUSi = - (Σ ( 1- RROSit )2 )1/2
, for any business i, t=1-6,
where RROSit=ROSit / max ROSit within its 4-digit industry for any i at time t, and SUSi2 has a chi-squared probability distribution when ROS is assumed to be a normal
distribution. We can use chi-square test to examine if the business i can sustain its top performance over time, thus, hypothesis 1 is equivalent to,
H1: Ther e exists sustainable competitive advantages of fir m i, ifχ2 (SUS i2) < χ2
(0.05, 5) =1.1454 .
Using the general regression model, the second hypothesis can be expressed as,
(Equation 1) SUSi = αi+βkΧ+ei ,where Χ are industry-level isolating mechanisms and firm-level resources renewal variables.
H2: ifβk is significantly differ ent to 0 using t-statistics, the var iable Xk is
significantly r elated to the sustainability of competitive advantages.
directly or interactively with firm-level factors on influencing the sustainability of superior returns of the first half leading firms. We verify the following two equations: (Equation 2) SUSi = αi +βkΧ + γjΖ +ei ,where the industrial environment factorsΖas dependent variables (direct effect).
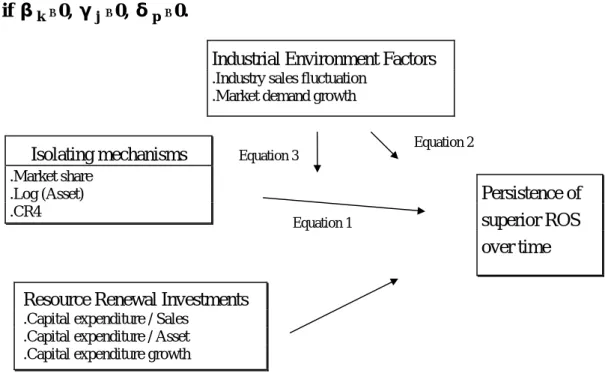
(Equation 3) SUSi = αi+βkΧ +δpΧΖ +ei ,where the industrial environment factorsΖas mediator variables (interactive effect). Figure 3 presents the conceptual framework of this research.
H3: the fir m-level effects, industr ial effects, and cr oss effects ar e significant if βk≠0, γj≠0, δp≠0.
Figure 3 conceptual framework of this research.
Measurements
The measurements of each variable are presented in Table 2.
Results
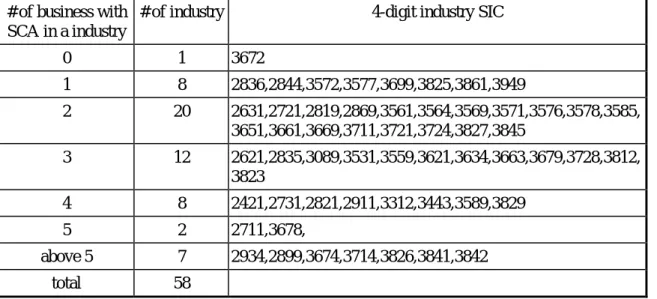
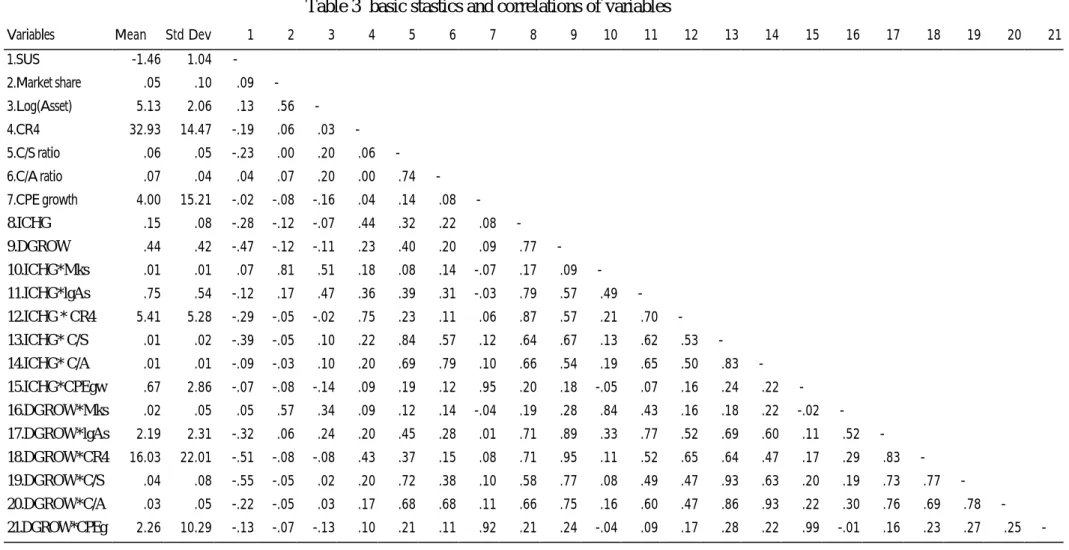
Table 3 presents the basic statistics and correlations of variables. Table 4 shows the result of chi-square test of hypothesis 1. There are at least one firm in almost all industries can sustain its ROS performance at the first position over six years
(1991-Isolating mechanisms .Market share
.Log (Asset) .CR4
Industrial Environment Factors .Industry sales fluctuation
.Market demand growth
Persistence of superior ROS over time Equation 2 Equation 3 Equation 1
Resource Renewal Investments .Capital expenditure / Sales
.Capital expenditure / Asset .Capital expenditure growth
14
96), except the printed circuit boards industry (3672). Moreover, the top leading firms in paperboard mills (2631), periodical publishing (2721), biological product except diagnostic (2836), chemical preparations, n.e.c. (2899), computer peripheral equipment (3576), service industry machinery (3589), radio receivers, television set, phonographs and speakers (3651), interments to measure electricity (3825), measuring and controlling devices (3829), and photographic equipment and suppliers (3861) maintain the highest ROS for 6 years (average RROS equal to 1).
Table 2 Variable constructs and measurements Variables Measurement
Industr y-level isolating mechanisms
Market share business sale/ average total industrial shipments Log (Asset) log (business asset)
CR4 1992 industry concentration
Fir m-level r esour ces r enewal
Capital expenditure / Sales (C/S ratio)
business-level capital expenditure/ sale Capital expenditure / Asset
(C/A ratio)
business-level capital expenditure/ asset
Capital expenditure growth growth rate of capital expenditure from 91 to 96
Industr ial Envir onment Factor s
Industry sales fluctuation std / mean of average industrial shipment of 91-95 Market demand growth growth rate of industrial shipment from 95 to 91
Table 4 the existence of sustainable competitive advantages of leading firms # of business with
SCA in a industry
# of industry 4-digit industry SIC
0 1 3672 1 8 2836,2844,3572,3577,3699,3825,3861,3949 2 20 2631,2721,2819,2869,3561,3564,3569,3571,3576,3578,3585, 3651,3661,3669,3711,3721,3724,3827,3845 3 12 2621,2835,3089,3531,3559,3621,3634,3663,3679,3728,3812, 3823 4 8 2421,2731,2821,2911,3312,3443,3589,3829 5 2 2711,3678, above 5 7 2934,2899,3674,3714,3826,3841,3842 total 58
Table 3 basic stastics and correlations of variables
Variables Mean Std Dev 1 2 3 4 5 6 7 8 9 10 11 12 13 14 15 16 17 18 19 20 21
1.SUS -1.46 1.04 -2.Market share .05 .10 .09 -3.Log(Asset) 5.13 2.06 .13 .56 -4.CR4 32.93 14.47 -.19 .06 .03 -5.C/S ratio .06 .05 -.23 .00 .20 .06 -6.C/A ratio .07 .04 .04 .07 .20 .00 .74 -7.CPE growth 4.00 15.21 -.02 -.08 -.16 .04 .14 .08 -8.ICHG .15 .08 -.28 -.12 -.07 .44 .32 .22 .08 -9.DGROW .44 .42 -.47 -.12 -.11 .23 .40 .20 .09 .77 -10.ICHG*Mks .01 .01 .07 .81 .51 .18 .08 .14 -.07 .17 .09 -11.ICHG*lgAs .75 .54 -.12 .17 .47 .36 .39 .31 -.03 .79 .57 .49 -12.ICHG * CR4 5.41 5.28 -.29 -.05 -.02 .75 .23 .11 .06 .87 .57 .21 .70 -13.ICHG* C/S .01 .02 -.39 -.05 .10 .22 .84 .57 .12 .64 .67 .13 .62 .53 -14.ICHG* C/A .01 .01 -.09 -.03 .10 .20 .69 .79 .10 .66 .54 .19 .65 .50 .83 -15.ICHG*CPEgw .67 2.86 -.07 -.08 -.14 .09 .19 .12 .95 .20 .18 -.05 .07 .16 .24 .22 -16.DGROW*Mks .02 .05 .05 .57 .34 .09 .12 .14 -.04 .19 .28 .84 .43 .16 .18 .22 -.02 -17.DGROW*lgAs 2.19 2.31 -.32 .06 .24 .20 .45 .28 .01 .71 .89 .33 .77 .52 .69 .60 .11 .52 -18.DGROW*CR4 16.03 22.01 -.51 -.08 -.08 .43 .37 .15 .08 .71 .95 .11 .52 .65 .64 .47 .17 .29 .83 -19.DGROW*C/S .04 .08 -.55 -.05 .02 .20 .72 .38 .10 .58 .77 .08 .49 .47 .93 .63 .20 .19 .73 .77 -20.DGROW*C/A .03 .05 -.22 -.05 .03 .17 .68 .68 .11 .66 .75 .16 .60 .47 .86 .93 .22 .30 .76 .69 .78 -21.DGROW*CPEg 2.26 10.29 -.13 -.07 -.13 .10 .21 .11 .92 .21 .24 -.04 .09 .17 .28 .22 .99 -.01 .16 .23 .27 .25
-16
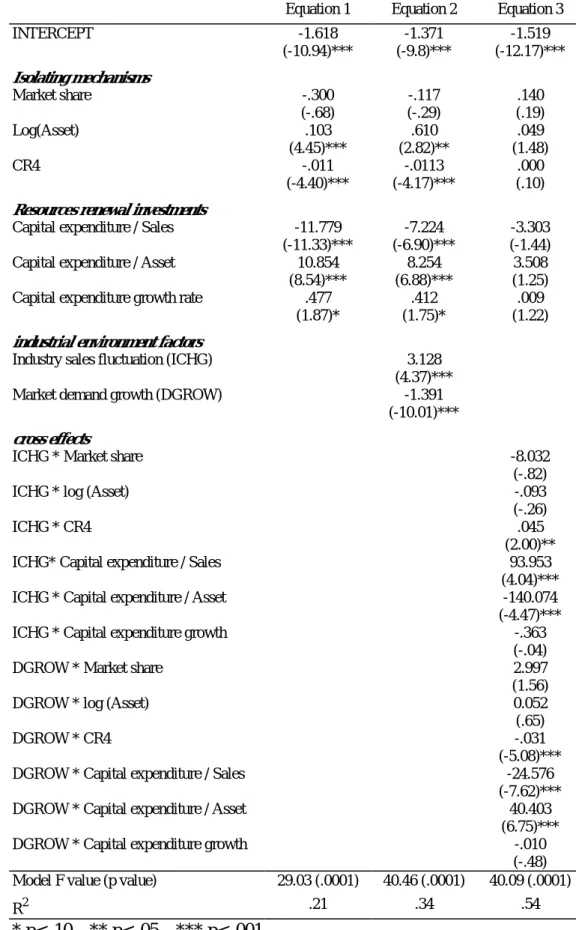
As to hypothesis 2, Equation 1 in Table 5 presents the result. Most of the industry-level isolating mechanisms and firm-industry-level resources renewal variables are significantly related to the persistence of superior performance of the first half business. The firm size plays positive role in isolating imitation and, hence, sustaining competitive advantages. The negative parameter of (CR4) indicates that higher industry concentration degree will enlarge the distances of other business’ performance position to the top leading firm’s in the industry. In addition, The higher the ratio of capital expenditure to sales, or the growth of capital expenditure, will be helpful for sustaining higher ROS. It is to say that capital expenditure may be a good proxy of firm-level resources renewal investments.
Equation 2 and 3 illustrate the results of hypothesis 3. Adding two industrial environment factors increases the value of R2 from .21 in Equation 1 to .34 in Equation 2. That means industrial effects can contribute to the explanation of persistent superior performance of business. The positive estimate of industry sales fluctuation variable indicates that leading firms have better ability to handle the fluctuating market demand situation, and then sustain higher ROS. By contrast, the top firms may lost their leading position when the market demand grows rapidly.
Equation 3 presents rich implications of interactive effects of industry and firm level factors. When the industry sales are fluctuating, the higher industry concentration will shorten the distances between the top leading firm and others. In addition, the C/S ratio enhancement can be a right way to renew resources for persistent rents in changing environment. However, there’s opposite result when the market demand is growing rapidly. To increase C/A ratio is a right decision to sustain competitive advantages.
Conclusion
This paper furthers previous theoretical development to empirical test on the existence and determinants of sustainable competitive advantages. By using 6-year American manufacturing business data, this research presents the following findings,
1. there exist persistent superior returns of leading firms in 57 (of 58) industries;
2. the industry-level isolating mechanisms accruing to industry structure and market power, and firm-level resources renewal variables drawn from resource-based view and dynamic capabilities paradigm, have significant impact on sustainability the competitive advantages of business;
3. the industrial environment factors significantly influence the sustainability of advantages, not only through direct effects, but also via interactive effects with firm level factors. In addition, market demand fluctuation and growth have different impacts on the persistence of superior performance of business units.
18
Table 5 determinants of sustainability of competitive advantages Equation 1 Equation 2 Equation 3
INTERCEPT -1.618 (-10.94)*** -1.371 (-9.8)*** -1.519 (-12.17)*** Isolating mechanisms Market share -.300 (-.68) -.117 (-.29) .140 (.19) Log(Asset) .103 (4.45)*** .610 (2.82)** .049 (1.48) CR4 -.011 (-4.40)*** -.0113 (-4.17)*** .000 (.10) Resources renewal investments
Capital expenditure / Sales -11.779 (-11.33)***
-7.224 (-6.90)***
-3.303 (-1.44) Capital expenditure / Asset 10.854
(8.54)***
8.254 (6.88)***
3.508 (1.25) Capital expenditure growth rate .477
(1.87)*
.412 (1.75)*
.009 (1.22) industrial environment factors
Industry sales fluctuation (ICHG) 3.128 (4.37)***
Market demand growth (DGROW) -1.391
(-10.01)*** cross effects
ICHG * Market share -8.032
(-.82)
ICHG * log (Asset) -.093
(-.26)
ICHG * CR4 .045
(2.00)**
ICHG* Capital expenditure / Sales 93.953
(4.04)***
ICHG * Capital expenditure / Asset -140.074
(-4.47)***
ICHG * Capital expenditure growth -.363
(-.04)
DGROW * Market share 2.997
(1.56)
DGROW * log (Asset) 0.052
(.65)
DGROW * CR4 -.031
(-5.08)***
DGROW * Capital expenditure / Sales -24.576
(-7.62)***
DGROW * Capital expenditure / Asset 40.403
(6.75)***
DGROW * Capital expenditure growth -.010
(-.48) Model F value (p value) 29.03 (.0001) 40.46 (.0001) 40.09 (.0001)
R2 .21 .34 .54
Reference
Bain, J.S., 1954, ‘Economies of Scale, Concentration, and the Condition of Entry in Twenty Manufacturing Industries’, American Economic Review, 44: 15-39.
Barney, J., 1986, ‘Strtegic Factor Markets: Expectations, Luck, and Business Strategy’, Management Science, 42: 1231-1241.
Barney, J., 1991, ‘Firm Resources and Sustained Competitive Advantage’, Journal of Management, 17(1): 99-120.
Barney, J., 1997, Gainning and Sustaining Competitive Advantage, MA: Addison-Wesley.
Bittis, R.A. & Hitt, M.A., 1995, ‘The New Competitive Landscape’, Strategic Management Journal, 16: 7-19.
Chandler, A.D., Jr. 1962, Strategy and Structure, Cambridge: Harvard U. Press.
Christensen, C.M., & Bower, J.L., 1996, ‘Customer Power, Strategic Investment, and the Failure of Leading Firms’, Strategic Management Journal, 17: 197-218.
Clemons, E.K., 1997, ‘Thchnology-Driven Environment Shifts and the Sustainable Competitive Disadvantage of Previously Dominant Companies’, in Day, G.S., Reibstein, D.J., and Gunther, R.E., (eds.) Wharton on Dynamic Competitive Strategy, pp. 99-121.
Conner, K.R., 1991, ‘A Historical Comparison of Resource-Based Theory and Five Schools of Thought within Industrial Organization Economics: Do We Have a New Theory of the Firm?’, Journal of Management, 17(1): 121-154.
Coyne, K.P., 1986, ‘SCA— What it is and what it isn’t’, Business Horizons, 1: 54-61. D’Aveni, R.A., and Gunther, R., 1994, Hypercompetition : Managing the Dynamics
of Strategic Maneuvering, NY: the Free Press.
Day, G.S., 1997, ‘Maintaining the Competitive Edge: Creating and Sustaining Advantages in Dynamic Competitive Environments’, in Day, G.S., Reibstein, D.J., and Gunther, R.E., (eds.) Wharton on Dynamic Competitive Strategy, pp. 48-75. Gale, B.T., 1972, ‘Market Share and Rate of Return’, Review of Economics and
Statistics, 54: 412-423.
Hall, M. & Weiss, L., 1967, ‘Firm Size and Profitability’, Review of Economics and Statistics, 49: 319-331.
Hall, R., 1992, ‘The Strategic Analysis of Intangible Resources’, Strategic Management Journal, 13: 135-144.
Hansen, G.S., and Wernerfelt, B., 1989, ‘Determinants of Firm Performance: the Relative Importance of Economic and Organizational Factors’, Strategic
20 Management Journal, 10:399-411.
Jocobson, R., 1988, ‘The Persistence of Abnormal Returns’, Strategic Management Journal, 9: 415-430.
Nelson, R. and Winter, S., 1982, An Evolutionary Theory of Economic Change, MA: Harvar University Press.
Penrose, E.T., 1959, The Theory of the Growth of the Firm, NY: Wiley. Porter, M., 1980, Competitive Strategy, NY: Free Press.
Porter, M., 1981, ‘The Contributions of Industrial Organization to Strategic Management’, Acdemy of Management Review, 6: 609-620.
Rumelt, R.P., 1991, ‘How Much Does Industry Matter?’, Strategic Management Journal, 12: 167-185.
Schmalaensee, R., 1985, ‘Do Markets Differ Much?’, American Economic Review, 75: 341-351.
Schumpeter, J.A., 1950, Capitalism, Socialism and Democracy, 3rd ed., NY: Haper & Row.
Singer, E.M., 1981, Antitrust Economics and Legal Analysis. Columbus: Grid Publishing.
Stigler, G.J., 1957, ‘Perfect Competition, Historical Contemplated’, Journal of Political Economy, 65: 1-17.
Teece, D.J., Pisano, G. & Shuen, A., 1997, ‘ Dynamic Capabilities and Strtegic Management’, Strategic Management Journal, 18(7): 509-533.
Tirole, J., 1988, The Theory of Industrial Organization, Cambrige: MIT Press.
Wernerfelt, B., 1984, ‘A Resource-Based View of the Firm’, Strategic Management Journal, 5: 171-180.