國
立
交
通
大
學
資訊管理研究所
碩
士
論
文
The study of Collaborative Product Commerce Using
Co-citation Analysis and Social Network Analysis
應用引文分析和社會網絡分析方法於協同產品分析
之研究
研 究 生:李漢娜
指導教授:楊 千 教授
The Study of Collaborative Product Commerce Using Co-citation Analysis
and Social Network Analysis
指導教授:楊千
研 究 生:李漢娜
Advisor:Chyan Yang
Student:Joahanna Lee
國 立 交 通 大 學
資 訊 管 理 研 究 所
碩 士 論 文
A ThesisSubmitted to Institute of Information Management College of Management
National Chiao Tung University in Partial Fulfillment of the Requirements
for the Degree of Master of Science
in
Information Management June 2007
The Study of Collaborative Product Commerce Using Co-citation Analysis
and Social Network Analysis
Student: Joahanna Lee Advisor: Dr. Chyan Yang
Institute of Information Management
National Chiao Tung University
ABSTRACT
This paper presents the analysis of Collaborative Product Commerce documents associated by using co-citation analysis and social network analysis. Co-citation is a new form of document coupling the frequency with which two documents are cited together. In this paper we report an experiment by using data from Google scholar search and Social Science Citation Index to identify clusters of highly interactive documents in the subject of Collaborative Product Commerce. They may provide a new approach to indexing and to the creation easier search CPC area.
The study discovers five core papers which imply the four documents provide insight into the theory’s evolution and clarifies future research work in CPC field. The trend in the field focuses on organizational layer, included knowledge management, system problem solution, and collaborative mechanism design. The conclusion can provide future research direction for the researcher in this field.
ACKNOWLEDGMENT
I would like to express my sincere appreciation to my advisor, Dr. Chyan Yang for his valuable guidance and patience during the two years period in Chiao-Tung University. Thank you to oral examination committeeman, professor Chen-Hua Fu, Li-Fen Liao, and Duen-Ren Liu for their important propounds suggestion. In addition, I am very thankful to my faculty members, Szu-Hui Wu, Andes Young and Chien-Liang Chen for their discussions, suggestions and help at all times.
Finally, I want to deeply appreciate my family. They are the most important support behind me. Their love and encouragement with them were very constructive for me to accomplish this work.
Joahanna Lee June, 2007 at NCTU
Contents
ABSTRACT ...iii ACKNOWLEDGMENT ...iv Contents ... v List of Table...vi List of Figures...vii I. Introduction ... 1II. Literature review... 3
2.1 Collaborative Product Commerce ...3
2.2 Co-citation Analysis ...8
2.3 Social Network Analysis ...10
III. Proposed Method... 12
3.1 Objective... 12
3.2 Overview of documents Co-Citation analysis and Social Network analysis ... 12
3.3 Co-citation method ... 14
IV. Experimental Results ... 16
4.1 Data Collection ... 18
4.1.1 Selection of Documents... 18
4.1.2 Retrieval of Co-citation Data... 18
4.1.3 Central Core...19
4.2 Data Analysis (Co-citation Analysis) ... 22
4.2.1 Matrix ... 22
4.2.2 Factors ... 25
4.3 Results and discussion ... 25
V. Conclusion... 37
References ... 39
List of Table
Table 1 CPC Finals Articles Citation Frequency... 20
Table 2 Co-citation Matrix ... 24
Table 3 Factor analysis Results ...26
List of Figures
Figure 1 Tradition v.s Collaborative Commerce. ... 4
Figure 2 Business Application Evolution... 6
Figure 3 Collaborative Commerce for Coordination...7
Figure 4 Bibliographic Coupling vs. Co-Citation ...9
Figure 5 Social Network... 11
Figure 6 Documents Analysis Steps ...13
Figure 7 Flowchart for Co-Citation analysis ...17
Figure 8 The Core Documents and their Interrelationships ...32
Figure 9 The Core documents and their factor analyses ... 33
Figure 10 Social network analyses for CPC documents...34
I. Introduction
Both bibliographic citations and co-citation in comprehensive papers have been used by a variety of researchers to establish relationships among documents. In this paper we report an experiment by using data from Google scholar search (google scholar search) and Social Science Citation Index (SSCI) to identify clusters of highly interactive documents in the subject of Collaborative Product Commerce (CPC). Unlike bibliographic coupling, which links source documents, co-citation links cited documents which are an acceptable indicator for the different information sources used.
The purpose of this paper is to define the coupling of CPC document references cited in the research works. The analysis of the references can be used to study the research fronts (Price DJ de Solla, 1965) and explore its relationship to other citation measures for identifying
relationships by using an actual example from the CPC documents. The more the two
documents are cited together, the closer the relationship between them, as perceived by the citing subjects, and the closer they would appear in the graphic rendering of groups of documents (White, Griffith, 1981).
Since this research study uses the co-citations or joint citations and social network analysis method that are based on frequently cited ulterior research works and individual network centralities, it is possible to infer that there must be some link between (Small H., 1974) CPC documents. By understanding analysis, researchers’ processes and its outcomes help reveal the vitality and the evolution because it gives a sense of its future. In new field such as CPC, this understanding identifies the commitments that will serve as the foundation of the field as it matures.
This new approach, Collaborative product commerce (CPC), develops and services a product over its entire lifecycle. It is defined by the Aberdeen Group as a way to provide cross business process for each product to reduce time to market, get better quality and lower costs. CPC satisfies inter-enterprise and interdepartmental information sharing requirements that are involved in the supply-chain relationship, such as sellers, buyers, intermediaries and deliverers. It helps the company become tight and strong. In fact sharing the same database and application with other parties provides lower costs.
The present article uses the subject of CPC as the unit of sets documents associated with the Topical of 39 information papers. By statistical techniques these links between sets of subjects or documents allow the discovery of the most closed linked for CPC documents. Our co-citation analysis and social network analysis identifies the research fronts and the interconnections by the main CPC journals in this field.
II. Literature review
2.1 Collaborative Product Commerce
According to the Aberdeen Group proposal, the definition of CPC is an integrated suite of software and services; these software and services provide cross business process for each product, to become a singular, closed loop resolution schema (Aberdeen Group, 1999). The objective is to satisfy inter-enterprise and interdepartmental information sharing requirements, in order to reduce disparity between design, prototype, and monitor process. By making the entire design-chain process work more effectively, manufacturers can better capture innovation, reduce time to market, get better quality, and do it all faster and at lower costs (James Heppelmann, 2000).
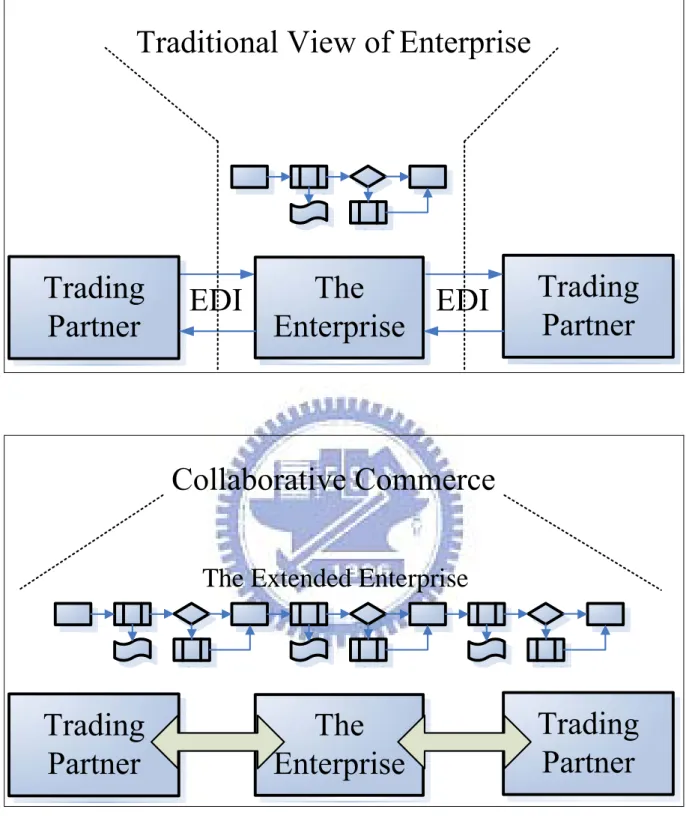
Collaborative product commerce (CPC) is a relatively new approach to develop and service a product over its entire lifecycle. Some industry experts believe that CPC has the potential to dramatically compress the time it takes to field new product and reduce life-cycle costs of everything from aircraft to spacecraft (Theodore Farris II M, Wittmann Michael C, Hasty R., 2005). In recent years, CPC has received attention in Taiwan, China (Taiwan) as many industries tried to gain competitive advantage based on superior product design (Wu WH, Ho CF, 2005). The relationship sometimes further extends into a supply-chain relationship. Several entities are involved in the supply-chain relationship, such as sellers, buyers, intermediaries and deliverers. See Figure 1.
The Extended Enterprise
Figure 1 Tradition v.s Collaborative Commerce. Source: Collaborative commerce, 2005
integration of e-commerce, knowledge management and collaboration technologies (Thuraisingham B, Gupta A, Bertino E, Ferrari E, 2002). The definition of c-commerce is the integrated explanations of multiple business associations, the concept that reflects the transaction in computers (Li X, Fan H, 2005).
Collaborative commerce (C-commerce) enables collaboration beyond traditional, predefined trading partners to innovative ways of solving business problems, by capturing complementary competencies in meeting customer demands in an efficient and flexible manner (Peterson k, Cecere L, 2001). Collaborative commerce is more than a transaction exchange: it is an intellectual-capital exchange (Carol M, 2001). To realize Collaborative commerce, organizations need to implement collaborative (electronic) business platforms and strategies. As relationships form, their collaborative nature should be built into the governance structures used to organize those relationships, without jeopardizing the strategic flexibility that is characteristic of c-commerce nets (Peterson RR, 2002).
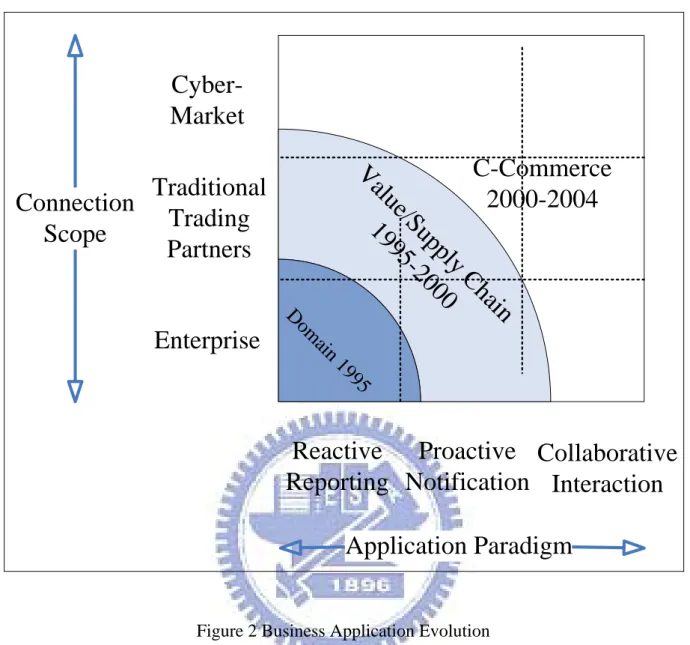
CPC has the potential to put entire supply networks at an advantage over competing supply networks (Theodore Farris II M, Wittmann Michael C, Hasty R, 2005). According to Gartner Group, the application system of enterprises will be designed into c-commerce stage in coordination and will replace inflexible Web-based Supply Chain system in 2004 (Wu SH, 2004). See Figure 2.
V
al
ue/Sup
ply
C
hain
19
95
-2
00
0
D
omain 1
995
C-Commerce
2000-2004
Connection
Scope
Cyber-Market
Traditional
Trading
Partners
Enterprise
Reactive
Reporting
Proactive
Notification
Collaborative
Interaction
Application Paradigm
Figure 2 Business Application Evolution Source : Wu SH, 2004
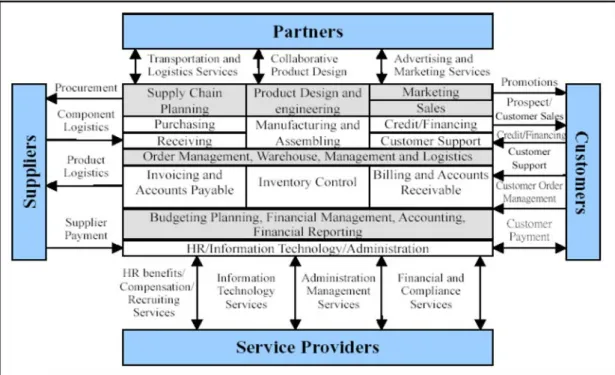
No matter what happens between interdepartmental or enterprise of companies, the coordination of commercial affairs such as Product design, making, sale, logistics, …etc. are all considered as the Collaborative commerce (Wu SH, 2004). See Figure 3.
Figure 3 Collaborative Commerce for Coordination Source : Wu SH, 2004
At the Highest level of Collaborative Commerce, a company is tightly integrating its databases and computer applications with those of suppliers, customers and/or business partners – or in fact is sharing the same database and application with those outside parties (A NerveWire, Inc., 2002). The main objective of this relationship is to share information with partners. Many collaborative models can be adopted in the collaborative commerce by sharing through intranet, extranet, and workflow. The present paper analyzes the theory’s heterogeneity by using co-citation and social network to identify the CPC and approaches developed within it.
2.2 Co-citation Analysis
Author co-citation analysis (ACA) began at Drexel University in 1979. It moved the unit of analysis from co-cited documents to co-cited oeuvres-that is, to groups of documents by the same authors, as opposed to individual publications. ACA maps suggest the frequencies of author connections within a literature-information that may be useful for purposes of summarization or retrieval. The raw data, author co-citation counts, were gathered from Institute for Scientific Information (ISI) databases on the Dialog system. The work of the first decade was summed up in White; a companion piece, McCain, codified the methods (White HD, 2003). The strength of co-citation between two cited papers or books can be easily determined from a citation index much as the Science Citation index (SCI)(Small H, 1974). During the past 20 years, several mapmaking techniques have been tried in ACA (White HD, 2003)
ACA is one particular type of co-citation analysis. It is generally accepted that the co-citation concept was discovered independently by Small and Marshakova, and that document co-citation analysis was introduced by small and author co-citation analysis by White and Griffith. In co-citation analysis, a set of items is selected to represent a research area. Relationships between these items are then analyzed using co-citation counts as similarity measures and multivariate analysis techniques as analyzing tools in order to study the intellectual structure of this research field and to infer some of the characteristics of the corresponding scientific community. In general, two items are considered as being co-citation when they appear together in the same reference list of a subsequent article (Zhao D, 2006).
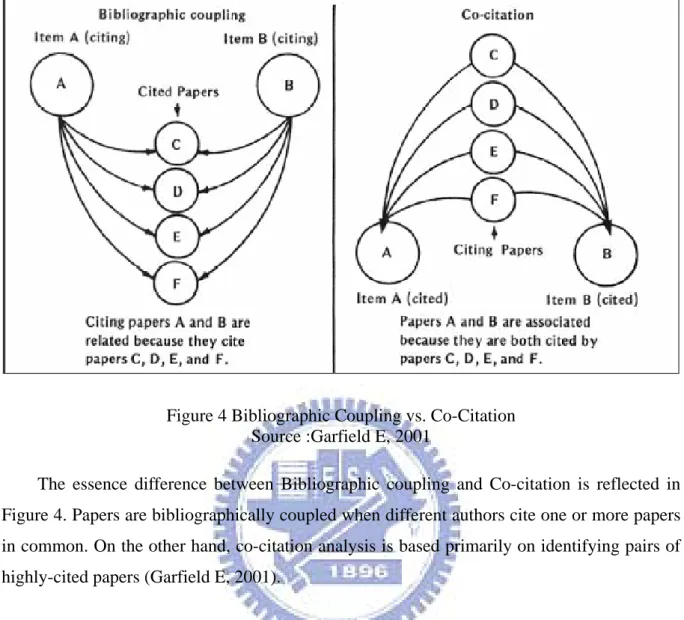
Bibliographic Co-citation is a popular similarity measure used to establish a subject similarity between two items. If A and B are both cited by C, they may be said to be related to one another, even though they don’t directly reference each other. If A and B are both cited by many other items, they have a stronger relationship. The more items they are cited by, the stronger their relationship is (Martins B. Class Co-citation).
Figure 4 Bibliographic Coupling vs. Co-Citation Source :Garfield E, 2001
The essence difference between Bibliographic coupling and Co-citation is reflected in Figure 4. Papers are bibliographically coupled when different authors cite one or more papers in common. On the other hand, co-citation analysis is based primarily on identifying pairs of highly-cited papers (Garfield E, 2001).
The notion of citation is fundamental to both the scholarly enterprise and to hypertext networks where it provides the primary mechanism for connection and traversal of the information space. Citation analysis was developed in information science as a tool to identify core sets of articles, authors, or journals of particular fields of study (Larson RR, 1996). The study analyzed subject of CPC in Google search and ISC to discovery the most closed linked for the CPC documents.
2.3 Social Network Analysis
A social network is a collection of people, each of whom is acquainted with some subset of the others. Such a network can be represented as a set of points (or vertices) denoting people, joined in pairs by lines (or edges) denoting acquaintance (M.E.J. Newman., 2001). Social network analysis is the mapping and measuring of relationships and flows between people, groups, organizations, animals, computers or other information/knowledge processing entities. The nodes in the network are the people and groups while the links show relationships or flows between the nodes (Orgnet.com). It usually provides both a visual and a mathematical analysis of human relationships.
Social networks have been the subject of both empirical and theoretical study in the social sciences for at least 150 years. Stanley Milgram conducted a famous early empirical study of the structure of social networks (M.E.J. Newman., 2001). Social network researchers measure network activity for a node by using the concept of degrees the number of direct connections a node has. The relationship between the centralities of all nodes can reveal much about the overall network structure (Orgnet.com).
Network analysis is distinguished from traditional social science by the dyadic nature of the standard data set (Borgatti S.P., Everett M.G., 1997). Martin argues that while predicting the specific content of ideas is often not possible, we can link the shape of an idea space to the
structure of a network(Moody J., 2004).
Social network analysis is the study of social relationships between individuals in a society. Obviously, the more relational data the better the network analysis is (Sabater J., Sierra C., 2002). The theory emphasizes patterns of relationships among individuals and interprets the behavior of individuals in reference to their positions within social networks. A primary task of social network analysis is to use the interactional patterns among individuals to identify clusters or cliques within a network of individuals (Ennett S.T., Bauman K.E.,
III. Proposed Method
3.1 Objective
By using co-citation analysis and social network analysis to discovery the most closed linked for CPC documents to identify the CPC documents relationship and future research techniques.
3.2 Overview of documents Co-Citation
analysis and Social Network analysis
Documents co-citation analysis consists of the assembling and interpretation of bibliographical statistics taken from the cited references which are taken from the selected citing articles. See Figure 6.
Scholar
SSCI
Databases (CPC Documents for Co-citation)
Selection of documents and
Finalizing the documents set
Co-citation Matrix
Input Data
Preparation
Factor Analysis
Output
Preparation
Social Network
Analysis
Input Data
Preparation
UCINE
T 6.0
RESULT
SPSS
3.3 Co-citation method
Much work has been done developing the theory and methodology of document co-citation analysis, firmly establishing it as a bibliometric research tool, realizing that new improvements on this methodology keep on coming out (Acedo FJ, Barroso C, Galan JL, 2006).
The co-citation method, which is based on a count of the number of times two documents are cited jointly in the CPC subject area. Their analysis has produced a diversity of methodologies. In which the co-citation or joint citations method is significantly relevant. This method aims to identify groups of documents who are closely related and which, consequently, can be affirmed as belonging to the same research front (price,1965),upon the premise that the more often two documents are cited together, the closer the relationship between them.
The structure of the database is derived from all the full papers published in the Google scholar search. Most electronic copies of these papers were gathered from the Google scholar search and the rest of papers were retrieved from Social Science Citation Index (SSCI), which is offered through the ISI web science system.
Traditionally, researchers in information studies field rely on some statistical tools, such as SPSS which supports cluster analysis, factor analysis, to perform co-citation analysis (He Y, Hui SC, 2001). To do this, we first need to get the document co-citation raw matrix by using software tools.
To construct the matrices, the most frequently cited documents must first be identified. Therefore a minimum number of citations received per document must be chosen; documents receiving fewer citations do not appear in the databases. The documents should be chosen in such a way that the resulting matrix contains as few zeroes as possible (White HD, 1983).
consist of :
1. Selection of the core set of documents for the study.
2. Retrieval of co-citation frequency information for the core set. 3. Compilation of the raw co-citation frequency matrix.
4. Correlation analysis to convert the raw frequencies into correlation coefficients.(SPSS)
IV. Experimental Results
The starting point for multivariate analysis is the co-citation matrix, which represents the intensity of co-citation between any two documents. The more often two documents are cited together, the closer together the documents they research appear in the scientific community that cites them. Construction of the matrix is thus a key step in co-citation studies.
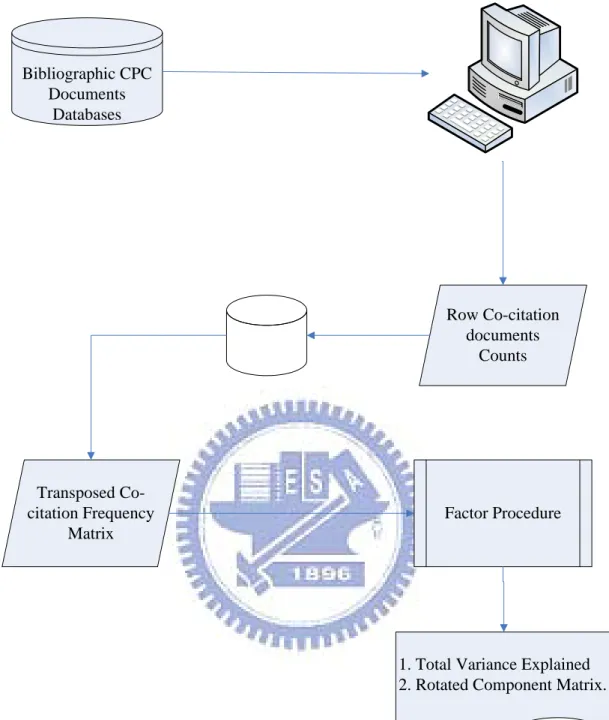
CPC data analysis requires the seven different procedures such as data collection, Row Co-citation documents Counts, Transposed Co-citation Frequency matrix, and Factor Procedure. See Figure 7.
Row Co-citation documents Counts Transposed Co-citation Frequency Matrix Factor Procedure
1. Total Variance Explained 2. Rotated Component Matrix. Bibliographic CPC
Documents Databases
4.1 Data Collection
We selected those who where most frequently cited and those who were most frequently co-cited in the 52 documents of citable items. Co-citation counts can be either retrieved from commercial online bibliographical databases such as Science Citation Index, and Social Sciences Citation Index, or generated from Google scholar search databases. The selection of those source documents that make up the core data of a theory or discipline is a critical stage in the process. It computes document co-citation frequencies between any pair of topics under study. To cover all the developments within the theory, the objective is to form a core as large as possible, while ensuring that this core is made up only of documents that can be truly considered as shaping the theory. By using the relevance criterion favors older documents to detriment of more recent ones that might have had a greater impact on the theory.
4.1.1 Selection of Documents
In this study, selection of the core set documents was derived from a set of initial searches. There are no hard and fast rules, but the subjectivity inherence in the selection of CPC documents should be limited on their significant contributions to the field. A list of 39 papers was determined after examining initial citation data retrieved from ISI files and Google scholar search. The 39 source articles produced a total of 6041 citations (documents selection period before May 2007).
4.1.2 Retrieval of Co-citation Data
Basic citation counts on CPC documents were collected form the Google scholar search and ISI databases. Searches using the keyword/subject was conducted to determine which
4.1.3 Central Core
The core documents allow a delimitation of the area under study on the basis that a scientific paper can be included when it cites one or more such source documents (Acedo F.J., Barroso C., Galan J.L., 2006). It seems likely that many of the documents we shall read about define the cognitive or intellectual structure of CPC and the CPC area’s specialties. The most widely used criterion is the number of cites, and so we take the most significant works representing the study field to be the core documents during the factor analyzed.
The core documents represent assemblies’ documents that share CPC subject, theory, or common methodology and describe current investigation. We often cite the same documents that have the same collective representation of their investigating activity; consequently, the higher the co-citation is among them, the more coherent and integrated is the scientific community determined by the method.
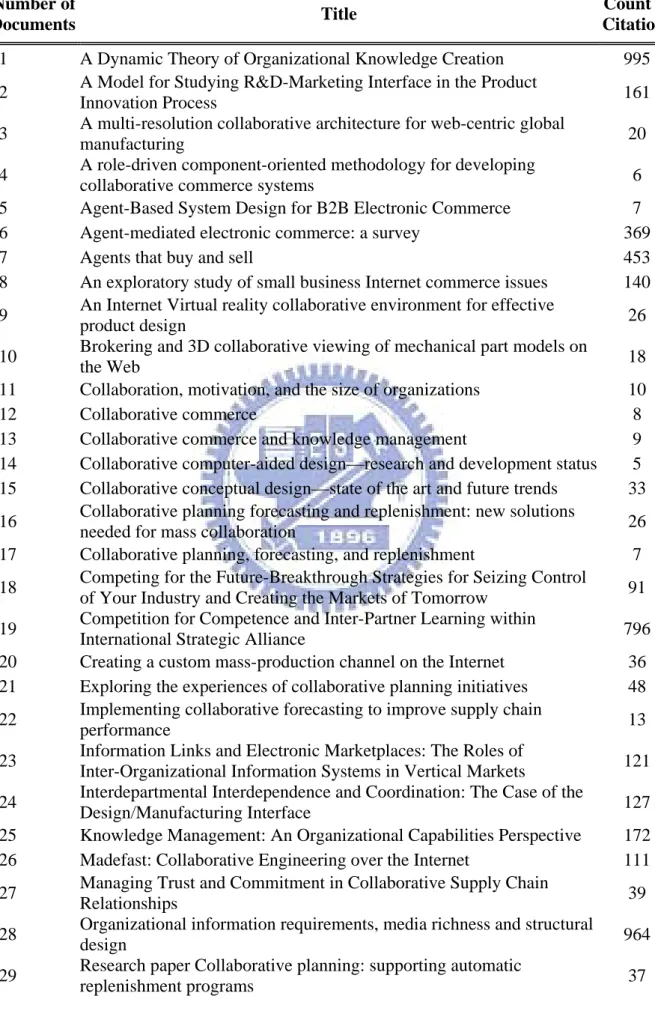
The resulting list of CPC documents is show in Table 1. The Title means the title of the paper, the number of Count of Citation means how many papers have cited it and the Number of Documents is just the variable name for future analyses. Each complete document list is shown in the appendix.
Table 1 CPC Finals Articles Citation Frequency
Number of
Documents Title
Count of Citations
v1 A Dynamic Theory of Organizational Knowledge Creation 995
v2 A Model for Studying R&D-Marketing Interface in the Product
Innovation Process 161
v3 A multi-resolution collaborative architecture for web-centric global
manufacturing 20
v4 A role-driven component-oriented methodology for developing
collaborative commerce systems 6
v5 Agent-Based System Design for B2B Electronic Commerce 7
v6 Agent-mediated electronic commerce: a survey 369
v7 Agents that buy and sell 453
v8 An exploratory study of small business Internet commerce issues 140
v9 An Internet Virtual reality collaborative environment for effective
product design 26
v10 Brokering and 3D collaborative viewing of mechanical part models on
the Web 18
v11 Collaboration, motivation, and the size of organizations 10
v12 Collaborative commerce 8
v13 Collaborative commerce and knowledge management 9
v14 Collaborative computer-aided design—research and development status 5
v15 Collaborative conceptual design—state of the art and future trends 33
v16 Collaborative planning forecasting and replenishment: new solutions
needed for mass collaboration 26
v17 Collaborative planning, forecasting, and replenishment 7
v18 Competing for the Future-Breakthrough Strategies for Seizing Control
of Your Industry and Creating the Markets of Tomorrow 91
v19 Competition for Competence and Inter-Partner Learning within
International Strategic Alliance 796
v20 Creating a custom mass-production channel on the Internet 36
v21 Exploring the experiences of collaborative planning initiatives 48
v22 Implementing collaborative forecasting to improve supply chain
performance 13
v23 Information Links and Electronic Marketplaces: The Roles of
Inter-Organizational Information Systems in Vertical Markets 121
v24 Interdepartmental Interdependence and Coordination: The Case of the
Design/Manufacturing Interface 127
v25 Knowledge Management: An Organizational Capabilities Perspective 172
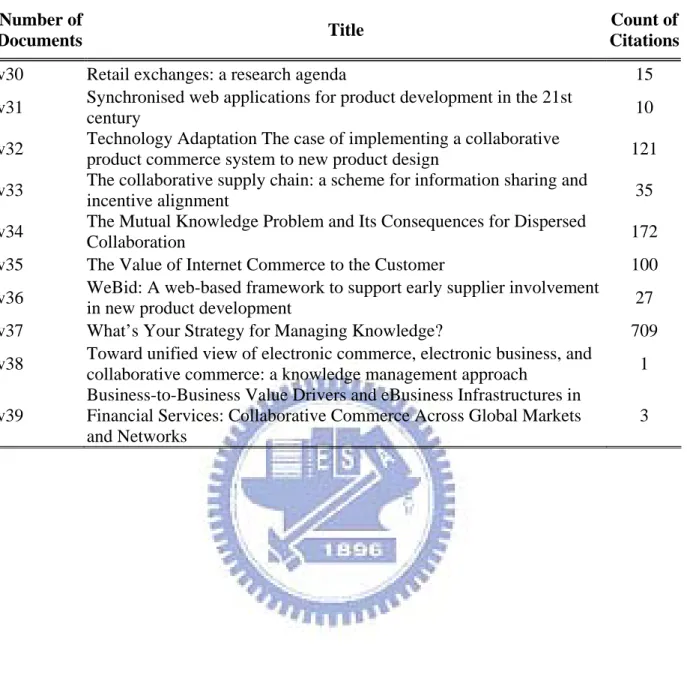
Table 2 CPC Finals Articles Citation Frequency (cont.)
Number of
Documents Title
Count of Citations
v30 Retail exchanges: a research agenda 15
v31 Synchronised web applications for product development in the 21st
century 10
v32 Technology Adaptation The case of implementing a collaborative
product commerce system to new product design 121
v33 The collaborative supply chain: a scheme for information sharing and
incentive alignment 35
v34 The Mutual Knowledge Problem and Its Consequences for Dispersed
Collaboration 172
v35 The Value of Internet Commerce to the Customer 100
v36 WeBid: A web-based framework to support early supplier involvement
in new product development 27
v37 What’s Your Strategy for Managing Knowledge? 709
v38 Toward unified view of electronic commerce, electronic business, and
collaborative commerce: a knowledge management approach 1
v39
Business-to-Business Value Drivers and eBusiness Infrastructures in Financial Services: Collaborative Commerce Across Global Markets and Networks
4.2 Data Analysis (Co-citation Analysis)
The set of cited authors chosen for analysis is determined by citation frequency. Co-citation analysis can be applied to different levels of aggregation: on the level of single publications, it can be use to study relationships among specific conceptual ideas or empirical findings (Small, 1974).
ACA shows how authors are positioned relatively to each other in the research field. In our case, Table 1 gives the frequencies with which a particular individual document has been cited. Co-citation are counts of the frequency with which two existing documents are cited together in a new document and their analysis enables us to say something about the way ideas support and interact with each other and also to plot the structure of intellectual disciplines (Small, 1973; White and Griffith, 1981).
All of the citations were imported into a Microsoft Office Excel and subsequently into a Microsoft Access database for additional processing. The co-citation counts for each documents pair were derived using ODBC (Open Database Connectivity) and small program searched the citation field of each bibliographic record, counting the number of times two documents were cited together. We address such issues by performing various analyses on the co-citation matrix. The result was the basis of all future analyses used in this project.
4.2.1 Matrix
We perform two first-document and two inclusive all-document co-citation analyses based on the two dataset and two different approaches to matrix generation. The one pair of first-document and inclusive all-document co-citation analyses commences from an n x n matrix. The other pair of first-document and inclusive all-document co-citation analyses commences from an n x m data matrix, which corresponds to conventional multivariate data
approximate the next highest score in the distribution, thus indicating in a general way the relative importance of a particular (White HD, Griffith BC, 1981) documents within the field.
A matrix shown in Table 2 was constructed with recorded document titles. This was then subjected to a factor analysis to extract latent structures from the pattern of documents citations. The names of each factor were given by the documents after investigating the titles themselves. The raw co-citation matrix was entered into the SPSS system for the future analyses. It was first converted to a correlation matrix.
Table 3 Co-citation Matrix v1 v2 v3 v4 v5 v6 v7 v8 v9 v10 v11 v12 v13 v14 v15 v16 v17 v18 v19 v20 v21 v22 v23 v24 v25 v26 v27 v28 v29 v30 v31 v32 v33 v34 v35 v36 v37 v38 v39 v1 84 0 0 0 0 1 1 0 0 0 0 0 0 0 0 0 0 0 65 0 0 0 0 1 20 0 0 22 0 0 0 3 0 2 0 0 80 0 0 v2 0 14 0 0 0 2 2 3 0 0 0 1 0 0 0 0 0 2 7 2 0 0 2 10 0 0 2 10 0 0 0 0 0 2 1 0 8 0 0 v3 0 0 2 0 0 0 0 0 2 1 0 0 0 0 0 0 0 0 0 0 0 0 0 0 0 1 0 0 0 0 1 0 0 0 0 0 0 0 0 v4 0 0 0 2 0 0 0 0 0 0 0 0 2 0 0 0 0 0 0 0 0 0 0 0 0 0 1 0 0 0 0 0 0 0 0 0 0 1 0 v5 0 0 0 0 2 0 3 0 0 0 0 0 0 0 0 0 0 0 0 0 0 0 0 0 0 0 1 0 0 0 0 0 0 0 0 0 0 0 0 v6 1 2 0 0 0 35 64 1 0 0 0 1 0 0 0 0 0 0 2 0 0 0 1 1 0 0 0 0 0 0 0 0 0 1 2 0 3 0 0 v7 1 2 0 0 3 64 36 3 0 0 0 1 0 0 0 0 0 0 1 2 0 0 3 1 1 1 1 0 0 0 0 0 0 1 5 0 3 0 0 v8 0 3 0 0 0 1 3 5 0 0 0 0 0 0 0 0 0 1 1 2 0 0 3 1 0 0 1 2 0 0 0 0 0 0 1 0 3 0 0 v9 0 0 2 0 0 0 0 0 4 3 0 0 0 1 2 0 0 0 0 0 0 0 0 0 0 2 0 0 0 0 2 0 0 0 0 1 0 0 0 v10 0 0 1 0 0 0 0 0 3 4 0 0 0 0 0 0 0 0 0 0 0 0 0 0 0 3 0 0 0 0 1 1 0 0 0 1 0 0 0 v11 0 0 0 0 0 0 0 0 0 0 3 0 0 0 0 0 0 0 0 0 0 0 0 0 2 0 0 1 0 0 0 2 0 2 0 0 0 0 0 v12 0 1 0 0 0 1 1 0 0 0 0 4 0 0 0 0 0 0 1 0 0 0 0 1 0 0 0 0 0 0 0 0 0 5 1 0 2 0 0 v13 0 0 0 2 0 0 0 0 0 0 0 0 2 0 0 0 0 0 0 0 0 0 0 0 0 0 0 0 0 0 0 0 0 0 0 0 0 1 1 v14 0 0 0 0 0 0 0 0 1 0 0 0 0 2 1 0 0 0 0 0 0 0 0 0 0 1 0 0 0 0 0 0 0 0 0 1 0 0 0 v15 0 0 0 0 0 0 0 0 2 0 0 0 0 1 3 0 0 0 0 0 0 0 0 0 0 2 0 0 0 0 0 0 0 0 0 1 0 0 0 v16 0 0 0 0 0 0 0 0 0 0 0 0 0 0 0 9 1 0 0 0 11 1 0 0 0 0 0 0 4 3 0 0 1 0 0 0 0 0 0 v17 0 0 0 0 0 0 0 0 0 0 0 0 0 0 0 1 2 0 0 0 1 0 0 0 0 0 0 0 1 0 0 0 1 0 0 0 0 0 0 v18 0 2 0 0 0 0 0 1 0 0 0 0 0 0 0 0 0 6 5 1 0 0 1 3 0 0 1 3 0 0 0 0 0 0 0 0 4 0 0 v19 65 7 0 0 0 2 1 1 0 0 0 1 0 0 0 0 0 5 48 1 0 0 1 4 4 0 1 13 2 0 0 1 1 3 1 0 18 0 0 v20 0 2 0 0 0 0 2 2 0 0 0 0 0 0 0 0 0 1 1 3 0 0 2 1 0 0 1 1 0 0 0 0 0 0 0 0 1 0 0 v21 0 0 0 0 0 0 0 0 0 0 0 0 0 0 0 11 1 0 0 0 14 7 2 0 0 0 0 1 10 5 0 0 6 0 0 1 0 0 0 v22 0 0 0 0 0 0 0 0 0 0 0 0 0 0 0 1 0 0 0 0 7 7 0 0 0 0 0 0 3 0 0 0 3 0 0 0 0 0 0 v23 0 2 0 0 0 1 3 3 0 0 0 0 0 0 0 0 0 1 1 2 2 0 5 2 0 0 3 3 1 0 0 0 0 0 4 0 2 0 0 v24 1 10 0 0 0 1 1 1 0 0 0 1 0 0 0 0 0 3 4 1 0 0 2 16 1 2 2 18 0 0 0 0 1 1 1 0 2 0 0 v25 20 0 0 0 0 0 1 0 0 0 2 0 0 0 0 0 0 0 4 0 0 0 0 1 31 0 0 6 1 0 0 4 0 4 0 0 35 0 0 v26 0 0 1 0 0 0 1 0 2 3 0 0 0 1 2 0 0 0 0 0 0 0 0 2 0 4 0 1 0 0 2 0 0 0 1 3 0 0 0 v27 0 2 0 1 1 0 1 1 0 0 0 0 0 0 0 0 0 1 1 1 0 0 3 2 0 0 4 3 0 0 0 0 1 0 0 0 1 0 0 v28 22 10 0 0 0 0 0 2 0 0 1 0 0 0 0 0 0 3 13 1 1 0 3 18 6 1 3 29 0 0 0 16 0 17 2 0 18 0 0 v29 0 0 0 0 0 0 0 0 0 0 0 0 0 0 0 4 1 0 2 0 10 3 1 0 1 0 0 0 9 2 0 0 4 0 0 0 1 0 0 v30 0 0 0 0 0 0 0 0 0 0 0 0 0 0 0 3 0 0 0 0 5 0 0 0 0 0 0 0 2 5 0 0 0 0 0 0 0 0 0 v31 0 0 1 0 0 0 0 0 2 1 0 0 0 0 0 0 0 0 0 0 0 0 0 0 0 2 0 0 0 0 3 0 0 0 0 2 0 0 0 v32 3 0 0 0 0 0 0 0 0 1 2 0 0 0 0 0 0 0 1 0 0 0 0 0 4 0 0 16 0 0 0 22 0 24 0 0 2 0 0 v33 0 0 0 0 0 0 0 0 0 0 0 0 0 0 0 1 1 0 1 0 6 3 0 1 0 0 1 0 4 0 0 0 7 0 0 0 1 0 0 v34 2 2 0 0 0 1 1 0 0 0 2 5 0 0 0 0 0 0 3 0 0 0 0 1 4 0 0 17 0 0 0 24 0 26 1 0 10 0 0 v35 0 1 0 0 0 2 5 1 0 0 0 1 0 0 0 0 0 0 1 0 0 0 4 1 0 1 0 2 0 0 0 0 0 1 6 0 0 0 0 v36 0 0 0 0 0 0 0 0 1 1 0 0 0 1 1 0 0 0 0 0 1 0 0 0 0 3 0 0 0 0 2 0 0 0 0 3 0 0 0 v37 80 8 0 0 0 3 3 3 0 0 0 2 0 0 0 0 0 4 18 1 0 0 2 2 35 0 1 18 1 0 0 2 1 10 0 0 67 0 0 v38 0 0 0 1 0 0 0 0 0 0 0 0 1 0 0 0 0 0 0 0 0 0 0 0 0 0 0 0 0 0 0 0 0 0 0 0 0 1 0 v39 0 0 0 0 0 0 0 0 0 0 0 0 1 0 0 0 0 0 0 0 0 0 0 0 0 0 0 0 0 0 0 0 0 0 0 0 0 0 1
4.2.2 Factors
Factor analysis must be regarded as a natural development in a field in which large sets of correlated variates arise, as a means of examining and describing the internal structure of the covariance and correlation matrices concerned. (D.N. Lawley and A.E. Maxwell, 1962). It has an underlying theoretical model it also seeks to study correlations among a number of interrelated variables and to group them into a few highly descriptive factors.
In this case, documents can contribute to more than one factor and usually load most heavily on a single factor, with documents loadings of 0.7 or greater as likely to be the most useful for interpretation. SPSS is commonly done to determine the number of factors with the most explanatory power. Rotation is also commonly used to interpret results, with varimax rotation being the most popular in ACA.
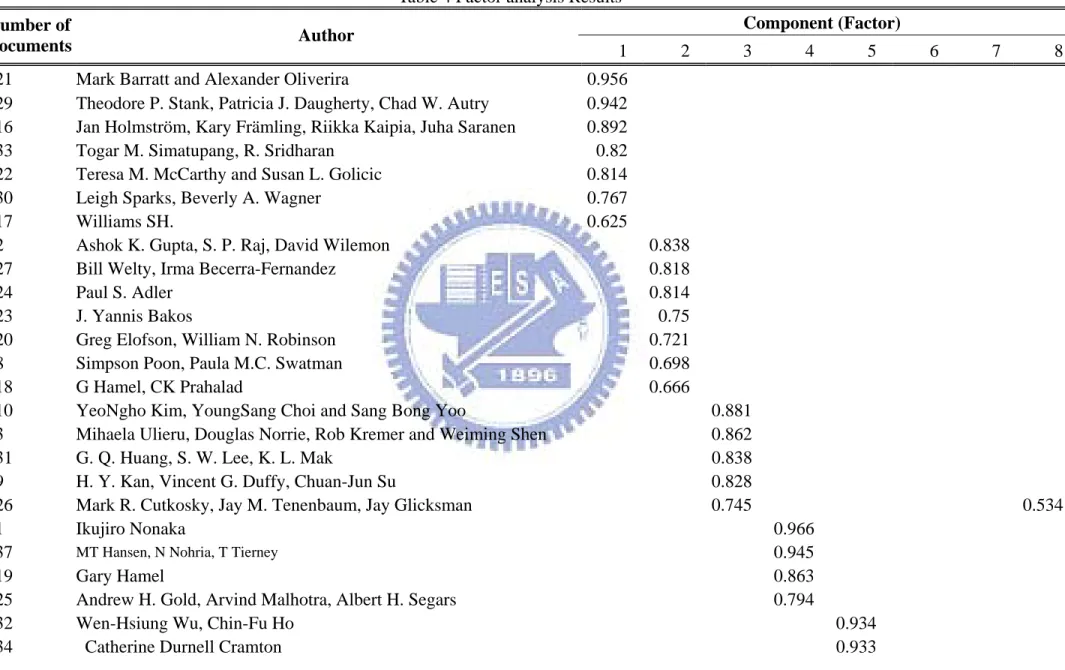
4.3 Results and discussion
Eight factors were extracted from the data and together they explain 100% of the variance in the co-citation matrix. The results of the factor analysis are summarized in Table 3 which shows the factor loadings for the documents in the first 8 factors.
Table 4 Factor analysis Results
Component (Factor) Number of
Documents Author 1 2 3 4 5 6 7 8
v21 Mark Barratt and Alexander Oliverira 0.956
v29 Theodore P. Stank, Patricia J. Daugherty, Chad W. Autry 0.942 v16 Jan Holmström, Kary Främling, Riikka Kaipia, Juha Saranen 0.892 v33 Togar M. Simatupang, R. Sridharan 0.82
v22 Teresa M. McCarthy and Susan L. Golicic 0.814 v30 Leigh Sparks, Beverly A. Wagner 0.767
v17 Williams SH. 0.625 v2 Ashok K. Gupta, S. P. Raj, David Wilemon 0.838
v27 Bill Welty, Irma Becerra-Fernandez 0.818
v24 Paul S. Adler 0.814 v23 J. Yannis Bakos 0.75 v20 Greg Elofson, William N. Robinson 0.721
v8 Simpson Poon, Paula M.C. Swatman 0.698 v18 G Hamel, CK Prahalad 0.666
v10 YeoNgho Kim, YoungSang Choi and Sang Bong Yoo 0.881
v3 Mihaela Ulieru, Douglas Norrie, Rob Kremer and Weiming Shen 0.862 v31 G. Q. Huang, S. W. Lee, K. L. Mak 0.838
v9 H. Y. Kan, Vincent G. Duffy, Chuan-Jun Su 0.828
Table 5 Factor analysis Results (cont.)
Component (Factor) Number of
Documents Author 1 2 3 4 5 6 7 8 v11 Bernardo A. Huberman, Christoph H. Loch 0.698
v28 Richard L. Daft, Robert H. Lengel 0.486 0.571 0.598
v12 Scott Kownslar 0.554 v13 Bhavani Thuraisingham , Amar Gupta , Elisa Bertino , Elena Ferrari 0.949
v4 Hwagyoo Park, Woojong Suh, Heeseok Lee 0.907 v38 Clyde W. Holsapple and Meenu Singh 0.907 v39 Alea M. Fairchild, Ryan R. Peterson 0.595
v6 Robert H. Guttman, Alexandros G. Moukas and Pattie Maes 0.942 v7 Pattie Maes, Robert H. Guttman and Alexandros G. Moukas 0.827 v35 Ralph L. Keeney 0.685 v5 Anthony Karageorgos, Simon Thompson, Nikolay Mehandjiev 0.672 v14 W.D. Li, W.F. Lu, J.Y.H. Fuh, Y.S. Wong 0.847 v15 Lihui Wang, Weiming Shen, Helen Xie, Joseph Neelamkavil, Ajit
Pardasani 0.79 v36 G. Q. Huang and K. L. Mak 0.598 0.622
We have labeled all 39 documents and ranked them, loading most heavily on each, 0.4 being an arbitrary minimum cutoff point. If a documents does not load 0.4 or higher on any of the factors, the document’s highest loading, whatever it may be, is presented. As is usual in this type of analysis, documents with less than a 0.4 loading were dropped from the final results (J.Hair, R.Anderson, R.Tatham and W.Black, 1998).
We tentatively assigned the documents with high associated loadings. Implicitly, our interpretation of the analysis results is that the CPC field is composed of at least eight different sub fields: Supply Chain partners and CPFR, Organizational Model design and Coordination mechanism, Web Collaborative design Model, Organization Knowledge and Management Knowledge, System and Solve CPC problems, c-commerce combines e-commerce, Design for e-commerce, and CAD system. See Table 4. All 39 papers load on at least one factor, V26 load on two and V28 on three, as shown by subscripts to their documents numbers. The 8 factors help in understanding relationships, such as that between businesses and IS strategies.
Table 6 Documents factor loadings at 0.40 or higher (decimals omitted).a
Factor 1
Supply Chain partners, CPFR Factor
Loading
v21 Exploring the experiences of collaborative planning initiatives 0.96
v29 Research paper Collaborative planning: supporting automatic
replenishment programs 0.94
v16 Collaborative planning forecasting and replenishment: new solutions
needed for mass collaboration 0.89
v33 The collaborative supply chain: a scheme for information sharing and
incentive alignment 0.82
v22 Implementing collaborative forecasting to improve supply chain
performance 0.81
v30 Retail exchanges: a research agenda 0.77
v17 Collaborative planning, forecasting, and replenishment 0.63
Factor 2
Organizational Model design, Coordination mechanism Factor
Loading
v2 A Model for Studying R&D-Marketing Interface in the Product
Innovation Process 0.84
v27 Managing Trust and Commitment in Collaborative Supply Chain
Relationships 0.82
v24 Interdepartmental Interdependence and Coordination: The Case of the
Design/Manufacturing Interface 0.81
v23 Information Links and Electronic Marketplaces: The Roles of
Inter-Organizational Information Systems in Vertical Markets 0.75
v20 Creating a custom mass-production channel on the Internet 0.72
v8 An exploratory study of small business Internet commerce issues 0.70
v18 Competing for the Future-Breakthrough Strategies for Seizing
Control of Your Industry and Creating the Markets of Tomorrow 0.67
v28 3
Organizational information requirements, media richness and
structural design 0.49
Factor 3
Web Collaborative design Model Factor
Loading
v10 Brokering and 3D collaborative viewing of mechanical part models
Table 7 Documents factor loadings at 0.40 or higher (decimals omitted).a (cont.)
Factor 4
Organization Knowledge, Management Knowledge Factor
Loading
v1 A Dynamic Theory of Organizational Knowledge Creation 0.97
v37 What’s Your Strategy for Managing Knowledge? 0.95
v19 Competition for Competence and Inter-Partner Learning within
International Strategic Alliance 0.86
v25 Knowledge Management: An Organizational Capabilities Perspective 0.79
v28 2
Organizational information requirements, media richness and
structural design 0.57
Factor 5
System, Solve CPC problems Factor
Loading
v32 Technology Adaptation The case of implementing a collaborative
product commerce system to new product design 0.93
v34 The Mutual Knowledge Problem and Its Consequences for Dispersed
Collaboration 0.93
v11 Collaboration, motivation, and the size of organizations 0.70
v28 1
Organizational information requirements, media richness and
structural design 0.60
v12 Collaborative commerce 0.55
Factor 6
c-commerce combines e-commerce Factor
Loading
v13 Collaborative commerce and knowledge management 0.95
v4 A role-driven component-oriented methodology for developing
collaborative commerce systems 0.91
v38 toward unified view of electronic commerce, electronic business, and
collaborative commerce: a knowledge management approach 0.91
v39
Business-to-Business Value Drivers and eBusiness Infrastructures in Financial Services: Collaborative Commerce Across Global Markets and Networks
0.60
Factor 7
Design for e-commerce Factor
Loading
v6 Agent-mediated electronic commerce: a survey 0.94
v7 Agents that buy and sell 0.83
v35 The Value of Internet Commerce to the Customer 0.69
Table 8 Documents factor loadings at 0.40 or higher (decimals omitted).a (cont.)
Factor 8
CAD, System Factor
Loading
v14 Collaborative computer-aided design—research and development
status 0.85
v15 Collaborative conceptual design—state of the art and future trends 0.79
v36 WeBid: A web-based framework to support early supplier
involvement in new product development 0.62
v26 2 Madefast: Collaborative Engineering over the Internet 0.53
a
Subscripts: 1 = first appearance, 2 = second appearance, 3 = third appearance.
Figure 8 is a graph of the visualization of the semantic space derived from 39 core papers. The sphere and line each represent there relationship between two core papers. The colors of these spheres indicate the “co-citation number in co-citation matrix (from table 2)” of corresponding documents: the first-document and two inclusive all-document co-citation analyses based on the two dataset, we count once when the first document and n document have same co-citation document, no matter how many co-citation appear. For example, From Table 2 showed V5 have connection with V7 and V27 that we count as two lines, it will connect V5 with V7 and V5 with V27 as we can see from Figure 8.
The purple colors represent the core documents have same co-citation document from paper number one to five, black represent six to ten, yellow represent eleven to sixteen, and red represent seventeen to nineteen.
21 20 19 10 9 8 11 37 36 35 34 31 30 29 39 38 18 28 27 5 17 4 33 16 3 26 15 14 25 2 24 13 23 32 22 12 1 6 7 1-5 17-19 11-16 6-10
Figure 8 The Core Documents and their Interrelationships
In the subsequent document co-citation analysis and associated co-citation maps, this tendency becomes even stronger and more intuitive. Figure 9 summarizes the intellectual structure within the core. Documents are co-located according to a multidimensional scaling of their interconnectedness in a two-dimensional space. The relative amount of co-citations of documents is indicated by the thickness circle lines and all factors received clear view.
21 20 19 10 9 8 11 37 36 35 34 31 30 29 39 38 18 28 27 5 17 4 33 16 3 26 15 14 25 2 24 13 23 32 22 12 1 6 7 1-5 17-19 11-16 6-10
Figure 9 The Core documents and their factor analyses
The program UCINET 6.0 was investigated in more detail with the help of an example data set. UCINET 6.0 (a social network analysis software package) is a comprehensive program for the analysis of social networks and other proximity data. It is probably the best known and most frequently used software package for the analysis of social network data and contains a large number of network analytic routines (Huisman M., Marijtje A.J. van Duijn., 2003). By applying the UCINET 6.0 program the given 39 CPC documents identified as a core data set, a social network analysis graph emerges in Figure 10.
Figure 10 Social network analyses for CPC documents
Figure 11 summarizes the intellectual structure within the factors. Factors are co-located according to a multidimensional scaling of their interconnectedness in a two-dimensional space. The relative amount of factors is indicated by the thickness circle lines and all other factors received clear view.
Factor 6
Factor 1
Factor 8
Factor 3 Factor include 2, 4, 5 and 7
Figure 11 The social network analyses and their interrelationship
Overall, the graph visualizes the relative positioning of documents within the core. Their location stems from the fact that the graph reflects interrelations with in the core connected to all co-citation documents. The more similar the co-citation documents, the closer they will be displayed in the graph: the documents linked to many other source documents will be located in areas close to the graph’s center (McCain 1986).
As the figure 8 and 9 show, the different cores are grouped together depending upon the documents interrelationship. The eight resulting group represent different theoretical trends within the CPC study field. Core papers number 19, 24, 28, 34 and 37 are the necessarily cited key paper in this field.
analyzing the future research work of CPC, the researcher mostly focuses on Organizational model, Organizational Knowledge, Management Knowledge and System such as factor two, four, five and seven.
The factor one, three, six and eight been labeled as Supply Chain partners, CPFR, Web Collaborative design Model, c-commerce combines e-commerce and CAD System are not very connected with this field although they may connect CPC for some small idea. For the future research factor two, four, five and seven (Organizational Model design, Coordination mechanism, Organization Knowledge, Management Knowledge, System, Solve CPC problems, Design for e-commerce) is the most clarified for the search area.
V. Conclusion
The co-citation and social network study provides CPC field professionals a perspective that heretofore has not been afforded. As such, those can be one of several tools used to help individuals access and visualize scholarly communication within the field. Those helps identify the most productive and prominent document in the field, the documents that are cited, the amount they are co-cited with other informatics documents, and the documents that appear in similar subject areas.
This paper introduced documents co-citation analysis without relying on commercial citation databases, based on custom bibliographic database and co-citation matrix generation systems specifically developed to use the custom database. This study also demonstrates the matrix and their potential problems in factor analysis.
The study combines a content-similarity analysis, a factor analysis, document co-citation analysis, social network analysis, and structural visualization together on the field of hypertext as a whole. The factor analysis extracted 8 factors, which may be the roots of many new specialties to be identified in future work. By combining co-citation analysis and social network analysis, the clearly factors result has been identify.
The most clarified factors are factor two, four, five and seven standing for Organizational Model design, Coordination mechanism, Organization Knowledge, Management Knowledge, System, Solve CPC problems, Design for e-commerce. For factor one, three, six and eight standing for Supply Chain partners, CPFR, Web Collaborative design Model, c-commerce combines e-commerce and CAD System not very clarified for CPC future research.
References
(2002).A NerveWire, Inc. [online] : http://xml.coverpages.org/Nervewire200210.pdf (2005). Collaborative commerce. [online] :
http://boldtech.com/Consulting_Expertise/Capabilities/Supply_Chain/pdf/BoldTechCCS ervices.pdf
Aberdeen Group. (1999). Collaborative Product Commerce : Delivering Product Innovations at Internet Speed. Market Viewpoint.
Acedo F.J., Barroso C., Galan J.L. (2006). The Resource-Based Theory : Dissemination and Main trends. Strategic Management Journal. 27:621-636.
Borgatti S.P., Everett M.G. and Freeman L.C. (2002). Ucinet for Windows: Software for Social
Network Analysis, Harvard, MA: Analytic Technologies.
Borgatti S.P., Everett M.G. (1997). Network analysis of 2-mode data. Social Network, Elsevier.
19(3):243-269.
Carol M. (2001). Collaborative commerce: The next big thing in global manufacturing. EAI
Journal. July, pp.20-24.
Du T.C., Li E.Y., Rau H., Lian G.Y. (2006). Reverse simulation for collaborative commerce: A study of integrating object-oriented database technology with object-oriented simulator.
Int J Flex Manuf Syst. 17 : 227-250.
New York.
He Y., Hui S.C. (2001). Mining a Web Citation Database for author co-citation analysis.
Information Processing and Management. 38: 491-508.
Heppelmann. J. (2000). Collaborative Commerce in the Design Chain. D.H. Brown Associates,
Inc. [online] : http://www.dhbrown .com
Huisman M., Marijtje A.J. van Duijn. (2003). Software for Social Network Analysis.
University of Groningen. [online]
http://stat.gamma.rug.nl/snijders/Software%20for%20Social%20Network%20Analysis% 20CUP_ch13_Oct2003.pdf
Larson R.R. (1996). Bibliometrics of the World Wide Web: An Exploratory Analysis of the intellectual Structure of Cyberspace. [online] :
http://sherlock.sims.berkeley.edu/asis96/asis96.html).ibliographic
Lawley D.N., Maxwell A.E. (1962). Factor Analysis as a Statistical Method. Royal Statistical
Society. pp209.
Li X., Fan H. (2005). Collaborative Commerce Architecture and Process Unit Study. ICEC. 5 : 485-489.
Martins B. Class CoCitation. [online] :
http://webla.sourceforge.net/javadocs/pt/tumba/links/CoCitation.html
Moody J. (2004). The Structure of a Social Science Collaboration Network: Disciplinary Cohesion from 1963 to 1999. American Sociological Review. 69: 213-238.
Newman. M.E.J. (2001). The structure of scientific collaboration networks. PNAS. 98(2): 404-409.
Price D.J. de. Solla. (1965). Networks of scientific papers. Science, 149 : 510-515.
Sabater J., Sierra C. (2002.) Reputation and Social Network Analysis in Multi-Agent Systems.
AAMAS’02. July 475-482.
Small H. (1973). Cocitation in the scientific literature: A new measure of the relationship between two documents. Journal of the American Society for Information Science. 24: 265-269.
Small H, Griffith BC. (1974). The Structure of Scientific Literatures I: Identifying and Graphing Specialties. Science Studies 4:17-40.
Small H. (1974). Co-citation in the Scientific Literature: A New measure of the Relationship Between Two Documents. Essays of an information Scientist. 2 : 28-31.
Theodore F.II M., Wittmann M.C., Hasty R. (2005). Aftermarket support and the supply chain: exemplars and implications from the aerospace industry. International Journal of
Physical Distribution & Logistics Management. 35(1): 6-19.
Thuraisingham B., Gupta A., Bertino E., Ferrari E. (2002). Collaborative Commerce and Knowledge Management. Knowledge and Process Management. 9(1): 43-53.
White H.D., Griffith B.C. (1981). Author Cocitation : A Literature Measure of Intellectual Structure. Journal of the American Society for Information Science. 32:163-172. White HD. (1983). A cocitation map of the social indicators movement. Journal of the
American Society for Information Science. 34(5) : 307-312.
White HD. (2003). Author Cocitation Analysis and Pearson’s r. Journal of the American
Zhang JH. The study of MIS scholar community development through collaboration network structures analysis. The master thesis of NCZX.
Appendix
List of references form the data set
[V1] Ikujiro N. (1994). A Dynamic Theory of Organizational Knowledge Creation.
Organization Science. 5(1) : 14-37.
[V2] Ashok K., Gupta S.P.Raj, David W. (1986).A Model for Studying R&D-Marketing Interface in the Product Innovation Process. Journal of Marketing. 50 (2) : 7-17. [V3] Mihaela U., Douglas N., Rob K., Weiming S. (2000).A multi-resolution collaborative
architecture for web-centric global manufacturing. Information Sciences. 127(1-2) : 3-21. [V4] Park H., Suh W., Lee H. (2004). A role-driven component-oriented methodology for
developing collaborative commerce systems. Information and Software Technology. 46 : 819-837.
[V5] Karageorgos A., Thompson S., Mehandjiev N. (2002). Agent-Based System Design for B2B Electronic Commerce. International Journal of Electronic Commerce. 7(1) : 59-90. [V6] Guttman R.H., Moukas A.G., Maes P. (1998). Agent-mediated electronic commerce: a
survey. The Knowledge Engineering Review. 13 : 147-159.
[V7] Maes P., Guttman R.H., G. Moukas A.G. (1999).Agents that buy and sell.
Communications of the ACM. 42(3) : 81-91.
[V8] Simpson P., Paula M.C.S. (1999). An exploratory study of small business Internet commerce issues. Information & Management. 35 : 9-18.
109-130.
[V12] Kownslar S. (2002).Collaborative commerce. Ubiquity. [online]: http://www.acm.org/ubiquity/views/s_knownslar_1.html
[V13] Thuraisingham B., Gupta A., Bertino E., Ferrari E. (2002).Collaborative commerce and knowledge management. Knowledge and Process Management. 9(1): 45-53.
[V14] Li W.D., Lu W.F., Fuh J.Y.H., Wong Y.S. (2005).Collaborative computer-aided design—research and development status. Computer-Aided Design. 37(9): 931-940. [V15] Wang L., Shen W.g, Xie H., Neelamkavil J., Pardasani A. (2002).Collaborative
conceptual design—state of the art and future trends. Computer-Aided Design. 34 : 981-996.
[V16] Holmström J., Främling K., Kaipia R., Saranen J. (2002).Collaborative planning forecasting and replenishment: new solutions needed for mass collaboration. Supply
Chain Management: An International Journal. 7(3): 136-145.
[V17] Williams SH. (1999).Collaborative planning, forecasting, and replenishment. Hosp
Mater Manage Q. 21(2) : 44-51.
[V18] Hamel G., Prahalad CK. (1994).Competing for the Future-Breakthrough Strategies for Seizing Control of Your Industry and Creating the Markets of Tomorrow. Harvard
Business School Press.
[V19] Hamel G. (1991).Competition for Competence and Inter-Partner Learning within International Strategic Alliance. Strategic Management Journal. Special Issue: Global
Strategy. 12: 83-103.
[V20] Elofson G., Robinson W.N. (1998).Creating a custom mass-production channel on the Internet. Communications of the ACM. 41(3) : 56 – 62.
improve supply chain performance. International Journal of Physical Distrubution &
Logistics Management. 32(6) : 431-454.
[V23] Bakos J.Y. (1991).Information Links and Electronic Marketplaces: The Roles of Inter-Organizational Information Systems in Vertical Markets. Journal of Management
Information Systems. Special section: Strategic and competitive information systems.
8(2): 31-52.
[V24] Adler P.S. (1995).Interdepartmental Interdependence and Coordination: The Case of the Design/Manufacturing Interface. Organization Science. 6(2) : 147-167.
[V25] Gold A.H., Malhotra A., Segars A.H. (2001).Knowledge Management: An
Organizational Capabilities Perspective. Journal of Management Information Systems.
18 (1) : 185-214.
[V26] Cutkosky M.R., Tenenbaum J.M., Glicksman J. ().Madefast: Collaborative Engineering over the Internet. Communications of the ACM. 39(9) : 78-87.
[V27] Welty B., Becerra-Fernandez I. (2001).Managing Trust and Commitment in
Collaborative Supply Chain Relationships. Communications of the ACM. 44(6) : 67-73. [V28] Daft R.L., Lengel R. H. (1986).Organizational information requirements, media
richness and structural design. Management ScienceOrganization Design. 32(5) : 554-571.
[V29] Stank T.P., Daugherty P.J., Autry C.W. (1999).Research paper Collaborative planning: supporting automatic replenishment programs. Supply Chain Management: An
International Journal. 4(2) : 75-85.
[V33] Simatupang T.M., Sridharan R. (2002).The collaborative supply chain: a scheme for information sharing and incentive alignment. International Journal of Logistics
Management. [online] http://www.geocities.com/togarms/Working/collabo rative.pdf
[V34] Cramton C.D. (2001).The Mutual Knowledge Problem and Its Consequences for Dispersed Collaboration. Organization Science. 12 (3) : 346.
[V35] Keeney R.L. (1999).The Value of Internet Commerce to the Customer. Management
Science. 45(4): 533-542.
[V36] Huang G.Q.,. Mak K.L. (200).WeBid: A web-based framework to support early supplier involvement in new product development. Robotics and Computer-Integrated
Manufacturing. 16(3): 169-179.
[V37] Hansen M.T., Nohria N., Tierney T. (1999).What’s Your Strategy for Managing
Knowledge?Harvard Business Review.
[V38] Holsapple C.W., Singh M. (2000). Toward unified view of electronic commerce, electronic business, and collaborative commerce: a knowledge management approach.
Knowledge and Process Management ABI/INFORM Global. 7(3): 151.
[V39] Fairchild A.M., Peterson R.R. ().Business-to-Business Value Drivers and eBusiness Infrastructures in Financial Services: Collaborative Commerce Across Global Markets and Networks. Proceedings of the 36th Hawaii International Conference on System