行政院國家科學委員會專題研究計畫 成果報告
客製化產品推薦模式之研究: 有限混合與層級貝氏邏輯斯
模式之比較
研究成果報告(精簡版)
計 畫 類 別 : 個別型 計 畫 編 號 : NSC 95-2416-H-002-049- 執 行 期 間 : 95 年 08 月 01 日至 96 年 07 月 31 日 執 行 單 位 : 國立臺灣大學國際企業學系暨研究所 計 畫 主 持 人 : 任立中 計畫參與人員: 博士班研究生-兼任助理:邵功新 報 告 附 件 : 出席國際會議研究心得報告及發表論文 處 理 方 式 : 本計畫可公開查詢中 華 民 國 96 年 12 月 21 日
A Study of Customized Product Recommendation Models: Comparison of
Finite Mixture and Hierarchical Bayes Logit Models
ABSCRACT
The purpose of this article is to provide a set of solutions for customized new product
recommendation to improve the performance of CRM (Customer Relationship Management)
project. We proposed two customized new product recommendation models: finite
mixture Probit and hierarchical Bayes Probit model. The proposed methods are tested by
random selected customers in a home electronic retailer’s CRM database, and results show
that the presented customized new product recommendation models perform well. The
approach of this paper has its strength to be able to do new product recommendation and
cross-selling in database marketing on a one to one basis.
Keyword: Customer Relationship Management; New Product Recommendation; Finite
When you have a now product to sell, do you have trouble in identifying the customers
who might have higher propensity to buy this product in your CRM (customer relationship
management) database? A good new product recommendation system provides high-value
of service to customers, enhances cross-selling in database marketing, and generates higher
profits for this company. With the CRM database, company now can better understand
customer needs, can recommend right product for their customers, and can integrate
knowledge into their product design and marketing plans. However, the goal is often
difficult to achieve. Nearly half of U.S. implementations and more than 80 percent of
European implementations of CRM project are considered failures (Patron 2002). To
getting value back out of CRM, a good solution for customized new product
recommendation can not be ignored.
Current Solutions for Product Recommendation
Current solutions for product recommendation can be briefly categorized as two types
of filtering. The first is collaborative filtering which is based on the similarity between
customers’ rating. Despite it has been intensively used by internet retailers such as
Amazon.com, it still has limitations in practice. In order for collaborative
recommendation to be accurate, a large number of transaction data of a given product must
be prepared. Accordingly, it is completely limited when new products being encountered.
The other type is content-based filtering which match customer interest profiles with the
product attributes. In order for the approach to be effective, sufficiently rich product
information as well as personal preference profiles should be available. Accordingly, this
approach is limited when new customers are encountered.
Some scholars suggest to using hybrid models to overcome the limitations (Ariely,
Lynch and Aparicio 2002; Balabanovic and Shoham 1997; Pazzani 1999). However, the
filtering approach still be criticized (Ansari, Essegaier, and Kohli 2000; Iacobucci, Arabie,
and Bodapati 2000). First, the proposed filtering techniques are typically based upon
customers’ ratings data, instead of actual purchases record. This might limits their
application in practice. Second, filtering techniques does not base upon statistical method
so that they are unable to reflect uncertainty in predictions. To overcome this problem,
Ansari, Essegaier, and Kohli (2000) proposed a hierarchical Bayes regression model for
internet movie recommendations. The hierarchical Bayes approach can be used to provide
recommendations when either new products or new customers are being encountered.
Although their study provides great insights, two reasons might challenge the managers’
intension to put their idea into CRM practice. First, their study was based upon consumer’s
preference self-rating data instead of actual transaction records. Can we apply their
framework to improve the performance of new product recommendation in CRM project?
retailers, they sell multi-category products. Accordingly, they are more concern about how
to do new product recommendations for mulit-catogory products? The purpose of this
article is to provide a solution designed for doing customized new product recommendations.
The analytical solution is based upon statistical choice model and derived from our practical
experience during the implementation of CRM project of a home electronic appliance
retailer.
The outline of this paper is as follows. In the next section, we introduce a CRM case
from a home appliance retailer. The steps of proposed solution are illustrated. In the final
section, we present the results of estimation and compare the success of hit rates of different
methods, and a conclusion was provided in the last section.
A CRM Case form a Home Appliances Retailer
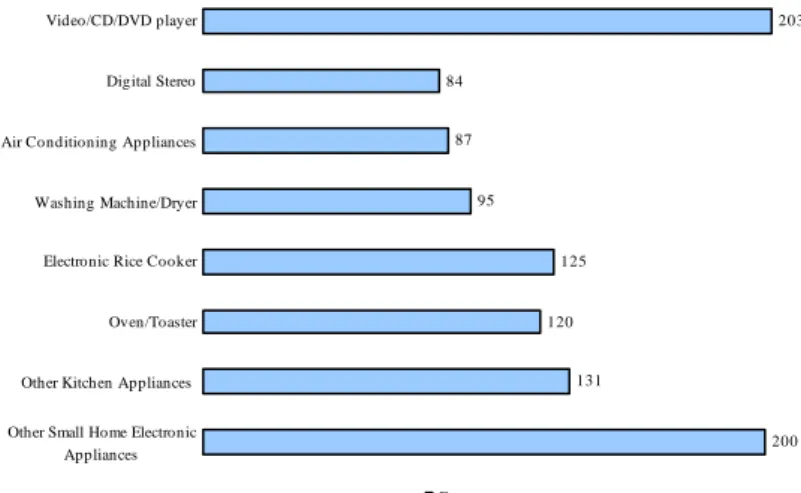
We use the data from the CRM database of a home appliance retailer in Taiwan.
They have implemented their CRM system since Jan 01, 1999. Transaction data were
available from Jan 01, 1999 to Jan 01 2001. There are 23 products categories selected for
analysis including electronic television, VCD, DVD, digital studio, air conditioning, et al.
(see figure 1). A random sample of 400 customers was selected for analysis (up to 1153
transaction records). The data of each customer includes their transaction data and
demographic information (see table 1).
Figure 1 here
Table 1 (a) here
Table 1 (b) here
Marketing scholars have encouraged the employ of choice model to improve the
analytical CRM project (Kamakura et al. 2005). However, there are several challenges for
researchers to apply choice model in CRM database. First, lacking of product attributes
coding in database. Second, the alternative choices were unavailable because only the real
purchased products were recorded in database. Third, methods to integrate data from
several kinds of sources were often depended on researchers’ expertise as well as experience.
In the following section, we develop a system way of analytical solution designed to
overcome these challenges and to improve the performance of new product
recommendation in CRM practice.
The Procedures and Logic for Proposed Models
The underlying assumption of proposed models is the features of these products can
be identified into common attributes. For instance, the common attributes for consumer
electronic products are country of origin, product design, function, price level, et al. In
that case, the procedures and logic for the proposed model are as follows: (1) we have
access to a retailer’ customer database that consists customers’ transaction records of
multi-category products and demographic information; (2) in each transaction, customer
products can be identified and coded; (4) individual’s preference toward each particular
attribute are estimated; (5) the utilities of each alternative products are predicted in order to
recommend new products to customers.
In order to test the ability to recommend new products, we separate customers’
transaction records into two groups: in sample and holdout sample. The hold out sample is
the last one purchase record of each customer. The others transaction records of each
customer were used as in sample records to estimate parameters. Our method follows the
steps: coding of product attribute, developing pseudo choice set, statistical modeling,
estimation, and utilities prediction.
Coding of Product Attributes
From an information cue theoretic perspective, products may be conceived as
consisting of an array of information cues, such as design, brand name, price, and country
of origin (Bilkey and Nes 1982). Each cue provides customers with a basis for evaluating
the product, which might influence customers’ purchase decision. In order to decompose
customers’ preference toward these attributes, we collect and integrate data from three kinds
of sources: product managers’ opinions, CRM database and magazine. Product attributes
coding includes five categories. They are specified as follows: (1) Country of origin
(country of manufacturing & country of brand): US, Japan, Taiwan, China & East and South
Asia countries, and the other countries. (2) Functioning: superiority, middle level and
weak in function. (3) Product design: good or not good in design. (4) Price ratio: a
continuous variable, which is calculated form the database by comparing the price of
purchased product and the average prices in same product category for a given time period
closed to the transaction date. (5) word-of-mouth: good or not in word-of-mouth. Data
was collected form a magazine in which there is an annual survey regarding consumers’
favorite brands in each product categories in year 2000.
Pseudo Choice Set
In order to simulate the available choices faced by consumers when they made their
purchase decision in retailer store, we create pseudo choice set. In this step, we includes
and integrated the other customers’ transaction records form 90 days earlier than and 30
days later than the actual purchase record of the target product made by the customer. The
mean of pseudo choice set is 10.83, and the standard deviation is 5.28.
Model
To compare the performance of hit rates of different methods, we provide two basic
solutions for comparison: random recommendation and Probit model. The others are two
types of customized new product recommendation models: Finite Mixture Probit Model and
hierarchical Bayesian Probit model. In a finite mixture Probit model, the individual
preferences of a given customer can be obtained by the weighted combination of probability
attribute weight for each individual can be estimated by pooling of information form both
individual and across populations. Details of model specifications are stated in appendix.
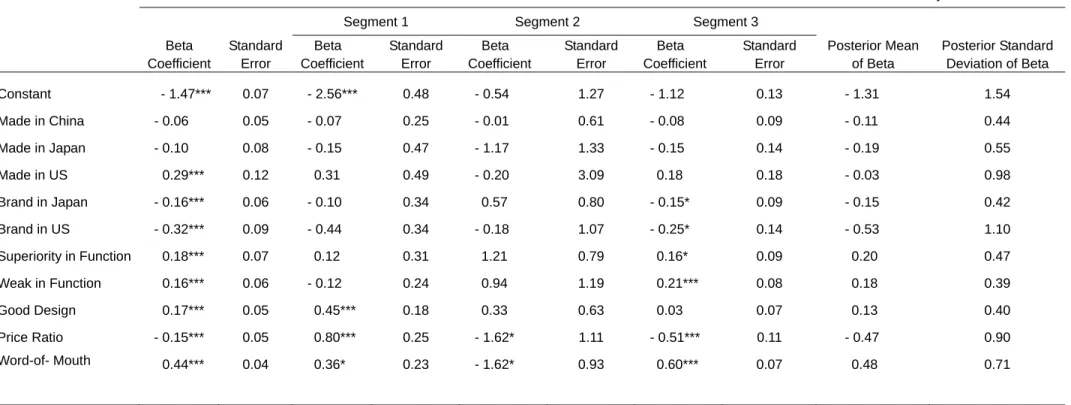
Results
Table 2 is the results of parameters estimated from Probit model, finite mixture Probit
model, and hierarchical Bayes Probit model. Some variable of country origin (i.e., country
of brand and country of manufacturing) were deleted due to either multicollinearity or too
few cases that might ruin the results of estimations. In the Probit model, we can see that
consumers have positive preference toward made in US. However, consumers have
negative attitude toward either country of brand in Japan or US. Comparing with middle
level in function, consumers have higher preference in either superiority or weak in
functioning. Besides, they have positive preference toward good design and
word-of-mouth and negative preference toward price ratio. The table 2 also shows the
estimated preference parameters of three finite mixture latent classes. In the first segment,
consumers have positive preference toward good design, price ratio and word-of-mouth.
People in this segment prefer good design and word-on-mouth products. They are more
willing to pay for relative higher price. People in the second segment are price
consciousness; they have negative preference toward price ratio and word-of-mouth.
Finally, people in the third segment are value consciousness; they have positive preference
toward function and word-of-mouth but negative preference toward price ratio. The last
two columns in table 2 are the results of hierarchical Bayes Probit model. The parameters
were the posterior mean and posterior standard deviation of individual beta parameters.
The posterior standard deviation of beta can represents the heterogeneity in consumers’
preference structure rather than represents the standard error in beta estimation. In
hierarchical Bayes Probit model, the individual’s demographic or behavior information can
be included to predict individualized parameters. Table 3 shows the results of these
coefficients estimated form hierarchical Bayes Probit model. For example, compared
with customers age below 20, customers age above 60 have negative preference toward
price ratio. Γ
Table 2 here
Table 3 here
After obtaining the estimated beta coefficients, we predict the utilities for each product
in pseudo choice set. Then, the set of utilities in each pseudo choice set were ranked form
high to low. The ranked number of actual purchased record can be used to represent the
numbers of recommended products that is required in order to hit the target product in each
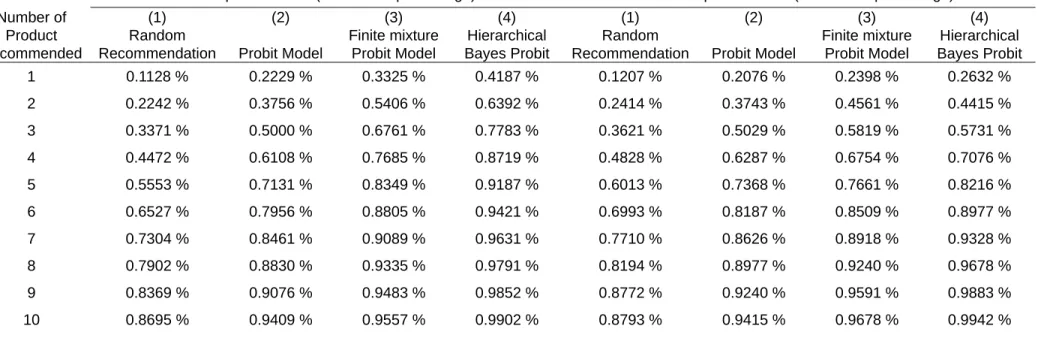
choice set. As shows in table 4, the results were aggregated to test the predictive power of
different methods. In the in sample hit rates, the hierarchical Bayes Probit model out
perform finite mixture Probit model, and they both out perform Probit model and random
three recommendations of finite mixture Probit model is quite close to hierarchical Bayes
Probit model. The hierarchical Bayes Probit model still out performs the other models.
Table 4 here
Conclusion
The purpose of this article is to provide a solution designed for new product
recommendation. We propose two customized new product recommendation methods.
Both methods can help us to decompose consumers’ preference toward particular attribute,
and then help us to predict the purchase probabilities. The results of hit rates comparison
show that both of our proposed customized new product recommendation models perform
well in either in sample or hold out sample prediction. Thus, we suggest managers can
apply these customized new product recommendations when they want to improved their
performance in new product recommendation.
Reference
Allenby, M. Greg and James L. Ginter 1995. Using Extremes to Design Products and
Segment Markets, Journal of Marketing Research, 32 (November), 392–403.
Allenby, M. Greg, Neeraj Arora and James L. Ginter 1998. On the Heterogeneity of Demand,
Journal of Marketing Research, 35 (August), 384–89.
Allenby, M. Greg and Peter E. Rossi 1999. Marketing Models of Consumer Heterogeneity,
Journal of Econometrics, 89 (March/April), 57–78.
Ansari, Asim, Skander Essegaier and Rajeev Kohli 2000. Internet Recommendation Systems,
Journal of Marketing Research, 37 (August), 363-75.
Ariely, Dan, John G. Lynch Jr., and Manuel Aparicio IV 2004.., Learning by Collaborative
and Individual-Based Recommendation Agents, Journal of Consumer Psychology,
14(1&2), 81–94.
Balabanovic, Marko and Yoav Shoham 1997. Fab: Content-Based, Collaborative
Recommendation, Communications of the Association for Computing Machinery, 40
(3), 66-72.
Bilkey J. Warren and Erik Nes 1982. Country-of-Origin Effects on Product Evaluations,
Journal of International Business Studies, Vol. 13(1), 89-100.
Iacobucci, Dawn, Phipps Arabie, and Anand Bodapati 2000. Recommendation Agents on the
Kamakura, A. Wagner and Gary J. Russell 1989. A Probabilistic Choice Model for Market
Segmentation and Elasticity Structure, Journal of Marketing Research, 26 (November),
379-390.
Kamakura, A. Wagner, Carl F. Mela, Asim Ansari, Anand Bodapati, Pete Fader, Raghuram
Iyengar, Prasad Naik, Scott Neslin, Baohong Sun, Peter C. Verhoef, Michel Wedel and
Ron Wilcox 2005. Choice Models and Customer Relationship management, Working
Paper, Duck University.
Patron, Mark 2002. Editorial: If Database Marketing Was So Good, Why Is CRM So Bad?
Journal of Database Marketing, Vol. 10 (2), 102-103.
Pazzani, J. Michael 1999. A Framework for Collaborative, Content-Based and Demographic
Filtering, Artificial Intelligence Review, 13, 393-408.
Rossi, E. Peter and Greg M. Allenby 2003. Bayesian Statistics and Marketing, Marketing
Science, 22(3), 304–328.
200 131 120 125 95 87 84 203
Other Small Home Electronic Appliances Other Kitchen Appliances
Oven/Toaster Electronic Rice Cooker Washing Machine/Dryer Air Conditioning Appliances Digital Stereo Video/CD/DVD player
Frequency
14 ember ID Purchase Amount Quantity Purchase date Category Code Store
ID Brand Product Model 20009425 8500 1 19990704 12502 1 RCA 20 inches TV F21634TW 20009425 680 1 19990916 1303 1 ALIGN Oven OCE-8037 20009425 1980 1 20000729 1204 2 AIWA Digital Stereo XRAKH300 20012511 9500 1 20000816 22101 3 TECO Refrigerator RE-1601S 20015739 18000 1 20001027 22302 4 TECO Refrigerator RE6001N 20015739 13500 1 20001027 23103 11 SAMPO Washing machine ES-103SBF 20016493 19000 1 19991121 10401 8 AIWA Digital Stereo XRAKH100 20016493 2490 1 20000618 2101 7 HITACHI Vacuum Cleaner PV-C25 20016493 690 1 20000824 3301 7 PUMP Electric Iron TSK-750CS 20020521 1690 1 20000104 25101 10 SANYO DVD Player R-CF01T
…….. …….. …….. …….. …….. …… …….. …….. ……..
20940532 2988 1 20000131 10401 14 SANYO Digital Stereo DC-LU6
Table 1(a) is an example of data available in CRM transaction database.
Member ID
Card
Starting Date Gender Age
Post No. 20009425 10/14/2000 1 32 557 20012511 07/07/1997 1 38 820 20015739 11/18/2000 1 40 557 20016493 12/10/2000 1 27 241 20019338 09/16/1999 1 30 330 20002102 01/27/1990 2 31 830 20002383 07/28/2000 1 34 812 20013243 06/24/1994 2 64 704 20013421 01/24/1992 1 84 802 20015621 10/28/2000 1 32 356 …….. …….. …….. …….. …….. 20020532 08/09/1999 2 42 360
Probit Model Finite Mixture Probit Model Hierarchical Bayes Probit Model Segment 1 Segment 2 Segment 3
Beta Coefficient Standard Error Beta Coefficient Standard Error Beta Coefficient Standard Error Beta Coefficient Standard Error Posterior Mean of Beta Posterior Standard Deviation of Beta Constant - 1.47*** 0.07 - 2.56*** 0.48 - 0.54 1.27 - 1.12 0.13 - 1.31 1.54 Made in China - 0.06 0.05 - 0.07 0.25 - 0.01 0.61 - 0.08 0.09 - 0.11 0.44 Made in Japan - 0.10 0.08 - 0.15 0.47 - 1.17 1.33 - 0.15 0.14 - 0.19 0.55 Made in US 0.29*** 0.12 0.31 0.49 - 0.20 3.09 0.18 0.18 - 0.03 0.98 Brand in Japan - 0.16*** 0.06 - 0.10 0.34 0.57 0.80 - 0.15* 0.09 - 0.15 0.42 Brand in US - 0.32*** 0.09 - 0.44 0.34 - 0.18 1.07 - 0.25* 0.14 - 0.53 1.10 Superiority in Function 0.18*** 0.07 0.12 0.31 1.21 0.79 0.16* 0.09 0.20 0.47 Weak in Function 0.16*** 0.06 - 0.12 0.24 0.94 1.19 0.21*** 0.08 0.18 0.39 Good Design 0.17*** 0.05 0.45*** 0.18 0.33 0.63 0.03 0.07 0.13 0.40 Price Ratio - 0.15*** 0.05 0.80*** 0.25 - 1.62* 1.11 - 0.51*** 0.11 - 0.47 0.90 Word-of- Mouth 0.44*** 0.04 0.36* 0.23 - 1.62* 0.93 0.60*** 0.07 0.48 0.71
In sample is an unbalance panel that includes 400 individuals. The total number of observations is 8481 *p < .1, ** p < .05, *** p < .01
Made in Japan means product manufactured in Japan COO in Japan means the country of origin of brand is Japan
Constant Made in China Made in Japan Made in US COO in Japan COO in US Superiority in Function Weak in Function Superiority in Design Price Ratio Word-of- Mouth
Constant Posterior Mean 4.72 *** - 2.10 *** - 2.05 *** - 2.89 *** 0.26 - 2.65 *** 1.25 1.45 ** - 1.94 *** - 4.27 *** 0.28 Posterior STD (1.18) (0.87) (0.91) (1.08) (0.89) (1.03) (0.88) (0.83) (0.85) (0.96) (0.80) Gender Posterior Mean 0.02 - 0.26 0.03 0.59 - 0.08 - 0.17 - 0.29 - 0.02 0.10 0.12 0.07
Posterior STD (0.46) (0.32) (0.48) (0.63) (0.39) (0.43) (0.38) (0.34) (0.36) (0.44) (0.34) Age 21-30 Posterior Mean - 0.55 0.85 1.42 *** 3.24 *** - 0.95 0.04 - 0.59 - 0.18 0.93 - 0.12 - 0.71
Posterior STD (0.86) (0.69) (0.68) (0.73) (0.95) (1.14) (0.67) (0.68) (0.60) (0.73) (0.67) Age 31-40 Posterior Mean - 0.96 1.00 1.67 *** 2.76 *** - 1.00 1.75 ** - 0.59 - 0.20 0.74 0.03 - 0.08
Posterior STD (0.79) (0.70) (0.79) (0.80) (0.83) (1.01) (0.59) (0.61) (0.54) (0.74) (0.59) Age 41-50 Posterior Mean - 0.95 1.27 ** 1.67 *** 1.72 *** - 0.89 2.12 *** - 0.28 0.10 0.67 - 0.24 - 0.29
Posterior STD (0.78) (0.68) (0.66) (0.77) (0.89) (0.96) (0.60) (0.59) (0.58) (0.72) (0.58) Age 51-60 Posterior Mean - 1.00 1.00 1.81 *** 2.20 *** - 0.93 2.06 *** - 0.81 - 0.16 0.81 - 0.10 0.26
Posterior STD (0.84) (0.70) (0.75) (0.79) (0.85) (0.99) (0.64) (0.62) (0.56) (0.73) (0.58) Age above 60Posterior Mean - 0.59 1.40 *** 1.02 1.59 - 0.15 2.59 *** 0.01 0.12 0.26 - 1.16 ** 0.53
Posterior STD (0.93) (0.62) (0.92) (0.90) (0.96) (1.04) (0.72) (0.73) (0.66) (0.67) (0.69) Frequency Posterior Mean - 0.03 0.00 0.02 0.02 - 0.02 0.01 0.00 0.01 0.01 0.01 - 0.01
Posterior STD (0.10) (0.09) (0.12) (0.14) (0.10) (0.10) (0.10) (0.09) (0.08) (0.09) (0.08) Log_Amount Posterior Mean - 0.59 * 0.13 0.01 0.02 0.08 0.04 - 0.04 - 0.15 0.14 0.45 0.04
Posterior STD (0.36) (0.27) (0.30) (0.32) (0.25) (0.29) (0.28) (0.26) (0.26) (0.30) (0.25)
*p < .1, ** p < .05, *** p < .01
Log_amount means log average purchase amount
Table 3: This table shows the posterior mean and posterior standard deviation of Γcoefficients
In Sample Hit Rates (cumulative percentage) Out Sample Hit Rates (cumulative percentage) Number of Product Recommended (1) Random Recommendation (2) Probit Model (3) Finite mixture Probit Model (4) Hierarchical Bayes Probit (1) Random Recommendation (2) Probit Model (3) Finite mixture Probit Model (4) Hierarchical Bayes Probit 1 0.1128 % 0.2229 % 0.3325 % 0.4187 % 0.1207 % 0.2076 % 0.2398 % 0.2632 % 2 0.2242 % 0.3756 % 0.5406 % 0.6392 % 0.2414 % 0.3743 % 0.4561 % 0.4415 % 3 0.3371 % 0.5000 % 0.6761 % 0.7783 % 0.3621 % 0.5029 % 0.5819 % 0.5731 % 4 0.4472 % 0.6108 % 0.7685 % 0.8719 % 0.4828 % 0.6287 % 0.6754 % 0.7076 % 5 0.5553 % 0.7131 % 0.8349 % 0.9187 % 0.6013 % 0.7368 % 0.7661 % 0.8216 % 6 0.6527 % 0.7956 % 0.8805 % 0.9421 % 0.6993 % 0.8187 % 0.8509 % 0.8977 % 7 0.7304 % 0.8461 % 0.9089 % 0.9631 % 0.7710 % 0.8626 % 0.8918 % 0.9328 % 8 0.7902 % 0.8830 % 0.9335 % 0.9791 % 0.8194 % 0.8977 % 0.9240 % 0.9678 % 9 0.8369 % 0.9076 % 0.9483 % 0.9852 % 0.8772 % 0.9240 % 0.9591 % 0.9883 % 10 0.8695 % 0.9409 % 0.9557 % 0.9902 % 0.8793 % 0.9415 % 0.9678 % 0.9942 %
A random sample of 400 customers’ transactions was selected for analysis. The last one purchase records of sampled customers were selected as hold out sample. There are 58 customer samples with only one transaction record. Accordingly, the hold out sample contains 342 actual transaction records of 342 customers. The in sample contains 811 actual transaction records of 400 customers
Table 4 is the comparison of cumulative percentage of hit rates. The hierarchical Bayes Probit model out performs the other models in either in sample and hold out sample prediction.
Appendix
To compare the performance of hit rates, we provide two basic solutions and two
customized new product recommendation model for comparison.
Random Recommendation
The first one is random recommendation. It is assumed that no information regarding
customer’ preferences is available. If there are 10 products for choice, the hit rate for
randomly recommending one product is 1/10.
Probit model
It is assumed no knowledge regarding individual’s preference. However, the
knowledge regarding the preference structure of aggregate market is available. Thus, their
new product recommendations are based upon the same preference structure of their
customers rather then customized new product recommendation. The Probit model is
specified as follows:
yij =x'ijβ εi+ ij yij =0,1, i=1, 2,..., , n j=1, 2,...,Ji
whereεijm follow normal distribution. Let to denote the choice made by
individual i in Ji choice occasions, and x is a set of common product attributes.
ij y
Finite Mixture Probit Model
A finite mixture model that employs a finite set of mass points to capture heterogeneity
has a history for the analysis of individual heterogeneity. It is assumed that individuals are
implicitly sorted into a set of S classes, s=1, 2,…..S. In marketing application, these classes
can be regarded as customer segments in the market. The following is a finite mixture
Probit model for choice made by individual i (i=1, 2,…., N) observed in Ji choice situations,
where x is a set of common product attributes. Let to denote the specific choice made by
individual i in choice situation Ji, so that the model provides
ij y ij ij exp(x ' ) Prob( 1| class ) = 1 exp (x ' ) s ij s y s β β = = +
The individual specific parameter vector isβˆi =
∑
Ss=1Hˆs i|βˆs (Kamakura and Russell 1989). H is the individual i ‘s probabilities of being class s. This formula will be used ˆs i|to estimate individual preference toward product attributes to help us to predictive the
purchase probability of any selected new or existing products.
Hierarchical Bayes Probit Model
The hierarchical Bayes approaches to modeling consumer heterogeneity have been
conducted over a wide range of marketing problems (e.g., Allenby and Ginter 1995;
Allenby, Arora, and Ginter 1998; Rossi and Allenby 2003). The model we will employ is
the hierarchical Bayes Probit model. Let to denote the specific choice made by
individual i in choice situation Ji,, x is a set of common product attributes, ij
y
yij =x'ijβ εi+ ij yij =0,1, i=1, 2,..., , n j=1, 2,...,Ji
i zi i
β = Γ + ζ
occasions of subject i. βi is a matrix of individualized preference coefficients, and Γ is a matrix of coefficients that relate βi to the value of , and is a vector of covariates that account for observed heterogeneity. In this study, the covariate includes
demographic variables (i.e., age, gender) and observed behavior variables in database (log
average purchase amount and frequency).
i
z zi
i
ζ is unobserved heterogeneity component, which is assumed to be multivariate normal distribution (Allenby and Ginter 1995). βi will be used in this study to estimate individual preference toward product attributes to
help us to predictive the purchase probability of any new products.
Presented at 2007 INFORMS Marketing Science Conference, June 27-30, 2007, Lee Kong Chian School of Business, Singapore Management University, Singapore.
Jen, Lichung, Hsiu-Wen Liu, and Kung-Hsin Shao, 2007, Customized New Product
Recommendation in CRM Database, 2007 INFORMS Marketing Science Conference, June 27-30, 2007, Lee Kong Chian School of Business, Singapore Management University, Singapore.
Customized New Product Recommendation in CRM Database
ABSCRACT
The purpose of this article is to provide a set of solutions for customized new product recommendation to improve the performance of CRM (Customer Relationship Management) project. We proposed two customized new product recommendation models: finite
mixture Probit and hierarchical Bayes Probit model. The proposed methods are tested by random selected customers in a home electronic retailer’s CRM database, and results show that the presented customized new product recommendation models perform well. The approach of this paper has its strength to be able to do new product recommendation and cross-selling in database marketing on a one to one basis.
Keyword: Customer Relationship Management; New Product Recommendation; Finite
When you have a now product to sell, do you have trouble in identifying the customers
who might have higher propensity to buy this product in your CRM (customer relationship
management) database? A good new product recommendation system provides high-value
of service to customers, enhances cross-selling in database marketing, and generates higher
profits for this company. With the CRM database, company now can better understand
customer needs, can recommend right product for their customers, and can integrate
knowledge into their product design and marketing plans. However, the goal is often
difficult to achieve. Nearly half of U.S. implementations and more than 80 percent of
European implementations of CRM project are considered failures (Patron 2002). To
getting value back out of CRM, a good solution for customized new product
recommendation can not be ignored.
Current Solutions for Product Recommendation
Current solutions for product recommendation can be briefly categorized as two types
of filtering. The first is collaborative filtering which is based on the similarity between
customers’ rating. Despite it has been intensively used by internet retailers such as
Amazon.com, it still has limitations in practice. In order for collaborative
recommendation to be accurate, a large number of transaction data of a given product must
be prepared. Accordingly, it is completely limited when new products being encountered.
The other type is content-based filtering which match customer interest profiles with the
product attributes. In order for the approach to be effective, sufficiently rich product
information as well as personal preference profiles should be available. Accordingly, this
approach is limited when new customers are encountered.
Some scholars suggest to using hybrid models to overcome the limitations (Ariely,
Lynch and Aparicio 2002; Balabanovic and Shoham 1997; Pazzani 1999). However, the
filtering approach still be criticized (Ansari, Essegaier, and Kohli 2000; Iacobucci, Arabie,
and Bodapati 2000). First, the proposed filtering techniques are typically based upon
customers’ ratings data, instead of actual purchases record. This might limits their
application in practice. Second, filtering techniques does not base upon statistical method
so that they are unable to reflect uncertainty in predictions. To overcome this problem,
Ansari, Essegaier, and Kohli (2000) proposed a hierarchical Bayes regression model for
internet movie recommendations. The hierarchical Bayes approach can be used to provide
recommendations when either new products or new customers are being encountered.
Although their study provides great insights, two reasons might challenge the managers’
intension to put their idea into CRM practice. First, their study was based upon consumer’s
preference self-rating data instead of actual transaction records. Can we apply their
framework to improve the performance of new product recommendation in CRM project?
Second, their study was only focus on one single product category--movie. For most
to do new product recommendations for mulit-catogory products? The purpose of this
article is to provide a solution designed for doing customized new product recommendations.
The analytical solution is based upon statistical choice model and derived from our practical
experience during the implementation of CRM project of a home electronic appliance
retailer.
The outline of this paper is as follows. In the next section, we introduce a CRM case
from a home appliance retailer. The steps of proposed solution are illustrated. In the final
section, we present the results of estimation and compare the success of hit rates of different
methods, and a conclusion was provided in the last section.
A CRM Case form a Home Appliances Retailer
We use the data from the CRM database of a home appliance retailer in Taiwan.
They have implemented their CRM system since Jan 01, 1999. Transaction data were
available from Jan 01, 1999 to Jan 01 2001. There are 23 products categories selected for
analysis including electronic television, VCD, DVD, digital studio, air conditioning, et al.
(see figure 1). A random sample of 400 customers was selected for analysis (up to 1153
transaction records). The data of each customer includes their transaction data and
demographic information (see table 1).
Figure 1 here
Table 1 (a) here
Table 1 (b) here
Marketing scholars have encouraged the employ of choice model to improve the
analytical CRM project (Kamakura et al. 2005). However, there are several challenges for
researchers to apply choice model in CRM database. First, lacking of product attributes
coding in database. Second, the alternative choices were unavailable because only the real
purchased products were recorded in database. Third, methods to integrate data from
several kinds of sources were often depended on researchers’ expertise as well as experience.
In the following section, we develop a system way of analytical solution designed to
overcome these challenges and to improve the performance of new product
recommendation in CRM practice.
The Procedures and Logic for Proposed Models
The underlying assumption of proposed models is the features of these products can
be identified into common attributes. For instance, the common attributes for consumer
electronic products are country of origin, product design, function, price level, et al. In
that case, the procedures and logic for the proposed model are as follows: (1) we have
access to a retailer’ customer database that consists customers’ transaction records of
multi-category products and demographic information; (2) in each transaction, customer
chooses one product from a series of potential choice set; (3) the common attributes of
attribute are estimated; (5) the utilities of each alternative products are predicted in order to
recommend new products to customers.
In order to test the ability to recommend new products, we separate customers’
transaction records into two groups: in sample and holdout sample. The hold out sample is
the last one purchase record of each customer. The others transaction records of each
customer were used as in sample records to estimate parameters. Our method follows the
steps: coding of product attribute, developing pseudo choice set, statistical modeling,
estimation, and utilities prediction.
Coding of Product Attributes
From an information cue theoretic perspective, products may be conceived as
consisting of an array of information cues, such as design, brand name, price, and country
of origin (Bilkey and Nes 1982). Each cue provides customers with a basis for evaluating
the product, which might influence customers’ purchase decision. In order to decompose
customers’ preference toward these attributes, we collect and integrate data from three kinds
of sources: product managers’ opinions, CRM database and magazine. Product attributes
coding includes five categories. They are specified as follows: (1) Country of origin
(country of manufacturing & country of brand): US, Japan, Taiwan, China & East and South
Asia countries, and the other countries. (2) Functioning: superiority, middle level and
weak in function. (3) Product design: good or not good in design. (4) Price ratio: a
continuous variable, which is calculated form the database by comparing the price of
purchased product and the average prices in same product category for a given time period
closed to the transaction date. (5) word-of-mouth: good or not in word-of-mouth. Data
was collected form a magazine in which there is an annual survey regarding consumers’
favorite brands in each product categories in year 2000.
Pseudo Choice Set
In order to simulate the available choices faced by consumers when they made their
purchase decision in retailer store, we create pseudo choice set. In this step, we includes
and integrated the other customers’ transaction records form 90 days earlier than and 30
days later than the actual purchase record of the target product made by the customer. The
mean of pseudo choice set is 10.83, and the standard deviation is 5.28.
Model
To compare the performance of hit rates of different methods, we provide two basic
solutions for comparison: random recommendation and Probit model. The others are two
types of customized new product recommendation models: Finite Mixture Probit Model and
hierarchical Bayesian Probit model. In a finite mixture Probit model, the individual
preferences of a given customer can be obtained by the weighted combination of probability
and preference form similar customers. In a hierarchical Bayesian Probit model, a specific
individual and across populations. Details of model specifications are stated in appendix.
Results
Table 2 is the results of parameters estimated from Probit model, finite mixture Probit
model, and hierarchical Bayes Probit model. Some variable of country origin (i.e., country
of brand and country of manufacturing) were deleted due to either multicollinearity or too
few cases that might ruin the results of estimations. In the Probit model, we can see that
consumers have positive preference toward made in US. However, consumers have
negative attitude toward either country of brand in Japan or US. Comparing with middle
level in function, consumers have higher preference in either superiority or weak in
functioning. Besides, they have positive preference toward good design and
word-of-mouth and negative preference toward price ratio. The table 2 also shows the
estimated preference parameters of three finite mixture latent classes. In the first segment,
consumers have positive preference toward good design, price ratio and word-of-mouth.
People in this segment prefer good design and word-on-mouth products. They are more
willing to pay for relative higher price. People in the second segment are price
consciousness; they have negative preference toward price ratio and word-of-mouth.
Finally, people in the third segment are value consciousness; they have positive preference
toward function and word-of-mouth but negative preference toward price ratio. The last
two columns in table 2 are the results of hierarchical Bayes Probit model. The parameters
were the posterior mean and posterior standard deviation of individual beta parameters.
The posterior standard deviation of beta can represents the heterogeneity in consumers’
preference structure rather than represents the standard error in beta estimation. In
hierarchical Bayes Probit model, the individual’s demographic or behavior information can
be included to predict individualized parameters. Table 3 shows the results of these
coefficients estimated form hierarchical Bayes Probit model. For example, compared
with customers age below 20, customers age above 60 have negative preference toward
price ratio. Γ
Table 2 here
Table 3 here
After obtaining the estimated beta coefficients, we predict the utilities for each product
in pseudo choice set. Then, the set of utilities in each pseudo choice set were ranked form
high to low. The ranked number of actual purchased record can be used to represent the
numbers of recommended products that is required in order to hit the target product in each
choice set. As shows in table 4, the results were aggregated to test the predictive power of
different methods. In the in sample hit rates, the hierarchical Bayes Probit model out
perform finite mixture Probit model, and they both out perform Probit model and random
recommendation. With regard to the hold out sample hit rates, the hit rates among the first
Probit model. The hierarchical Bayes Probit model still out performs the other models.
Table 4 here
Conclusion
The purpose of this article is to provide a solution designed for new product
recommendation. We propose two customized new product recommendation methods.
Both methods can help us to decompose consumers’ preference toward particular attribute,
and then help us to predict the purchase probabilities. The results of hit rates comparison
show that both of our proposed customized new product recommendation models perform
well in either in sample or hold out sample prediction. Thus, we suggest managers can
apply these customized new product recommendations when they want to improved their
performance in new product recommendation.
Reference
Allenby, M. Greg and James L. Ginter 1995. Using Extremes to Design Products and
Segment Markets, Journal of Marketing Research, 32 (November), 392–403.
Allenby, M. Greg, Neeraj Arora and James L. Ginter 1998. On the Heterogeneity of Demand,
Journal of Marketing Research, 35 (August), 384–89.
Allenby, M. Greg and Peter E. Rossi 1999. Marketing Models of Consumer Heterogeneity,
Journal of Econometrics, 89 (March/April), 57–78.
Ansari, Asim, Skander Essegaier and Rajeev Kohli 2000. Internet Recommendation Systems,
Journal of Marketing Research, 37 (August), 363-75.
Ariely, Dan, John G. Lynch Jr., and Manuel Aparicio IV 2004.., Learning by Collaborative
and Individual-Based Recommendation Agents, Journal of Consumer Psychology,
14(1&2), 81–94.
Balabanovic, Marko and Yoav Shoham 1997. Fab: Content-Based, Collaborative
Recommendation, Communications of the Association for Computing Machinery, 40
(3), 66-72.
Bilkey J. Warren and Erik Nes 1982. Country-of-Origin Effects on Product Evaluations,
Journal of International Business Studies, Vol. 13(1), 89-100.
Iacobucci, Dawn, Phipps Arabie, and Anand Bodapati 2000. Recommendation Agents on the
Kamakura, A. Wagner and Gary J. Russell 1989. A Probabilistic Choice Model for Market
Segmentation and Elasticity Structure, Journal of Marketing Research, 26 (November),
379-390.
Kamakura, A. Wagner, Carl F. Mela, Asim Ansari, Anand Bodapati, Pete Fader, Raghuram
Iyengar, Prasad Naik, Scott Neslin, Baohong Sun, Peter C. Verhoef, Michel Wedel and
Ron Wilcox 2005. Choice Models and Customer Relationship management, Working
Paper, Duck University.
Patron, Mark 2002. Editorial: If Database Marketing Was So Good, Why Is CRM So Bad?
Journal of Database Marketing, Vol. 10 (2), 102-103.
Pazzani, J. Michael 1999. A Framework for Collaborative, Content-Based and Demographic
Filtering, Artificial Intelligence Review, 13, 393-408.
Rossi, E. Peter and Greg M. Allenby 2003. Bayesian Statistics and Marketing, Marketing
Science, 22(3), 304–328.
200 131 120 125 95 87 84 203
Other Small Home Electronic Appliances Other Kitchen Appliances
Oven/Toaster Electronic Rice Cooker Washing Machine/Dryer Air Conditioning Appliances Digital Stereo Video/CD/DVD player
Frequency
14 ember ID Purchase Amount Quantity Purchase date Category Code Store
ID Brand Product Model 20009425 8500 1 19990704 12502 1 RCA 20 inches TV F21634TW 20009425 680 1 19990916 1303 1 ALIGN Oven OCE-8037 20009425 1980 1 20000729 1204 2 AIWA Digital Stereo XRAKH300 20012511 9500 1 20000816 22101 3 TECO Refrigerator RE-1601S 20015739 18000 1 20001027 22302 4 TECO Refrigerator RE6001N 20015739 13500 1 20001027 23103 11 SAMPO Washing machine ES-103SBF 20016493 19000 1 19991121 10401 8 AIWA Digital Stereo XRAKH100 20016493 2490 1 20000618 2101 7 HITACHI Vacuum Cleaner PV-C25 20016493 690 1 20000824 3301 7 PUMP Electric Iron TSK-750CS 20020521 1690 1 20000104 25101 10 SANYO DVD Player R-CF01T
…….. …….. …….. …….. …….. …… …….. …….. ……..
20940532 2988 1 20000131 10401 14 SANYO Digital Stereo DC-LU6
Table 1(a) is an example of data available in CRM transaction database.
Member ID
Card
Starting Date Gender Age
Post No. 20009425 10/14/2000 1 32 557 20012511 07/07/1997 1 38 820 20015739 11/18/2000 1 40 557 20016493 12/10/2000 1 27 241 20019338 09/16/1999 1 30 330 20002102 01/27/1990 2 31 830 20002383 07/28/2000 1 34 812 20013243 06/24/1994 2 64 704 20013421 01/24/1992 1 84 802 20015621 10/28/2000 1 32 356 …….. …….. …….. …….. …….. 20020532 08/09/1999 2 42 360
Probit Model Finite Mixture Probit Model Hierarchical Bayes Probit Model Segment 1 Segment 2 Segment 3
Beta Coefficient Standard Error Beta Coefficient Standard Error Beta Coefficient Standard Error Beta Coefficient Standard Error Posterior Mean of Beta Posterior Standard Deviation of Beta Constant - 1.47*** 0.07 - 2.56*** 0.48 - 0.54 1.27 - 1.12 0.13 - 1.31 1.54 Made in China - 0.06 0.05 - 0.07 0.25 - 0.01 0.61 - 0.08 0.09 - 0.11 0.44 Made in Japan - 0.10 0.08 - 0.15 0.47 - 1.17 1.33 - 0.15 0.14 - 0.19 0.55 Made in US 0.29*** 0.12 0.31 0.49 - 0.20 3.09 0.18 0.18 - 0.03 0.98 Brand in Japan - 0.16*** 0.06 - 0.10 0.34 0.57 0.80 - 0.15* 0.09 - 0.15 0.42 Brand in US - 0.32*** 0.09 - 0.44 0.34 - 0.18 1.07 - 0.25* 0.14 - 0.53 1.10 Superiority in Function 0.18*** 0.07 0.12 0.31 1.21 0.79 0.16* 0.09 0.20 0.47 Weak in Function 0.16*** 0.06 - 0.12 0.24 0.94 1.19 0.21*** 0.08 0.18 0.39 Good Design 0.17*** 0.05 0.45*** 0.18 0.33 0.63 0.03 0.07 0.13 0.40 Price Ratio - 0.15*** 0.05 0.80*** 0.25 - 1.62* 1.11 - 0.51*** 0.11 - 0.47 0.90 Word-of- Mouth 0.44*** 0.04 0.36* 0.23 - 1.62* 0.93 0.60*** 0.07 0.48 0.71
In sample is an unbalance panel that includes 400 individuals. The total number of observations is 8481 *p < .1, ** p < .05, *** p < .01
Made in Japan means product manufactured in Japan COO in Japan means the country of origin of brand is Japan
Constant Made in China Made in Japan Made in US COO in Japan COO in US Superiority in Function Weak in Function Superiority in Design Price Ratio Word-of- Mouth
Constant Posterior Mean 4.72 *** - 2.10 *** - 2.05 *** - 2.89 *** 0.26 - 2.65 *** 1.25 1.45 ** - 1.94 *** - 4.27 *** 0.28 Posterior STD (1.18) (0.87) (0.91) (1.08) (0.89) (1.03) (0.88) (0.83) (0.85) (0.96) (0.80) Gender Posterior Mean 0.02 - 0.26 0.03 0.59 - 0.08 - 0.17 - 0.29 - 0.02 0.10 0.12 0.07
Posterior STD (0.46) (0.32) (0.48) (0.63) (0.39) (0.43) (0.38) (0.34) (0.36) (0.44) (0.34) Age 21-30 Posterior Mean - 0.55 0.85 1.42 *** 3.24 *** - 0.95 0.04 - 0.59 - 0.18 0.93 - 0.12 - 0.71
Posterior STD (0.86) (0.69) (0.68) (0.73) (0.95) (1.14) (0.67) (0.68) (0.60) (0.73) (0.67) Age 31-40 Posterior Mean - 0.96 1.00 1.67 *** 2.76 *** - 1.00 1.75 ** - 0.59 - 0.20 0.74 0.03 - 0.08
Posterior STD (0.79) (0.70) (0.79) (0.80) (0.83) (1.01) (0.59) (0.61) (0.54) (0.74) (0.59) Age 41-50 Posterior Mean - 0.95 1.27 ** 1.67 *** 1.72 *** - 0.89 2.12 *** - 0.28 0.10 0.67 - 0.24 - 0.29
Posterior STD (0.78) (0.68) (0.66) (0.77) (0.89) (0.96) (0.60) (0.59) (0.58) (0.72) (0.58) Age 51-60 Posterior Mean - 1.00 1.00 1.81 *** 2.20 *** - 0.93 2.06 *** - 0.81 - 0.16 0.81 - 0.10 0.26
Posterior STD (0.84) (0.70) (0.75) (0.79) (0.85) (0.99) (0.64) (0.62) (0.56) (0.73) (0.58) Age above 60Posterior Mean - 0.59 1.40 *** 1.02 1.59 - 0.15 2.59 *** 0.01 0.12 0.26 - 1.16 ** 0.53
Posterior STD (0.93) (0.62) (0.92) (0.90) (0.96) (1.04) (0.72) (0.73) (0.66) (0.67) (0.69) Frequency Posterior Mean - 0.03 0.00 0.02 0.02 - 0.02 0.01 0.00 0.01 0.01 0.01 - 0.01
Posterior STD (0.10) (0.09) (0.12) (0.14) (0.10) (0.10) (0.10) (0.09) (0.08) (0.09) (0.08) Log_Amount Posterior Mean - 0.59 * 0.13 0.01 0.02 0.08 0.04 - 0.04 - 0.15 0.14 0.45 0.04
Posterior STD (0.36) (0.27) (0.30) (0.32) (0.25) (0.29) (0.28) (0.26) (0.26) (0.30) (0.25)
*p < .1, ** p < .05, *** p < .01
Log_amount means log average purchase amount
Table 3: This table shows the posterior mean and posterior standard deviation of Γcoefficients
In Sample Hit Rates (cumulative percentage) Out Sample Hit Rates (cumulative percentage) Number of Product Recommended (1) Random Recommendation (2) Probit Model (3) Finite mixture Probit Model (4) Hierarchical Bayes Probit (1) Random Recommendation (2) Probit Model (3) Finite mixture Probit Model (4) Hierarchical Bayes Probit 1 0.1128 % 0.2229 % 0.3325 % 0.4187 % 0.1207 % 0.2076 % 0.2398 % 0.2632 % 2 0.2242 % 0.3756 % 0.5406 % 0.6392 % 0.2414 % 0.3743 % 0.4561 % 0.4415 % 3 0.3371 % 0.5000 % 0.6761 % 0.7783 % 0.3621 % 0.5029 % 0.5819 % 0.5731 % 4 0.4472 % 0.6108 % 0.7685 % 0.8719 % 0.4828 % 0.6287 % 0.6754 % 0.7076 % 5 0.5553 % 0.7131 % 0.8349 % 0.9187 % 0.6013 % 0.7368 % 0.7661 % 0.8216 % 6 0.6527 % 0.7956 % 0.8805 % 0.9421 % 0.6993 % 0.8187 % 0.8509 % 0.8977 % 7 0.7304 % 0.8461 % 0.9089 % 0.9631 % 0.7710 % 0.8626 % 0.8918 % 0.9328 % 8 0.7902 % 0.8830 % 0.9335 % 0.9791 % 0.8194 % 0.8977 % 0.9240 % 0.9678 % 9 0.8369 % 0.9076 % 0.9483 % 0.9852 % 0.8772 % 0.9240 % 0.9591 % 0.9883 % 10 0.8695 % 0.9409 % 0.9557 % 0.9902 % 0.8793 % 0.9415 % 0.9678 % 0.9942 %
A random sample of 400 customers’ transactions was selected for analysis. The last one purchase records of sampled customers were selected as hold out sample. There are 58 customer samples with only one transaction record. Accordingly, the hold out sample contains 342 actual transaction records of 342 customers. The in sample contains 811 actual transaction records of 400 customers
Table 4 is the comparison of cumulative percentage of hit rates. The hierarchical Bayes Probit model out performs the other models in either in sample and hold out sample prediction.
Appendix
To compare the performance of hit rates, we provide two basic solutions and two
customized new product recommendation model for comparison.
Random Recommendation
The first one is random recommendation. It is assumed that no information regarding
customer’ preferences is available. If there are 10 products for choice, the hit rate for
randomly recommending one product is 1/10.
Probit model
It is assumed no knowledge regarding individual’s preference. However, the
knowledge regarding the preference structure of aggregate market is available. Thus, their
new product recommendations are based upon the same preference structure of their
customers rather then customized new product recommendation. The Probit model is
specified as follows:
yij =x'ijβ εi+ ij yij =0,1, i=1, 2,..., , n j=1, 2,...,Ji
whereεijm follow normal distribution. Let to denote the choice made by
individual i in Ji choice occasions, and x is a set of common product attributes.
ij y
Finite Mixture Probit Model
A finite mixture model that employs a finite set of mass points to capture heterogeneity
has a history for the analysis of individual heterogeneity. It is assumed that individuals are
implicitly sorted into a set of S classes, s=1, 2,…..S. In marketing application, these classes
can be regarded as customer segments in the market. The following is a finite mixture
Probit model for choice made by individual i (i=1, 2,…., N) observed in Ji choice situations,
where x is a set of common product attributes. Let to denote the specific choice made by
individual i in choice situation Ji, so that the model provides
ij y ij ij exp(x ' ) Prob( 1| class ) = 1 exp (x ' ) s ij s y s β β = = +
The individual specific parameter vector isβˆi =
∑
Ss=1Hˆs i|βˆs (Kamakura and Russell 1989). H is the individual i ‘s probabilities of being class s. This formula will be used ˆs i|to estimate individual preference toward product attributes to help us to predictive the
purchase probability of any selected new or existing products.
Hierarchical Bayes Probit Model
The hierarchical Bayes approaches to modeling consumer heterogeneity have been
conducted over a wide range of marketing problems (e.g., Allenby and Ginter 1995;
Allenby, Arora, and Ginter 1998; Rossi and Allenby 2003). The model we will employ is
the hierarchical Bayes Probit model. Let to denote the specific choice made by
individual i in choice situation Ji,, x is a set of common product attributes, ij
y
yij =x'ijβ εi+ ij yij =0,1, i=1, 2,..., , n j=1, 2,...,Ji
i zi i
β = Γ + ζ
occasions of subject i. βi is a matrix of individualized preference coefficients, and Γ is a matrix of coefficients that relate βi to the value of , and is a vector of covariates that account for observed heterogeneity. In this study, the covariate includes
demographic variables (i.e., age, gender) and observed behavior variables in database (log
average purchase amount and frequency).
i
z zi
i
ζ is unobserved heterogeneity component, which is assumed to be multivariate normal distribution (Allenby and Ginter 1995). βi will be used in this study to estimate individual preference toward product attributes to
help us to predictive the purchase probability of any new products.