行政院國家科學委員會專題研究計畫 成果報告
影響綠色新產品開發成功因素的理論建構與實證研究─以
台灣地區電機電子產業為例
研究成果報告(精簡版)
計 畫 類 別 : 個別型 計 畫 編 號 : NSC 97-2410-H-151-007- 執 行 期 間 : 97 年 08 月 01 日至 98 年 07 月 31 日 執 行 單 位 : 國立高雄應用科技大學企業管理系 計 畫 主 持 人 : 黃義俊 計畫參與人員: 碩士班研究生-兼任助理人員:劉苑翠 碩士班研究生-兼任助理人員:林易詳 碩士班研究生-兼任助理人員:趙健宇 助教-兼任助理人員:邱妙惠 報 告 附 件 : 出席國際會議研究心得報告及發表論文 處 理 方 式 : 本計畫涉及專利或其他智慧財產權,2 年後可公開查詢中 華 民 國 98 年 10 月 31 日
行政院國家科學委員會補助專題研究計畫
■ 成 果 報 告
□期中進度報告
影響綠色新產品開發成功因素的理論建構與實證研究─
以台灣地區電機電子產業為例
The theory building and empirical research about the factors of affecting green
new product development on market success-The case of Electric and Electronic
Industries on Taiwan
計畫類別:■ 個別型計畫
□ 整合型計畫
計畫編號:
NSC
97-2410-H-151-007-執行期間:
97 年 8 月 1 日至 98 年 7 月 31 日
主
持
人:黃義俊 國立高雄應用科技大學企業管理系 副教授
計畫參與人員:邱妙惠 國立高雄應用科技大學企業管理系 助教
:林易詳 國立高雄應用科技大學企管系碩士生
:劉苑翠 國立高雄應用科技大學企管系碩士生
:趙健宇 國立高雄應用科技大學企管系碩士生
成果報告類型(依經費核定清單規定繳交):■精簡報告
□完整報告
本成果報告包括以下應繳交之附件:
■赴國外出差或研習心得報告一份
□赴大陸地區出差或研習心得報告一份
□出席國際學術會議心得報告及發表之論文各一份
□國際合作研究計畫國外研究報告書一份
處理方式:除產學合作研究計畫、提升產業技術及人才培育研究計畫、
列管計畫及下列情形者外,得立即公開查詢
□涉及專利或其他智慧財產權,□一年■二年後可公開查詢
執行單位:國立高雄應用科技大學企管系
中
華
民
國
九十八 年
十 月 三十 日
Abstract:
This article reports the findings on green new product (GNP) success in Taiwan electrical, electronics and information manufacturers. A major contribution of this article is the attempt to integrate innovation, new product development and environmental management philosophies in order to develop and empirically test a theoretical framework for organizational response (e.g., environmental policy and top management support, environmental benchmarking, R&D strength, cross-functional integration) and GNP success.
From 181 validate sample, the results show that most of the factors for organizational response have significant positive effect on GNP success. This research also found the family and non-family firms have different influence GNP success.
Keywords: organizational response, GNP success, family business, Taiwan.
1. Introduction
From strategic perspective, they can lead to a core competence that either differentiates a firm from its competitors (Prahalad and Hamel, 1990) or provides a threshold competency that is necessary just to survive in fast-changing and innovative industry sectors (McCarthy, Tsinopoulos, Allen and Rose-Anderssen, 2006). Depend on product development perspective, it is widely recognized that effective new product development (NPD) processes are key important in generating long-term firm success (Cooper, 1983; Ulrich and Eppinger, 1995; Wheelwright and Clark, 1995). In practical, after WEEE and RoHS were implemented, those will cause heavy influence on Taiwan electrical and electronic industries, meanwhile challenging the competence of green new product development (GNPD) for the firms on Taiwan. In academy, it was increasing more much consideration for integrating an environmental concern into the new product development (NDP) process to create the win-win paradigm. Therefore, it is worth further to study for the issues of green new product development (Berchicci and Bodewes, 2005; Pujari, et al., 2003; Pujari, 2006).
The most advanced environmental technologies and products will make no contribution to the pursuit of sustainability unless they can provideaviable‘green’productchoice and wrestle market share away from conventional products (Pujari et al., 2003). The failure rate of new products is somewhere between 40 and 75% (Stevens and Burley 2003). Given the high costs associated with new product development, minimization of the high failure rate is a topic of considerable theoretical and managerial interest. Commercial success of GNPD in the market place is crucial in helping move companies and society towards environmental sustainability.
Despite some studies have contributed obviously to our understanding of how firms can develop and implement green product development (Lenox and Ehrenfeld, 1997; Pujari and Wright, 1996), they tend to be rather conceptual, normative and perspective. Such studies have less emphasis on exploring and explaining the implications of incorporating environmental issues
into product development (Baumann et al., 2002; Lenox and Ehrenfeld, 1997). Reviewing the environmental related research, it was very few works to explore the success of GNPD as well as the influencing factors on success of GNPD. Moreover, the logic of the design-for-environment approach means that GNPD is not radically different process to conventional NPD, but involves adding a further level of complexity into the NPD process. However, prior research efforts appear to have few explicit links to mainstream new product development literature (Baumann et al., 2002, Berchicci and Bodewes, 2005; Pujari, 2006). Therefore, this study will integrate the mainstream literatures of environmental management and new product development to further explore the issue about success of GNPD.
Firstly, this study reviewed the literature of environmental management (Berchicci and Bodewes, 2005; Ehrenfeld and Lenox, 1997; Johansson, 2002; Pujari and Wright, 1996; Pujari, et al., 2003), and found that the factors influencing on performance of GNPD is organizational environmental action. But there is lack of research for success of GNPD. Therefore, this study reviewed the influencing factors on NPD success, there have been at least four meta-analytic studies that have reviewed and critically synthesized the existing work on NPD (Brown and Eisenhart, 1995; Henard and Szymanzki, 2001; Kessler and Chakarabarti, 1996; Montoya-Weiss and Calantone, 1994). Yet, the broader relationships of NPD success reported in these reviews were not consistent. All four reviews call for an integrated examination of broader and new factors that affect NPD success. Based on this reason, this study attempts to review the literature of innovation and new product development, the findings for influencing factors on NPD success included as the cross-functional integration, market knowledge and organizational factors.
Moreover, this study also found that the relationships were not consistent between the eco-performance and the financial performance of green new products from prior research (Ambec and Lanoie, 2008; Berry and Rondinelli, 1998; Bragdon and Marlin, 1972; Chen et al., 2006; Chen, 2008; Conrad and Morrison, 1989; Hart, 1995; Porter and van der Linde, 1995; Shrivastava, 1995c Spicer, 1978a, b). Therefore, it is worth further to examine the relationship between the eco-performance and the financial performance of green new products.
2. LITERATURE REVIEW
2.1 The Related Research of Green New Production Development
In response to increasing public interest in environmental issues, many companies have started designing products with green attributes. Chen (2001) described typical green attributes that are listed on various green consumer guides include recyclability, recycled content, fuel efficiency, toxic content reduction, and emission-related performance and others such as efficient packaging. Greening or ENPD itself is not a well defined concept (Chen, 2001). Pujari et al. (2003) defined GNPD as product development into which environmental issues are explicitly integrated in order to create one of the least environmentally harmful products a firm has recently produced. Berchicci and Bodewes (2005) argued GNPD is a general term, which encompasses a range of
issues, from the redesigning of existing products to the creation of new products and services driven by environmental concerns.
There are a number of studies have presented a better understanding of green new product development. Some studies uses success stories to demonstrate that aligning environmental issues with new product development can improve market performance (Baumann et al., 2002). Some research offers guidelines, manuals, tools and advice to engineers and managers to assistant them to integrate environmental concerns into the NPD process (Mackenzie, 1997). Third, a lot of papers were carried out to examine and identify factors that promote the adoption of GNPD (Johansson, 2002), such as the integration of environmental professionals (Ehrenfeld and Lenox, 1997), and top management support (Ehrenfeld and Lenox, 1997; Pujari et al., 2003) are considered crucial factors. Empirical studies have investigated in what ways firms have tried to engage in GNPD (Gutowski et al., 2005; Lenox et al., 2000).
Although these studies have increased our understanding of GNPD and contributed to the development of a systematic approach to dealing with environmental issues in product development, all but a few fail to draw on existing theoretical frameworks in NPD and organizational innovation literature (Baumann et al., 2002; Pujari et al., 2003). The logic of GNPD is not a radically different process to conventional NPD, but involves adding a further level of complexity into the NPD process. Therefore, this research builds up the theoretical framework by integrating the literature of innovation, NPD and environmental strategy.
2.2 The Green New Production Success
Product development is vitally important to firms competing in new and existing markets (Calantone et al., 1995). Moreover, the ability to commercialize products successfully is crucial for firms that want to compete in the marketplace (Griffin and Page, 1996). Paladino (2007) defined new product success as the ability of a green new product to avoid in the marketplace. Followed the definition of Paladino (2007), this research defined green new product success as the ability of a green new product to avoid in the marketplace.
There is considerable variance in term of what components new product success. Some studies consider new product outcomes, such as competitive advantage, quality or uniqueness (Li & Calantone, 1998; Song, and Montoya-Weiss, 2001), some examine market-based outcome, such as market share of profit (Atuahene-Gima, 1996b; Gatingnon & Xuereb, 1997) some investigate productivity-related outcomes, such as cycle time or production superiority and still others explore product-related outcomes, such as production innovation performance (Atuahene-Gima, 2005; Luca & Atuahene-Gima, 2007). New production studies typically capture success either an objective assessment (return on investment, sale, market share, profits) or a subjective assessment (manager’s perceptions of how well the new product performed related to expections) (Troy, Hirunyawipada & Paswan, 2008).
1994; Paladino, 2007) recommend, we used multiple measures of green new product success to assess different perspectives of green new product performance, including green production innovation performance (Chen et al., 2006) and financial performance (Clemens, 2006; Judge and Douglas, 1998). This study referred to the definition of Chen et al. (2006) and defined ‘‘green product innovation performance,’’as the performance in product innovation that is related to environmental innovation, including the innovation in product that are involved in energy-saving, pollution-prevention, waste recycling, no toxicity, or green product designs. Financial performance is the degree to which firms are more profitable than their competitors (Clemens, 2006; Judge and Douglas, 1998).
2.2 Antecedent variables- Organizational Response
Firstly, this study reviewed the literature of environmental management (Berchicci and Bodewes, 2005; Ehrenfeld and Lenox, 1997; Johansson, 2002; Pujari and Wright, 1996; Pujari, et al., 2003), and found that the factors influencing on performance of GNPD is organizational environmental action, such as top management support, environmental policy and environmental benchmarking. But there is lack of research for success of GNPD. Therefore, this study reviewed the influencing factors on NPD success, there have been at least four meta-analytic studies that have reviewed and critically synthesized the existing work on NPD (Brown and Eisenhart, 1995; Henard and Szymanzki, 2001; Kessler and Chakarabarti, 1996; Montoya-Weiss and Calantone, 1994). The literature has identified drivers of new product success including product (quality, features, benefits), industry (levels of competitive, environmental turbulences, and organizational (strategy, skills, structure, culture, knowledge) factors. Of the organizational factors studies, organizational action and cross-functional integration have been identified as two key drivers of new product success (Berchicci and Bodewes, 2005; Pujari, 2006; Troy, Hirunyawipada & Paswan, 2008).
We draw on prior research to identify specific organizational action and cross-functional integration that organizations can undertake to fulfill each of these requirements for success of GNPD. Each of these organizational actions, such as top environmental policy, management support, environmental benchmarking and R&D strength creates the necessary conditions for successful of GNPD to occur. However, we argue that not all organizations that undertake such actions are equally successful at fostering their green new product development projects. There seems to be general agreement that cross-functional integration (i.e., the degree of interaction, communication, information sharing, or coordination across functions) is important for successful new product development (Griffin & Hauser, 1996; Gupta, Raj & Wilemon, 1986; Olson, Walker and Ruekert, 1995). Subsequently, we will discuss more detail and then propose the research hypothesis.
(1) Environmental policy and top management support
environmental product strategy that is explicit, clearly defined, and linked into the overall strategy of the firm. An explicit product innovation strategy enables management to plan for, and make sufficient resources available for, specific product development (Gupta and Wilemon, 1990). When considering the product with regard to the environment, management needs to go beyond considering environmental impacts relating to product use or disposal (Pujari, Wright and Peattie, 2003). Environmental policy us an area where there is wide variance in levels of commitment. Moreover, corporations can view environmental investments as either an unfortunate cost of doing business or a source of competitive advantage (Miles and Covin, 2000).
The NPD process depends upon the willingness of top management to commit resources to new projects (Dwyer, 1990; Hegarty and Hoffman, 1990). Top management commitment and support (Banerjee, Iyer & Kashyap, 2003) is vital in GNPD in promoting and integration of environmental concerns with other functional areas of within NPD process (Pujari and Wright, 1996). The management support for environmental issues in NPD is likely to affect product performance due to the complexity of greening. Moreover, this process may even be more complex when a radical approach is encouraged. The research of Pujari, Wright and Peattie (2003) supported that top management support and involvement has a significant positive effect on firms’ eco-performance of GNPD. Therefore, this study proposes the following hypothesis:
Hypothesis 1.1: A higher extent of environmental policy and top management support for GNPD
will positively influence the level of green new product innovation performance.
Hypothesis 1.2: A higher extent of environmental policy and top management support for GNPD
will positively influence the level of financial performance of GNPD.
(2) Environmental benchmarking
Benchmarking is a market-based learning process by which a firm seeks to identify best practices that produce superior results in other firms and to replicate these to enhance its own competitive advantage (Camp, 1995; Mittelstaedt, 1992; Vorhies and Morgan, 2005). Vorhies and Morgan (2005) argued that the primary focus of benchmarking has move from the content of the product or services produced, the strategy pursued, and performance to process emphasize on the capabilities believed to have produced the superior performance. Benchmarking has been identified as a structured and continuous process that helps reduce core rigidity (Leonard-Barton, 1995), perceptual bias (Dickson, 1992), and satisficing problems (Winter, 2000).
In their research on NPD, Cooper and Kleinschmidt (1995) suggest that benchmarking (both internally and versus other firms) provides the insights necessary to identify the critical success factors that set the most successful firms apart from their competitors. Some companies are increasingly incorporating quantitative environmental data into their benchmarking activities as part of their efforts to improve environmental performance. In their research on GNPD, Pujari, Wright and Peattie (2003) found environmental benchmarking has a significant positive effect on
firms’eco-performance of GNPD. Therefore, this study proposes the following hypothesis:
Hypothesis 2.1: A higher level of environmental benchmarking positively influences green new
product innovation performance.
Hypothesis 2.2: A higher level of environmental benchmarking positively influences financial
performance of GNPD.
(3) R&D Strength
Research and development strength refers to a company’s resources and capacity for new technology development (Li and Calantone, 1998). Both the traditional economic paradigm and contemporary research on new product development assume that R&D strength has a positive impact on new product outcome. However, research findings are mixed. In the meta-analysis of 76 studies (Szymanski, Bharadwaj, and Varadarajan, 1993), the positive impact of R&D strength is not substantiated. In an investigation of 122 industrial firms, Cooper (1983) observes that R&D strength has a significant effect on a firm’s several differential advantages.
New product projects are born as ideas, move through screening, project definition and business analysis steps, and eventually go through product development. Proficient performance of these early upfront pre-development activities is one of the key factors of new product success (Cooper, 1988; Cooper and Kleinschmidt, 1987, 1993a). Clear project definition, good market analysis, and marketing research and sales forecasting to gain a clear understanding ofusers’ needs and wants are all crucial for successful new products (Cooper and Kleinschmidt, 1993a, b).
Product DFE is a design process in which a product’s environmentally preferable attributes—including recyclability, disassembly, maintainability, refurbishability and reusability—are treated as design objectives rather than as constraints (Ashley, 1993). LCA is an examination of consecutive and inter-linked stages of a product system, from raw material acquisition or generation of natural resources to final disposal (end-of-life). Creating greener products to address increasingly environmentally sensitive markets requires a significant investment in appropriate technologies and capabilities (Hutchinson, 1992). The research of Li & Calantone (1998) suggests R&D strength in a firm play a significant role in enhancing product advantage. Therefore, this study proposes the following hypothesis:
Hypothesis 3.1: A higher degree of R&D strength positively influences green new product
innovation performance.
Hypothesis 3.2: A higher degree of R&D strength positively influences financial performance of
GNPD.
(4) Cross-functional integration
Product development is a complex social process involving people from different backgrounds and management positions (Dougherty, 1992). To a large extent, the success of a product depends
on the effective communication and collaboration between the various members of the team (Cooper and Kleinschmidt, 1995a; Dougherty, 1992). Cross-functional integration has been identified as a key driver of new product success (Griffin & Hauser, 1996; Gupta, Raj & Wilemon, 1986; Olson, Walker & Reuker, 1995). Cross-functional integration typically involves facilitating communication among different functions (Gatingnon & Xuereb, 1997; Moenaert et al., 1994; Song, Montoya-Weiss & Schmidt, 1997; Troy, Hirunyawipada & Paswan, 2008). Song & Montoya-Weiss (2001) argued that cross-functional integration in new product development context as “the magnitude of interaction and communication, the level of information sharing, the degree of coordination, and the extent of joint involvement across functions in specific new product task.”In the meta-analysis of 146 correlations (Troy, Hirunyawipada & Paswan, 2008), they found that cross-functional integration have a direct impact on new product success. They also suggest explore the relationship cross-functional integration and new product success in different environment.
In the green research literature, Judge and Dogulas (1998) suggests the more that environmental issues are integrated into the various functional areas, the more that environmental issues will be integrated into the strategic planning process due to the superior cross-functional communication and information flow that exists.Based on this logic, it stands to reason that the more that environmental issues are incorporated into the strategic planning process, the better and more comprehensive is the information existing for top managers to care for the environment (Stead & Stead, 1995). Developing this capability of incorporating environmental issues in the planning process allows environmental champions to assert themselves (Winn, 1995). Fineman and Clarke (1996) demonstrated the importance of such champions in contributing to a firm's environmental actions. From the LISREL model, Judge and Dogulas (1998) found that level of integration of environmental issues into the strategic planning process was positively related to financial and environmental performance. Therefore, this study proposes the following hypothesis:
Hypothesis 4.1: A higher degree of cross-functional integration positively influences green new
product innovation performance.
Hypothesis 4.2: A higher degree of cross-functional integration positively influences financial
performance of GNPD.
2.3 Control Variables
In this research, we define a family firm as a business organization partially or completely owned by a family and at least one member of the family serves on the corporate board or is part of the top executive team. We then develop a two-step approach to identify family firms from our valid responses. Step one is to identify public companies from this group of 181 companies. All public companies in Taiwan are mandated by law to disclose family relationships between executives, directors, and shareholders who own more than 3% of equity in their prospectus and annual reports. This information is available to the public on the online portal of Taiwan Stock
Exchange. For private companies, we called the contact number of our respondents for the information on family ownership and family management. Eighty-six family firms were identified at the end. Therefore, this study proposes the following hypothesis:
Hypothesis 5.1: The green new product innovation performance family firms are higher
non-family firms.
Hypothesis 5.2: The financial performance non-family firms are higher family firms.
We also include the age and size of firms as control variables. The age is calculated as the difference between 2007 and the founding year of organization. As an organization grows older, organizational efforts to adopt new innovation may be hindered by organizational inertia (Egri and Herman, 2000). We control the size of firms because large organizations are more likely to have resources to adopt new innovations (Luca & Atuahene-Gima, 2007) and to take an active role in natural environmental management (Aragon-Correa, 1998).
2.4 The Relationship Green Product Innovation Performance and Financial Performance
Many studies have reported that both approaches of prevention improve the environmental operational performance (Berry & Rondinelli, 1998; Hart, 1995; Nehrt, 1998; Porter & van der Linde, 1995). Organizations can achieve better overall environmental performance and gain competitive edge through developing environmental techniques (Shrivastava, 1995). Roy (1999) showed that designing a greener product helps create new markets and increase or maintain market share on the basis of a study of 16 frims.
Chen, Lai, and Wen (2006) emphasized that firms investing many efforts in environmental management can not only avoid the trouble of protests or punishment about environmental protect, but also enable them to improve their corporate images, to increase their competitive advantages. Ambec and Lanoie (2008) reviewed 12 studies to examine the relationship between environmental performance and their financial performance through regression analysis. Nine studies showed that better environmental performance is associated with better economic performance. Therefore, this study proposes the following hypothesis:
Hypothesis 6: Green product innovation performance is positively associated with financial
performance
3. METHODOLOGY
3.1 Measure Development
Measures of the constructs were developed in several stages. In the first stage, based on the defined constructs, tentative measures were either borrowed or developed from the existing literature. In the second stage, to establish content validity, a list of defined construct and measure was submitted to a panel of seven marketing, R&D, environmental and engineering academicians who were identified as authorities on the subject of new product development. In the third stage, case study interviews were conducted for item refinement through five practices. Finally, we
pretested our questionnaire instrument to ensure that our questions were clearly understood and easily answerable by respondents. We arranged for a variety of respondents to complete our draft survey. These included environmental managers from 36 companies in our sample industries.
3.2 The Operationalization, Questionnaire and Scales
Most of construct were measured using seven-point Likert scale from 1 to 7 rating from strongly disagreement to strongly agreement. Size (control variable) was measured from the logarithm of the number of employees.
The questionnaire instrument comprised three parts. The first part of the questionnaire consisted of the descriptive data of companies (including the number of employees, year founded, industry sector, etc.); the second part is the measurement of organizational environmental action; the third part is the measurement of successful green new product development. The definitions and measurements of the constructs were further defined, as follows.
Dependent Variable
Green new product success: Green new product success refers to the ability of a green new
product to avoid in the marketplace. As new product strategy researches (Im & Workman Jr., 2004; Montoya-Weiss & Calantone, 1994; Paladino, 2007) recommend, we used multiple measures of green new product success to assess different perspectives of green new product performance, including green production innovation performance (Chen et al., 2006) and financial performance (Clemens, 2006; Judge and Douglas, 1998).
Green product innovation performance
This study referred to the definition of Chen et al. (2006) and defined ‘‘green product innovation performance,’’as the performance in product innovation that is related to environmental innovation, including the innovation in product that are involved in energy-saving, pollution-prevention, waste recycling, no toxicity, or green product designs. The measurement of green product innovation performance included four items: (1) The company chooses the materials of the product that produce the least amount of pollution for conducting the product development or design; (2) the company chooses the materials of the product that consume the least amount of energy and resources for conducting the product development or design; (3) the company uses the fewest amount of materials to comprise the product for conducting the product development or design; (4) the company would circumspectly deliberate, whether the product is easy to recycle, reuse, and decompose for conducting the product development or design (Chen et al., 2006).
Financial performance
Financial performance is the degree to which firms are more profitable than their competitors (Clemens, 2006; Judge and Douglas, 1998). The financial performance was measured using a four-item scale. The items were developed from prior research in natural environmental issues (Judge and Douglas, 1998). Measuring perceived financial performance has been used
successfully in the literature (Covin et al., 1994; Dess, 1987; Miller and Friesen, 1994).
Independent Variable
Environmental policy and top management support
We followed the research of Hegarty and Hoffman (1990) and Pujari, Wright and Peattie (2003) to define environmental policy as a green product strategy that is explicit, clearly defined, and linked into the overall strategy of the firm. We measured environmental policy as the respondent’s perception of environmental policy for green new product development. The environmental policy was measured using a four-item scale. The items were developed from prior research in green new product development (Pujari, Wright and Peattie, 2003). Moreover, we measured top management support as the respondent’s perception of top management’s environmental support for green new product development. The top management support was measured using a two-item scale. The items were developed from prior research in green new product development ( Pujari, Wright and Peattie, 2003).
Environmental benchmarking: Benchmarking is a firm seeks to identify best practices that
produce superior results in other firms and to replicate these to enhance its own competitive advantage (Camp, 1995; Mittelstaedt, 1992; Vorhies and Morgan, 2005). Environmental benchmarking was measured by five items, The items were developed from prior research in green new product development ( Pujari, Wright and Peattie, 2003).
R&D Strength: Research and development strength refers to a company’s resources and capacity for green new technology development. Research and development strength was measured by three items. The first was the R&D expenditure in dollars relative to sales. The next two items asked the respondent to assess the strength of the company’s R&D investment and proprietary technology relative to its largest competitor’s (Li and Calantone, 1998).
Cross-functional integration: Cross-functional integration is defined as the degree of interaction,
communication, information sharing, or coordination across functions (Song & Montoya-Weiss, 2001; Troy, Hirunyawipada & Paswan, 2008). The cross-functional integration was measured using an eight-item scale. The items were modified from prior research in new product development (Gupta, Rja and Wilemon, 1986; Moenaert and Souder, 1990). We focus on the extent of behavioral activities of marketing-R&D-environmental communication and cooperation for green new product development project.
3.3 Sample and Data Collection
We sent 1000 questionnaire to Taiwanese electrical, electronics and information companies in late 2006 (October 13 and November 4). The respondents of the questionnaires are the CEOs or the managers of environmental protection, marketing, or R&D departments were asked to return the completed questionnaires within 2 weeks through mailing. We received 188 responses, 181 were considered valid and usable. From our total sample of 1000 facilities, this 18.1 percent
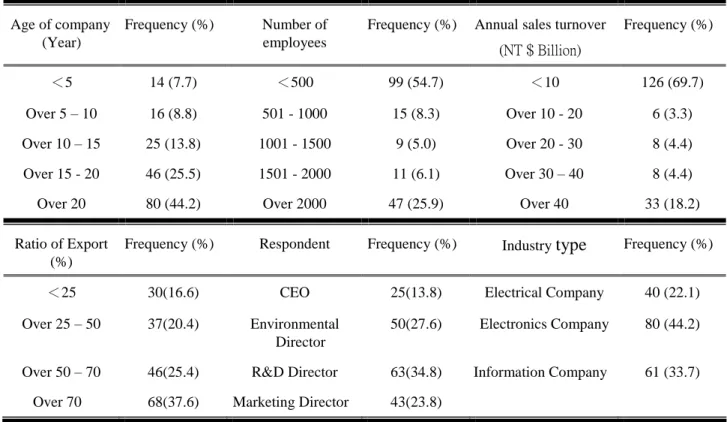
response rate is comparable to other recent survey-based strategy research (Delmas & Toffel, 2008; Hoskisson et al., 2004; McEvily and Chakravarthy, 2002; Slater and Olson, 2001). Table 1 shows the summary statistics of the sample.
Firm size (sales turnover), number of employees, and industry type were chosen as demographic variables for checking differences between respondents and nonrespondents. No significant differences were found between respondents and nonrespondents. Further, t tests were applied between a sample of early responses and very late responses. The results did not provide significant differences on most of the variables.
Table 1 Summary statistics of sample (n= 181) Age of company
(Year)
Frequency (%) Number of employees
Frequency (%) Annual sales turnover (NT$Billion) Frequency (%) <5 14 (7.7) <500 99 (54.7) <10 126 (69.7) Over 5 –10 16 (8.8) 501 - 1000 15 (8.3) Over 10 - 20 6 (3.3) Over 10 –15 25 (13.8) 1001 - 1500 9 (5.0) Over 20 - 30 8 (4.4) Over 15 - 20 46 (25.5) 1501 - 2000 11 (6.1) Over 30 –40 8 (4.4)
Over 20 80 (44.2) Over 2000 47 (25.9) Over 40 33 (18.2)
Ratio of Export (%)
Frequency (%) Respondent Frequency (%) Industrytype Frequency (%)
<25 30(16.6) CEO 25(13.8) Electrical Company 40 (22.1)
Over 25 –50 37(20.4) Environmental Director
50(27.6) Electronics Company 80 (44.2)
Over 50 –70 46(25.4) R&D Director 63(34.8) Information Company 61 (33.7) Over 70 68(37.6) Marketing Director 43(23.8)
4. DATA ANALYSIS
4.1 Scale properties- organizational response
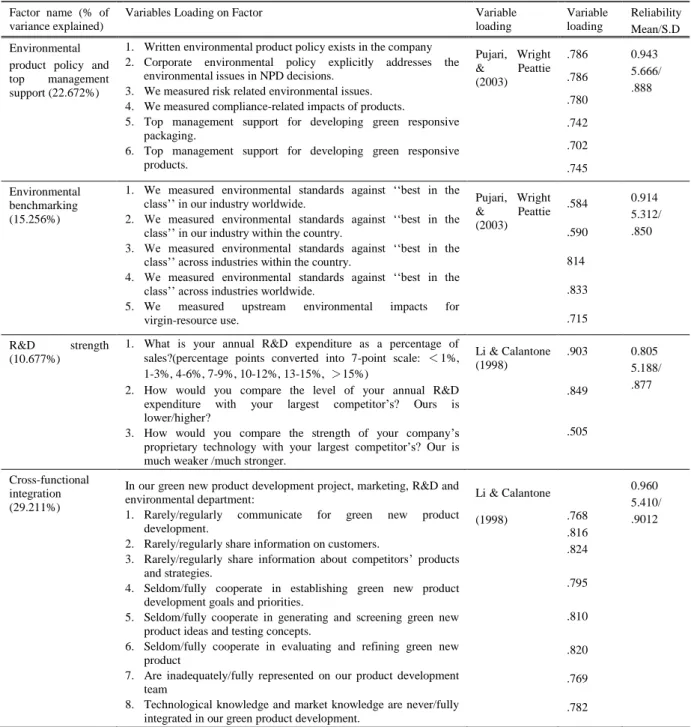
In order to avoid common method bias, the exploratory factor analysis was performed on independent variables using principle component analysis (varimax method). Table 2 shows the factor analysis results. The results show four factors with eigenvalues greater than one, accounting for 77.806% of the variance (K-M-O statistic 0.928; Barlett statistic 4149.717, significance 0.000). An analysis of Screen plot also shows a four-factor solution namely environmental product policy and top management support, Environmental benchmarking, R&D strength, Cross-functional integration. The reliability of these factors is measured using Cronbach’salpha, the result shows all over 0.7 (Churchill, 1979), see Table 2. The mean and standard deviation also presented in Table 2.
4.2 Scale properties- ENP success
An exploratory factor analysis was performed on all eight ENP success variables, using principle component analysis (varimax method). Table 3 shows the factor analysis results. The results show four factors with eigenvalues greater than one, accounting for 84.570% of the variance (K-M-O statistic 0.824; Barlett statistic 1033.793, significance 0.000). An analysis of Screen plot also shows a four-factor solution namely Green product innovation performance, financial performance. The reliability of these factors is measured using Cronbach’salpha, the result shows all over 0.7 (Churchill, 1979), see Table 3. The mean and standard deviation also presented in Table 3.
Table 2 Factor analysis for organizational response
Factor name (% of variance explained)
Variables Loading on Factor Variable
loading Variable loading Reliability Mean/S.D Environmental
product policy and top management support (22.672%)
1. Written environmental product policy exists in the company 2. Corporate environmental policy explicitly addresses the
environmental issues in NPD decisions. 3. We measured risk related environmental issues. 4. We measured compliance-related impacts of products.
5. Top management support for developing green responsive packaging.
6. Top management support for developing green responsive products. Pujari, Wright & Peattie (2003) .786 .786 .780 .742 .702 .745 0.943 5.666/ .888 Environmental benchmarking (15.256%)
1. We measured environmental standards against ‘‘best in the class’’in ourindustry worldwide.
2. We measured environmental standards against ‘‘best in the class’’in ourindustry within thecountry.
3. We measured environmental standards against ‘‘best in the class’’acrossindustries within the country.
4. We measured environmental standards against ‘‘best in the class’’acrossindustriesworldwide.
5. We measured upstream environmental impacts for virgin-resource use. Pujari, Wright & Peattie (2003) .584 .590 814 .833 .715 0.914 5.312/ .850 R&D strength (10.677%)
1. What is your annual R&D expenditure as a percentage of sales?(percentage points converted into 7-point scale: < 1%, 1-3%, 4-6%, 7-9%, 10-12%, 13-15%, >15%)
2. How would you compare the level of your annual R&D expenditure with your largest competitor’s? Ours is lower/higher?
3. How would you compare the strength of your company’s proprietary technology with your largest competitor’s? Our is much weaker /much stronger.
Li & Calantone (1998) .903 .849 .505 0.805 5.188/ .877 Cross-functional integration (29.211%)
In our green new product development project, marketing, R&D and environmental department:
1. Rarely/regularly communicate for green new product development.
2. Rarely/regularly share information on customers.
3. Rarely/regularly share information about competitors’products and strategies.
4. Seldom/fully cooperate in establishing green new product development goals and priorities.
5. Seldom/fully cooperate in generating and screening green new product ideas and testing concepts.
6. Seldom/fully cooperate in evaluating and refining green new product
7. Are inadequately/fully represented on our product development team
8. Technological knowledge and market knowledge are never/fully integrated in our green product development.
Li & Calantone (1998) .768 .816 .824 .795 .810 .820 .769 .782 0.960 5.410/ .9012
Table3 Factor analysis for Successful of GNPD
Factor name (% of variance explained)
Variables Loading on Factor Selected sources
Variable loading
Reliability Mean/S.D. 1. Green product innovation
performance (17.21%)
1. The company chooses the materials of the product that produce the least amount of pollution for conducting the product development or design
2. The company chooses the materials of the product that consume the least amount of energy and resources for conducting the product development or design
3. The company uses the fewest amount of materials to comprise the product for conducting the product development or design
4. The company would circumspectly deliberate, whether the product is easy to recycle, reuse, and decompose for conducting the product development or design
Chen, Lai & Wen, (2006) 0.907 0.880 0.810 0.797 0.886 5.649/ .935 2. Financial performance (67.36%)
1. As compared to yours competitors, your GNPD project’s return on investment has been .
2. As compared to yours competitors, your GNPD project’s growth in earning has been .
3. As compared to yours competitors, your GNPD project’s sales growth has been .
4. As compared to yours competitors, your GNPD project’s market share change has been .
Judge and Douglas (1998) 0.695 0.885 0.941 0.852 0.902 5.166/ 1.076
4.3 The result of regression analysis
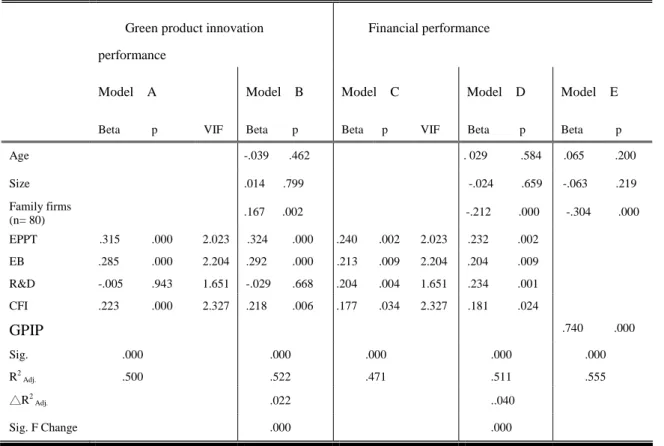
In this study, hierarchical regression method (Cohen and Cohen, 1983) is applied for specifying regression models (see Table 4). The issue of multicollinearity in regression analysis was resolved because factor analyses were run with varimax method and meeting the requirements of the tolerance value and variance inflation factor measures (Hair et al., 1998).
Influence to green product innovation performance
In term of the green product innovation performance, the results of the regression analysis in this study were showed in Table 4, Model A. The results showed that environmental policy and top management, Environmental benchmarking as well as cross-functional integration significantly positively influences green new product innovation performance. But R&D strength was not significantly influences green new product innovation performance. Therefore, H1.1, H2.1, H4.1 were supported in this study. But H3.1 was not support.
We also used family firms as control variables. We introduced a dummy variable in which family firms are coded 1 (n=80) and the non-family firms are coded 0 (n=101). In Table 4, Model B shows that the family firm has significant positive influence on green new product innovation performance. The green new product innovation performance family firms are higher non-family firms. H5.1 was support.
We also include the age and size of firms as control variables. In Table 4, Model B shows that the age and size of firm have not significant influence on green new product innovation performance.
Influence to financial performance
showed in Table 4, Model C. The results showed that environmental policy and top management, Environmental benchmarking, R&D strength as well as cross-functional integration significantly positively influence financial performance. Therefore, H1.2, H2.2, H3.2, H4.2 were supported in this study.
We also used family firms as control variables. We introduced a dummy variable in which family firms are coded 1 (n=80) and the non-family firms are coded 0 (n=101). In Table 4, Model D shows that the family firm has significant positive influence on green new product innovation performance. The financial performance non-family firms are higher family firms. H5.2 was support.
We also include the age and size of firms as control variables. In Table 4, Model B shows that the age and size of firm have not significant influence on financial performance.
The relationship between green product innovation performance and financial performance
We also test the relationship between green product innovation performance and financial performance, the result of the regression analysis in this study was showed in Table 4, Model E. Green product innovation performance is significantly positive effect on financial performance. Therefore, H6 was support.
Table 4 GNPD success: results from regression analysis
Green product innovation performance
Financial performance
Model A Model B Model C Model D Model E
Beta p VIF Beta p Beta p VIF Beta p Beta p
Age -.039 .462 . 029 .584 .065 .200 Size .014 .799 -.024 .659 -.063 .219 Family firms (n= 80) .167 .002 -.212 .000 -.304 .000 EPPT .315 .000 2.023 .324 .000 .240 .002 2.023 .232 .002 EB .285 .000 2.204 .292 .000 .213 .009 2.204 .204 .009 R&D -.005 .943 1.651 -.029 .668 .204 .004 1.651 .234 .001 CFI .223 .000 2.327 .218 .006 .177 .034 2.327 .181 .024 GPIP .740 .000 Sig. .000 .000 .000 .000 .000 R2 Adj. .500 .522 .471 .511 .555 △R2 Adj. .022 ..040 Sig. F Change .000 .000 n=181
EPPT: Environmental product policy and top management support, EB: Environmental benchmarking,
R&D: R&D strength,
CFI: Cross-functional integration
5. Discussion
This study summarized the literature on environmental management and innovation into a new managerial framework from new product development competence view. Our research contributes to the literature on organizational responsible in green new product (GNP) success in four ways: (1) by developing a formal construct that captures the defining characteristics of the GNP success; meanwhile, this research divided the GNP success into two dimensions, i.e., green production innovation performance and financial performance (2) by identifying the antecedents of GNP success; and (3) by family and non-family firms as control variable of GNP success (4) by providing a large-scale empirical test of our proposed research model.
Our finding that organizational response enhances green new product success. The empirical results of this study showed that environmental policy and top management support, environmental benchmarking, cross-functional integration had positive effects on their green product innovation performance. Also, this study showed that environmental policy and top management support, environmental benchmarking, R&D strength, cross-functional integration had positive effects on financial performance. Meanwhile, green product innovation performance had positive effects on financial performance. Moreover, this research found the family and non-family firms have different influence GNP success. The green new product innovation performance family firms are higher non-family firms. The financial performance non-family firms are higher family firms.
Because we previously discussed the rationale for the hypotheses that were supported, we focus our attention here on the hypotheses (H3.1) that were not supported, namely, R&D strength was not significantly influences green new product innovation performance. This finding meets the research of Chen (2008) argued that most of Taiwanese companies are SMEs which have few resources to deploy and green innovation.
Managerial Implications
On the basis of our research results, we identify specific actions that both top management support and environmental benchmarking must implement for green new product development to occur. For top management, our results underscore the importance of top management commitment and support is vital in GNPD in promoting and integration of environmental concerns with other functional areas of within NPD process. In addition, our results point to the importance of successful GNPD needs to be underpinned by an environmental product strategy that is explicit, clearly defined, and linked into the overall strategy of the firm.
For new product development project managers, our results point to the importance of environmental benchmarking, because environmental benchmarking is a market-based learning process by which a firm seeks to identify best practices that produce superior results in other firms and to replicate these to enhance its own competitive advantage. Furthermore, our results emphasize the importance of cross-functional integration, because GNPD is a complex social process involving people from different backgrounds and management positions, cross-functional integration can facilitate communication and collaboration among different functions.
Limitation and Future Research Directions
This study verified hypotheses with a questionnaire survey, only providing cross-sectional data. A longitudinal research design is necessary to validate these claims of causality. Furthermore, because respondents provided data on both the independent and the dependent variables, there is the possibility that the correlations are inflated as a result of single-source bias. The results of Harman’sone-factor test (Podsakoff and Organ 1986) enabled us to rule out single-source bias. However, the fact remains that data collected from multiple sources (e.g., senior management, organizational employees) would have provided a stronger test of the model. This study is focused on the information and electronics industry in Taiwan, so the further studies can focus on other industries or countries and compare with this study. This study is focused on internal factors, such as organizational response, further research should (1) identify the external factors, such as external factors and (2) study how market knowledge competence influence on green new product development and success.
Reference:
Ambec, S., & Lanoie, P. 2008. Does it pay be green? A systematic overview. Academy of
Management Perspectives, November: 45-62.
Aragon-Correa, J. A. 1998. Strategic proactivity and firm approach to the natural environment.
Academy of Management Journal, 41(5): 556-567.
Ashley, S. 1993. Designing for the environment. Mechanical Engineering, 115(3): 52–54. Atuahene-Gima, K. 2005. Resolving capability-rigidity paradox in new product innovation.
Journal of Marketing, 69: 61-83.
Atuahene-Gima, K. 1996. Differential potency of factors affecting innovation performance in manufacturing and service firms in Australia. The Journal of Product Innovation
Management, 13(1): 35-52.
Banerjee, S. B., Iyer, E. S., & Kashyap, R. K. 2003. Corporate environmentalism: Antecedents and influence of industry type. Journal of Marketing, 67(April): 106-122.
Bauman, H., Boons, F., & Bragd, A. 2002. Mapping the green product development field: engineering, policy and business perspectives. Journal of Cleaner Production, 10: 409-425. Berchicci, L., & Bodewes, W. 2005. Bridging environmental issues with new product
development. Business Strategy and Environment, 14: 272-285.
Berry, M. A., & Rondinelli, D. A. 1998. Proactive corporate environmental management: A new industrial revolution. Academy of Management Executive, 12(2): 38-50.
Bragdon, J., & Marlin, J. 1972. Is pollution profitable? Risk Management, April: 9-18.
Brown, S. L., & Eisenhardt, K. M. 1995. Product development-past research, present findings, and future-directions. Academy of Management Review, 20(2): 343-378.
Calantone, R. J., Vickery, S. K., & Droge, C. 1995. Business performance and strategic new product development activities: An empirical investigation. Journal of Product Innovation
Management, 12(3): 214-223.
Camp, R. C. 1995. Business process benchmarking: Finding and implementing best practices. Milwaukee, WI: ASQC Quality Press.
Chen, C. L. 2001. Design for the environment: A quality-based model for green product development. Management Science, 47(2): 250-263.
Chen, Y. S. 2008. The driver of green innovation and green image–Green core competence.
Chen, Y. S., Lai, S. B., & Wen, C. T. 2006. The influence of green innovation performance on corporate advantage in Taiwan. Journal of Business Ethics, 67(4): 331-339.
Churchill, G. A. Jr. 1979. A paradigm for developing better measures of marketing construct.
Journal of Marketing, 16 (February): 64-73.
Clemens, B. 2006. Economic incentives and small firms: Does it pay to be green? Journal of
Business, 59: 492-500.
Cohen, J., & Cohen, P. 1983. Applied multiple regression/correlation analysis for the behavioral
sciences. Hillsdale, NJ: Lawrence Erlbaum Associates, Publishers.
Conrad, K., & Morrison, C. 1989. The impact of pollution abatement investment on productivity change: An empirical comparison of the U. S. Germany and Canada. Southern Economics
Journal, 684-689.
Conway, S., & Steward, F. 1998. Networks and interfaces in environmental innovation: A comparative study in the UK and Germany. Journal of High Technology Management
Research, 2: 239-254.
Cooper, R. G. 1983. The impact of new product strategies. Industrial Marketing Management, 12: 243-56.
Cooper, R. G. 1988. Predevelopment activities determine new product success. Industrial Marketing Management, 17: 237-247.
Cooper, R. G. 1993. Winning at new products, Reading, MA: Addison Wesley.
Cooper, R. G., & Kleinschmidt, E. J. 1987. New products: What separates winners from losers?
Journal of Product and Innovation Management, 4(3): 169-184.
Cooper, R. G., & Kleinschmidt, E. J., 1993a. Stage gate systems for new product success.
Marketing Management, 1 (4): 20–29.
Cooper, R. G., & Kleinschmidt, E. J., 1993b. Screening new products for potential winners. Long
Range Planning, 26 (6): 4–81.
Cooper, R. G., & Kleinschmidt, E. J. 1995. Benchmarking the firm's critical success factors in new product development. The Journal of Product Innovation Management, 12(5): 374-31.
Covin, J., Slevin, D., & Schulz, R. 1994. Implementing strategic missions: Effective strategic, structural and tactical choices. Academy of Management Journal, 31: 418-505.
De Luca, L. M., & Atuahene-Gima, K. 2007. Market knowledge dimensions and cross-functional collaboration: Examining the different routes to product innovation performance. Journal of
Marketing, 71 (January): 95-112.
Delmas, M. A., & Toffel, M. W. 2008. Organizational responses to environmental demands: opening the black box. Strategic Management Journal, 29: 1027–1055.
Dess, G. 1987. Consensus on strategy formulation and organizational performance. Strategic
Management Journal, 8: 259–277.
Dickson, P. R. 1992, Toward a general theory of competitive rationality. Journal of Marketing, 56 (January): 69-83.
Dougherty, D. 1992. Interpretive barriers to successful product innovation in large firms.
Organization Science, 3(2): 179-202.
Dwyer, L. M. 1990. Factors affecting the proficient management of product innovation.
International Journal of Technology Management, 5(6): 721-730.
Egri, C. P., & Herman, S. 2000. Leadership in the North American Environmental Sector: Values, leadership styles, and contexts of environmental leaders and their organizations. Academy of
Management Journal, 43(4): 571-604.
Ehrenfeld, J., & Lenox, M. J. 1997. The Development and implementation of DFE program.
Journal of Sustainable product Design, April: 17-27.
Fineman, S, & Clarke, K. 1996. Green stakeholders: Industry interpretations and response.
Journal of Management Studies, 33(6): 715-730.
performance. Journal of Marketing Research, 34: 77-90.
Griffin, A. & Hauser, J. R. 1996. Integrating R&D and marketing: A review and analysis of the literature. Journal of Product Innovation Management, 13: 191-215.
Griffin, A., & Page, A. L. 1996. PDMA success measurement project recommended measures for product development success and failure. Journal of product Innovation Management, 13(6): 478-496.
Gupta, A. K., & Wilemon, D. 1990. Improving R&D/marketing relations: R&D's perspective.
R&D Management, 20(4): 277-290.
Gupta, A. K., Raj, S. P., & Wilemon, D. L. 1986. A model for studying R&D-marketing interface in the product innovation process. Journal of Marketing, 50(12): 7-17.
Gutowski, T., Murphy, C., Allen. D., Bauer, D., Bras, B., Piwonka, T., Sheng, P., Sutherland, J., Thurston, D., & Wolff, E. 2005. Environmentally benign manufacturing; observations from Japan, Europe and the United States. Journal of Cleaner Production, 13(1): 1-17.
Hair, J. F., Anderson, R. E., Tatham, R. L., & Black, W. C. 1998. Multivariate data analysis with
reading. 5thed., Upper Saddle River, NJ: Prentice Hall.
Hart, S. L. 1995. A natural resource based view of the firm. Academy of Management Review, 20: 986-1014.
Hegarty, W. H., & Hoffman, R. C. 1990. Product/market innovations: A study of top management involvement among four cultures. The Journal of Product Innovation
Management, 7(3): 186-199.
Henard, D. H., & Szymanski, D. M. 2001. Why some new products are more successful than others. Journal of Marketing Research, 38: 362-375.
Hoskisson, R. E., Cannella, A. A. Jr, Tihanyi, L., & Faraci, R. 2004. Asset restructuring and business group affiliation in French civil law countries. Strategic Management Journal, 25(6): 525–539.
Hutchinson, C. 1992. Corporate strategy and the environment. Long Range Planning, 25(4): 9-21.
Im, S., & Workman, Jr., J. P. 2004. Market orientation, creativity, and new product performance in High-technology firms. Journal of Marketing, 68: 114-132.
Johansson, G. 2002. Success factors for integration of ecodesign in product development.
Environmental Management and Health, 13(1): 98-107.
Judge, Jr. W. Q., & Douglas, T. D. 1998. Performance implications of incorporating natural environmental issues into strategic planning process: An empirical assessment. Journal of
Management Studies, 35(2): 241-262.
Kessler, E. H., & Chakrabarti, A. K. 1996. Innovation speed: A conceptual model of context, antecedents and outcomes. Academy of Management Review, 21: 1143-1191.
Lee, Y. C., & Ma, T. 2006. The study of the cost of debt financing of Taiwan's family firms.
Management Review, 25(3): 69–91.
Lenox, M, King, A., & Ehrenfeld, J. 2000. An assessment of design-for-environment practices in leading US electronics firms. Interfaces, 30(3): 83-94.
Lenox, M. J., & Ehrenfeld, J. 1997. Organizing for effective environmental design. Business
Strategy and the Environment, 6: 187-196.
Leonard-Barton, D. 1995. Wellsprings of knowledge: Building and sustaining the sources of
innovation. Cambridge, MA: Harvard Business School Press.
Li, T., & Calantone, R. J. 1998. The impact of market knowledge competence on new product advantage: Conceptualization and empirical examination, Journal of Marketing, 62: 13-29. Mackenzie, D. 1997. Green design: Design for the environment, London: Laurence King.
McCarthy, I. P., Tsinopoulos, C., Allen, P., & Rose-Anderssen, C. 2006. New product development as a complex adaptive system of decisions. The Journal of Production
Innovation Management, 23: 106-116.
empirical test for product performance and technological knowledge. Strategic Management
Journal, 23(4): 285–305.
Miles, M. P., & Covin, J. G. 2000. Environmental marketing: A source of reputational, competitive, and financial advantage. Journal of Business Ethic, 23: 299-311.
Miller, C. C., & Friesen, P. H. 1994. Strategic planning and firm performance: A synthesis of more than two decades of research. Academy of Management Journal, 37: 1649-1665.
Mittelstaedt, R. J. Jr. 1992. Benchmarking: How to learn from best in class practices. National
Productivity Review, 11(3): 301-315.
Moenaert, R. K. and Souder, W. E. 1990. An information transfer model for integrating marketing and R&D personnel in new product development projects. Journal of Product Innovation
Management, 7: 97-107.
Montoya-Weiss, M. M., & Calantone, R. J. 1994. Determinants of new product performance: A review and meta analysis. Journal of Product Innovation Management, 11(5): 397-417. Nehrt, C. 1998. Maintainability of first mover advantages when environmental regulations differ
between countries. Academy of Management Review, 23: 77-97.
Olson, E. M., Walker Jr., O. C., & Reuker, R. W. 1995. Organizing for effect new product development: The moderating role of new product innovativeness. Journal of Marketing, 59: 31-45.
Paladino, A. 2007. Investigating the drivers of innovation and new product success: A comparison of strategic orientations, Journal of Product Innovation Management, 24: 534-553.
Podsakoff, P. M., & Organ, D. W. 1986. Self-reports in organizational research: Problems and prospects. Journal of Management, 12(4): 531-544.
Porter, M. E., & van der Linde, V. C. 1995. Green and competitive, Harvard Business Review, September-October: 120-134.
Prahalad, C. K., & Hamel, G. 1990. The core competence of the corporation, Harvard Business
Review, 68(3): 79-91.
Pujari, D. 2006. Eco-innovation and new product development: understanding the inferences on market performance. Technovation, 26: 76-85.
Pujari, D., & Wright, G. 1996. Developing environmentally conscious product strategies: A qualitative study of selected companies in Germany and Britain. Marketing Intelligence and
Planning, 14(1): 19-28..
Pujari, D., Wright, G., & Peattie, K. 2003. Green and competitive: Influences on environmental new product development performance. Journal of Business Research, 56(8): 657.
Roy, R. 1999. Designing and marketing greener products: The Hoover case. In Greener
Marketing: A global perspective to Green Marketing Practice, 2nd ed., Charter, M. & Polonsky, M. J. eds. Sheffield, UK: Greenleaf Publishing: 126-142.
Shrivastava, P. 1995a. Environmental technologies and competitive advantage. Strategic
Management Journal, 16: 183-200.
Shrivastava, P. 1995b, The role of corporations in achieving ecological sustainability. Academy
Management Review, 20(4): 936-960.
Slater, S. F., Olson, E. M. 2001. Marketing’s contribution to the implementation of business strategy: an empirical analysis. Strategic Management Journal, 22(11): 1055–1067.
Song, X. M., & Montoya-Weiss, M. M. 2001. The effect of perceived technological uncertainty on Japanese new product development. Academy of Management Journal, 44: 61-80.
Song, X. M., Montoya-Weiss, M. M., & Schmidt, J. B. 1997. Antecedents and consequences of cross-functional cooperation: A comparison of R&D, manufacturing, and marketing perspectives. Journal of Product Innovation Management, 14: 35-47.
Spicer, B. H. 1978a. Investors corporate social performance and information disclosure: An empirical study. Accounting Review, 53: 94-111.
Spicer, B. H. 1978b. Market risk, accounting data and companies pollution control records.
Stead, W. E., & Stead, J. G. 1995. An empirical investigation of sustainability Strategy implementation in industrial organizations. In Collins, D. and Starik, M. eds., Research in
Corporate Social Performance and Policy-Sustaining the Natural Environment: Empirical Studies on the Interface Between Nature and Organizations, Greenwich, CT: JAI Press,
43-66.
Stevens, G. A., Burley, J. 2003. Piloting the rocket of radical innovation. Research Technology
Management, 46(2): 16-25.
Szymanski, D. M., Sundar G. B., & Varadarajan P. R. 1993. An analysis of the market share profitability relationship. Journal of Marketing, 57(3): 1-18.
Troy, L. C., Hirunyawipada, T. & Paswan, A. K. 2008. Cross-functional integration and new product success: An empirical investigation of the findings. Journal of Marketing, 72: 132-146.
Ulrich, K., & Eppinger, S. 1995. Product design and development. New York: McGraw-Hill Inc. Vorhies, D. W., & Morgan, N. A. 2005. Benchmarking marketing capabilities for sustainable
competitive advantage. Journal of Marketing, 69: 80-94.
Wheelwright, S., & Clark, K. 1995, Leading product development. New York: Free Press.
Winn, M. 1995. Corporate leadership and policies for the natural environment. In Collins D. and Stark, M.(Eds.), Research in Corporate Social Performance and Policy, Supplement 1:127-161. Greenwich, CT: JAI Press.
Winter, S. G. 2000. The satisficing principle in capability learning. Strategic management
出席國際學術會議心得報告
計畫編號 NSC 97-2410-H-151-007-計畫名稱 影響綠色新產品開發成功因素的理論建構與實證研究─ 以台灣地區電機電子產業為例 出國人員姓名 服務機關及職稱 黃義俊 國立高雄應用科技大學企業管理系 副教授會議時間地點 at Anaheim, California ㄝ U.S., August 8-13, 2008. 會議名稱 Academy of Management 2008 Annual Meeting
發表論文題目 Stakeholder Pressure and Voluntary Eco-innovation Adoption in Emerging Economy (此為 NSC 97-2410-H-151-007-的部分研究成果) 一、參加會議經過 1. 主辦單位:2008 年管理學術年會。 2. 會議屆數:第 68 屆管理學術會議。 3. 時間:2008 年 8 月 8~13 日。 4. 地點:美國加州阿納漢 (Anaheim, California)。 5. 研討會主題:「環保創新」。
6. 本人發表的論文主題為 “Stakeholder Pressure and Voluntary
Eco-innovation Adoption in Emerging Economy”即「新興經濟體的利害相關
人壓力與自願生態創新的採行」,主要探討台灣地區產業利害相關人對 生態創新採行的影響,獲得與會人員高度的好評與興趣。 二、與會心得 1. 管理學術年會已有 68 屆,是管理學界相當高水準的研討會。 2. 管理學術年會的主題包括:組織、策略與創業等議題。 3. 能夠參加此種高水準的研討會,除了可以了解管理研究的趨勢,同時與 世界級的大師互動對本人的學術研究有某種程度的幫助。 4. 研討會所發表的論文,如附。
Stakeholder Pressure and Voluntary Eco-innovation Adoption in
Emerging Economy
ABSTRACT
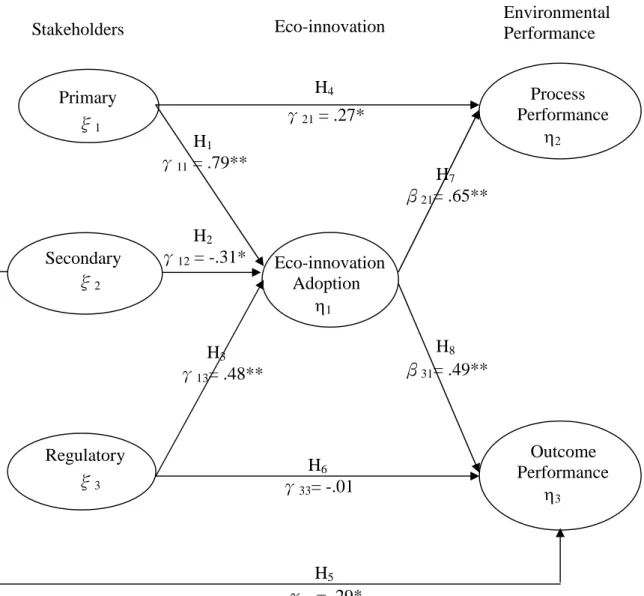
Drawing on the stakeholders, eco-innovation and environmental performance, this study builds up a comprehensive model to examine the relationships between this research’s constructs. Based on a survey of 230 Taiwanese companies, we used structural equation modeling (SEM) technique to test the relationships between stakeholder pressures and eco-innovation adoption and its impact on corporate environmental and business performances. The results of our paper present that primary and regulatory stakeholders are positive influence eco-innovative adoptions. Moreover, primary and secondary stakeholders are positive effect environmental performance. Finally, the results show the eco-innovative adoptions are positive impact on environmental performance.
Keywords: Stakeholder pressure, eco-innovative adoption, environmental performance, Taiwan
INTRODUCTION
Although the effectiveness of voluntary adoption in environmental management is often criticized in policy debates (Arnold & Whitford, 2006), one argument supporting the diffusion eco-innovations on a business is the so-called “win-win hypothesis”(Porter and van der Linde, 1995). According to this hypothesis, firms that increase their investment in environmental innovation (this research terms eco-innovation) can obtain a competitive advantage, while reducing their negative environmental impact (Ambec & Lanoie, 2008; Argon-Correa, 1998; Aragon-Correa & Sharma, 2003; Christmann, 2000, Galdeano, Cespedes & Martinez, 2008; Hart, 1995; Porter & van der Linde, 1995; Russo & Fouts, 1997; Sharma & Vredenburg, 1998; Sharma & Henriques, 2005; Shrivastava, 1995). Yet critical still challenge the win-win hypothesis and argued that in many examples, eco-innovation adds to the costs of firms and there is no chance of economic payback (Walley & Whitehead, 1994). Moreover, good environmental performance may take time to come to fruition, increasing uncertainty about outcomes (Aragon-Correa & Sharma, 2003; Khanna & Damon, 1999). Therefore, it is further to explore whether eco-innovation can improve environmental performance.
What factors do influence firms to implement the eco-innovation, Porter and van der Linde (1995) argued that more stringent and flexible environmental regulations, such as taxes and tradable permits, would stimulate innovations. Marcus and Fremeth (2009) argued that government requirement and consumers buy power will influence green management of business. Berrone and Gomez (2009) argued that environmental issues are now a major social concern, companies face tight governmental regulations, increased media attention, and strong environmental activism by implementing strategies that help promote good environmental performance and reduce negative environmental impact. Huang,
Ding & Kao, (2009) mentioned that stakeholders press firms to adopt voluntary environmental practices. Stakeholder theory enhances stakeholders can influence the practices of organizations by exerting pressure on them (Freeman, 1984). Clarkson (1995) argued that transferring corporate social responsibility (including social and environmental performance) into business objectives is best undertaken using a stakeholder perspective- more specially, by transferring intangible social and environmental issues into tangible stakeholder interests. From a managerial perspective, in particular, the extent to which firms respond to stakeholder pressure becomes a critical concern (Buysse & Verbeke, 2003; Henriques & Sadorsky, 1999; Kassinis & Vafeas, 2006; Sharma & Henriques, 2005). Although pressures from stakeholders are likely to motivate managers to pursue eco-innovations practices (Huang et al., 2009), it is impossible for managers to address all stakeholder claims in the same time. Thus, we focus on the source of stakeholder pressure from primary, secondary and regulatory stakeholders (Buysse & Vereke, 2003; Clarkson, 1995; Kassinis & Vafeas, 2006; Sharma & Henriques, 2005). This study will investigate whether these stakeholders could influence the eco-innovative adoption of the firm.
Some researchers have showed stakeholder pressures have influenced on the action of firms toward the natural environment (Buysse & Verbeke, 2003; Henriques & Sadorsky, 1999; Huang et al., 2009; Sharma & Henriques, 2005), but there is little empirical support that stakeholder pressure enhance environmental performance (Kassinis & Vafeas, 2006). As competition increases, firms can benefits from improved relations with stakeholders (Berman et al., 1999; Hillman & Keim, 2001; Ogden & Watson, 1999; Pfeffer, 1998). Therefore, the relationship between stakeholder pressure and environmental performance requires further examination.
eco-innovation and environmental performance, drawing on the related research streams. The primary objective of this article is to investigate the relationships between stakeholder pressures and eco-innovation adoption and its impact on environmental performances. To do so, we surveyed three industries sectors from Taiwanese companies: chemical products, electronic industry, and electrical machinery industry. By 230 valid sampling and using structural equation modeling (SEM) technique, we test the relationships between stakeholder pressures and eco-innovation adoption and its impact on environmental performances. The contribution of our paper is three folded. First, it clarifies how corporate managers are likely to process stakeholder claims in a relatively under-explored agenda area. Second, our data allows us to observe how businesses from an emerging economy, where environmental awareness and regulation are relatively new, address environmental pressures from stakeholder groups. Finally, the results show the eco-innovative adoptions are positive impact on environmental performance.
LITERATURE REVIEW AND HYPOTHESES
DEVELOPMENT
Defining eco-innovative adoption
“Evolutionary” environmental practices have gone beyond the early compliance versus noncompliance categorizations (Logsdon’s, 1985) to include “proactivist”(Aragon-Correa, 1998; Hunt & Auster, 1990) and “innovation” (Christmann, 2000; Post & Altman, 1992, Ramus & Steger, 2000) categories that represent creative problem solving by managers and the search for, and adoption of, innovative environmental technologies. Some scholars argue that