行政院國家科學委員會專題研究計畫 成果報告
網路學習之形成性評量與學習診斷工具發展與研究(第 3
年)
研究成果報告(完整版)
計 畫 類 別 : 個別型 計 畫 編 號 : NSC 97-2628-S-004-001-MY3 執 行 期 間 : 99 年 08 月 01 日至 100 年 07 月 31 日 執 行 單 位 : 國立政治大學圖書資訊與檔案學研究所 計 畫 主 持 人 : 陳志銘 計畫參與人員: 碩士班研究生-兼任助理人員:陳勇汀 碩士班研究生-兼任助理人員:黃浚維 碩士班研究生-兼任助理人員:謝綸 碩士班研究生-兼任助理人員:吳志豪 碩士班研究生-兼任助理人員:范蔚敏 碩士班研究生-兼任助理人員:林上資 報 告 附 件 : 出席國際會議研究心得報告及發表論文 處 理 方 式 : 本計畫涉及專利或其他智慧財產權,1 年後可公開查詢中 華 民 國 100 年 10 月 17 日
行政院國家科學委員會專題研究計畫成果報告
網路學習之形成性評量與學習診斷工具發展與研究
計畫主持人:陳志銘 教授 計畫執行單位:國立政治大學圖書資訊與檔案學研究所 計畫編號:97-2628-S-004-001-MY3 計畫執行期間:97 年 8 月 1 日~100 年 7 月 31 日摘要
網路學習近年來蓬勃發展,相對於網路學習的不斷創新與突破,有效的學習評量與回饋 機制卻一直是網路學習系統較弱的一環。傳統的總結性評量旨在評估學習者最終的學習成 效,卻無法衡量學習者的學習歷程;透過形成性評量,教學者可以在學習者的學習過程中, 觀察學生學習歷程中的學習行為,並給予回饋,或針對學生的盲點進行補救。資訊技術的進 步,讓教師可透過學習系統,在不干擾學習者的情形下記錄學習者的學習歷程檔案,進而利 用資料探勘技術,將學習者的學習歷程轉換成具有教育意義的資訊,協助教師進行評量,更 能即時讓教師對學習者的行為予以督促及回應,增進學習者學習成效。本研究提出一個形成 性評量機制,整合包括因素分析、模糊聚類、灰關聯分析、模糊關聯規則分析和模糊推論等 資料探勘方法,對學習歷程檔案進行分析,探勘關鍵的形成性評量規則,應用於網路學習環 境中,協助教師與學生進行學習成效回饋互動。本研究所提出之學習規則探勘過程可以基於 學習歷程檔案找出主要影響學習成效的關鍵性學習因素,來預估學生的學習成效,提供學習 者即時回饋;而對學習者而言,可藉由評量系統的即時回饋,調整自己的學習狀況,達最佳 學習狀態。實驗結果顯示,本研究所發展之基於學習歷程檔案之形成性評量非常接近總結性 評量結果,此外,具有形成性評量支援之網路學習系統更能提升學習者的學習成效及學習動 機。 關鍵字:形成性評量、網路學習、學習歷程檔案、學習因素分析、資料探勘Abstract
Current trends clearly indicate that online learning is gaining in importance, but there is still a lack of an effective learning performance assessment mechanism for e-learning systems. Learning performance assessment aims to evaluate what learners learnt during the learning process. Traditional summative evaluation only considers final learning outcomes without concerning learning processes of learners. With the evolution of learning technology, the use of learning portfolios in a web-based learning environment can be beneficially applied to record the procedure of the learning, evaluate the learning performances of learners, and produce feedback information to learners in ways that enable them to learn better. Accordingly, this study proposed a mobile formative assessment tool using data mining techniques, which involves six computational intelligence theories, i.e., statistic correlation analysis, fuzzy clustering analysis, grey relational analysis, K-means clustering scheme, fuzzy association rule mining and fuzzy inference, in order to identify the key formative assessment rules based on the web-based learning portfolios of an individual learner for the performance promotion of web-based learning. In other words, the
proposed scheme can help teachers to precisely assess the learning performance of individual learner utilizing only the learning portfolios in a web-based learning environment. Therefore, teachers can devote themselves to teaching and designing courseware since they save a lot of time in evaluating learning performance. More significantly, teachers could understand the main factors influencing learning performance in a web-based learning environment according to the obtained interpretable learning performance assessment rules. Experimental results indicated that the evaluation results of the proposed scheme are very close to those of summative assessment results. Moreover, the factor analysis provides the benefit in terms of obtaining simpler and clear learning performance assessment rules. Furthermore, the proposed learning feedback with formative assessment could obviously promote the learning performances and interests of learners.
Keywords: Formative Assessment, Web-based Learning, Web-based Learning Portfolio, Learning
Factor Analysis, Data Mining
1. Introduction
In the past years, more and more assisted learning tools on e-learning systems were developed due to the network and the computer popularization. Learning performance assessment approaches are essential in the web-based learning field, owing to the rapid growth of e-learning systems globally and lack of assisted learning performance assessment tools for assessing web-based learning process. Gagnés’ research on the internal process of learning has indicated that the complete learning process should assess learning performance (Gagn é s, 1997). Learning performance evaluation instruments can generally break down into two broad categories: summative and formative (Torrance & Pryor, 1998; Margaret, 2003). Summative evaluation is generally carried out towards the end of a course (Nuhfer, 1996). It stands in contrast to formative evaluation, which is provided while the course is ongoing so as to permit improvements (Scriven, 1967; Tessmer, 1993). The purpose of summative assessments is to make a judgment of learner competency after an instructional phase is complete. Conversely, the use of formative assessment helps teachers to obtain feedback about how well learners are learning and particular difficulties they might be having. In other words, the formative assessment can help teachers to gather information and to use the information as feedback to modify their teaching strategies and to improve learners’ learning outcomes.
A web-based learning portfolio can be collected, stored and managed automatically by computers when learners interact with an e-learning platform. Consequently, the learning portfolios not only provide true and rich information for reflecting and assessing the true performances and achievements of learners, but it also help learners to engage in meaningful learning. Therefore, learning performance assessment using a web-based learning portfolio has received significant attention recently (Lankes, 1995; Rahkila & Karjalainen, 1999). Lankes (1995) stated that implementing computer-based learner assessment portfolios is an innovatively educational innovation owing to its ability not only offers an authentic demonstration of accomplishments, but also enables learners to take responsibility for their completed tasks. Several studies emphasized that the learning portfolio assessment is supported by the cognitive–constructive theory of learning (Rahkila & Karjalainen, 1999; Bruner, 1996). Wang et al. (2003) found that learning behavior information, commonly referred to as a learning portfolio, can help teachers to understand why a learner obtained a high or low grade.
However, developing a precise learning performance assessment scheme using web-based learning portfolio is a challenging task for web-based learning systems. Data mining had been considered as an appropriate method of knowledge discovery to excavate the implicit information (Margaret, 2003). Thus, this study presents a data mining approach that integrates six computational intelligence schemes, i.e., the statistic correlation analysis (Johnson & Wichern, 1988), fuzzy clustering algorithm (Gath & Geva 1989), the grey relational analysis (Deng, 1989; Chen, Chang, &
Liao, 2000), K-means clustering scheme (Krishna & Murty, 1999), fuzzy association rule (Delgado
et al., 2003; Hong, Kuo & Chi, 1999) and fuzzy inference (Lin & Lee, 1996), to evaluate on-line
learning behavior and learning performance. The six computational intelligence schemes were employed to perform independence and importance analysis of the considered learning factors for extracting the key factors that contribute to learning performance and to discover the useful fuzzy association rules relating to the learning performance assessment.
Based the proposed assessment method, the results can help teachers to perform precise formative assessments according to the learning portfolios of individual learners gathered from a web-based learning system and mobile formative assessment tool implemented on PDA for teachers. The inferred learning performance can be applied as a reference guide for teachers and as learning feedback for learners. Through the feedback mechanism, every learner can understand his/her current learning status and make suitable learning adjustments. Hence, every learner is able to play a more active role in his/her learning (Black, 2001). Additionally, teachers can observe the main factors influencing learning performance in a web-based learning environment from mobile formative assessment tool according to the interpretable learning performance assessment rules. Moreover, teachers can adjust their teaching strategies based on these main learning factors influencing the learning performance. In the meanwhile, since teachers save much time in evaluating learning, they can devote more time to teaching and designing courseware. Experimental results indicated that the evaluation results of the proposed formative assessment scheme are very close to those of summative assessment results and the proposed factor analysis scheme can simplify the learning performance assessment rules. Moreover, the experimental results also revealed that the learning feedback of formative assessment is very helpful to assist web-based learning, enhance significantly the learners’ learning achievements and promote their learning interests.
2. System Design
Learning assessment is typically the most appropriate process to evaluate the learning performance and teaching effects regardless of the traditional classroom or web-based learning environment. This section aims to present the proposed formative assessment system and scheme. First, the system architecture is presented in Section 2.1. Next, the considered learning portfolio in the learning profile database is explained in Section 2.2. Finally, the proposed formative assessment approach based on learning portfolios is detailed in Section 2.3.
2.1 System Architecture
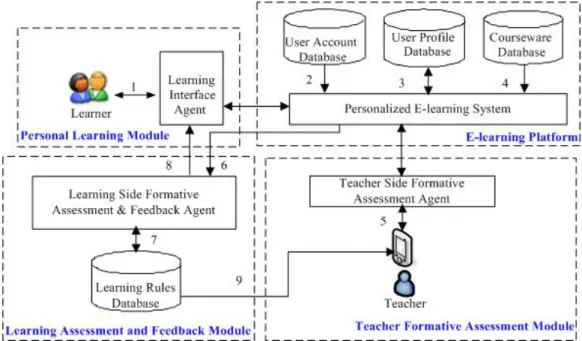
The personalized e-learning system (PELS) based on Item Response Theory was presented for adaptive learning services of individual learners in our previous study (Chen, Lee & Chen, 2005; Chen, Liu & Chang, 2006). Figure 1 shows the learning interface of the personalized e-learning system. However, the PELS mainly focuses on performing adaptive learning. The learning performance assessment is lacked feature in this system. In this study, the PELS is extended to include the learning assessment & feedback module and the teacher formative assessment module for assisting learning performance assessment and learning feedback using the gathered learning portfolios of individual learners. The PELS can automatically gather the useful learning portfolios of individual learners for the learning performance assessment during learning processes. The proposed personalized e-learning system with formative assessment mechanism is shown as Fig. 2. The primary functions of the extended formative assessment modules will be described in Sections 2.1.1 and 2.1.2, respectively.
Figure 1. The learning interface on PELS
Figure 2. The system architecture of the proposed personalized e-learning system with formative assessment mechanism
Based on the system architecture, the details of system operation procedure are described and summarized as follows:
Step 1 Learners login the system through the learning interface agent by the legal learners’ accounts.
Step 2 After a learner logins the system, the learning interface agent will check whether his account stored in the user account database.
Step 3 If the learner has already owned a registered account, the system will get his learning profile from the user profile database for personalized learning services.
Step 4 The system guides the learner to perform the personalized courseware learning based on the course materials stored in the courseware database and the user profile information stored in the user profile database.
Step 5 The teacher uses PDA to assess the learning states of individual learners during the learning process, including the attendance statuses, question & answer responses for teacher questions, concentration degree on learning, and learning comments for individual learners. All learning records will be stored in the user profile database through wireless network communication.
Step 6 The learning side formative assessment and feedback agent gets the learning portfolios from the user profile database and analyze the key formative learning assessment rules.
Step 7 The learning side formative assessment and feedback agent stores those discovered formative learning performance assessment rules into the learning rule database for inferring learning performances of individual learners.
Step 8 The learning side formative assessment and feedback agent predicts the learning performances of individual learners according to the learning portfolios of individual learners and conveys the evaluating results to the learners in order to assist learning reflections and adjust learning strategies.
Step 9 The teacher can also get the discovered learning performance assessment rules from the learning rules database through PDA. Based on the results, the teacher can adjust his\her teaching strategies. The user then returns to Step 4 for the next learning cycle or logs out, terminating the learning process.
2.1.1 Teacher formative assessment module
Formative assessment is a new trend of assessment wherever in the classroom or on the web learning environment. In the study, formative assessment was conducted in a classroom with computer-assisted learning environment and mainly focused on evaluating the learning situations of each individual leaner. That is, teachers have to evaluate learning processes of each individual learner based on several considered formative learning factors mentioned later, such that learners are able to get better learning performance by reflecting their learning strategies during learning processes. By contrast, teachers also need to know the learning situations of the whole class, and what the class needs work on. Learning feedback from formative assessment outcome can aid learners to improve their learning performances and facilitate teachers to adjust their teaching strategies. Therefore, the teacher side formative assessment agent aims to assist teachers to record learners learning processes, such as the attendance statuses, concentration degree, question & answer response and learning comments to the learners, and provide a friendly interface to aid teachers to view learners’ learning statuses on the PELS.
2.1.2 Learning assessment and feedback module
Nicol and McFarlane-Dick (2006) indicated that formative assessment with feedback information provides simultaneously benefit to learners and lecturers. Feedback enables learners to restructure their understanding/skills and to build more powerful ideas and capabilities. Ramaprasad and Sadler (Ramaprasad, 1983; Sadler, 1989) also explained that feedback given as part of formative assessment helps learners to become aware of any gaps that exist between their desired learning goal and their current knowledge. Learning, assessment and feedback form the learning cycle improving teaching and learning. In the personalized e-learning system, all learners’ interaction with learning system can be recorded automatically in the web learning portfolios. Therefore, how to turn the huge amount of learning portfolios data into meaning educational information and how to give effective feedbacks for teachers and online learners are two concerned issues in the study. To solve these two problems, the statistical theory and data mining techniques
are employed to analyze learners’ online learning behaviors based on the web learning portfolios. In the learning assessment and feedback module, the learning side formative assessment and feedback agent is applied to mine the main learning factors influencing learning performance based on the web learning portfolios and the learning records in the classroom with computer-assisted learning environment from teacher. Moreover, the agent was employed to produce the results of the formative learning assessment. Learning feedback is not only used to predict learners’ learning performance in the learning procedure, but also provides benefits in terms of teachers’ teaching and learners’ learning. The agent aims to simultaneously provide assessment feedback to the learners who were performing learning activities on the PELS and the teachers with PDA mobile formative assessment tool who were performing teaching activities on the PELS.
2.2 Considered Learning Portfolio in the User Profile Database
This section describes the learning portfolio information collected by PELS and PDA for the proposed learning performance assessment approach. The ten gathered learning factors are described in detail as follows:
2.2.1 Learning factors gathered by PELS
(1) Reading rate of course materials (RR)The reading rate of course materials is defined as the rate of studying course materials in a course unit, and the notation RR is employed to represent the learning factor.
(2) Total accumulated reading time of all learned course materials (RT)
The total accumulated reading time of each learner is calculated by summing up the reading time of all learned course materials on the PELS system, and the notation RT is used to represent the learning factor in this study.
(3) Learner ability evaluated by PELS (LA)
After studying the recommended courseware, the PELS (Chen, Lee & Chen, 2005; Chen, Liu & Chang, 2006) can dynamically estimate a learner’s ability according to the Item Response Theory (Baker, 1992) by collecting the replied responses of the learner to the randomly selected testing questions in the learned course unit. The range of learner’s ability and difficulty parameter of courseware is limited from -3 to +3. The notation LA is used to represent the learning factor of learner ability in this paper.
(4) Correct response rate of randomly selecting testing questions (CR)
After a learner has studied the recommended course material, the PELS tests the learner on his understanding by randomly selecting a relevant question from the testing item database. The rate of correct responses to test questions helps to determine the learner’s degree of understanding for all learned courseware, and the notation CR is used to represent the learning factor in this paper.
(5) Effort level of studying course materials (EL)
Since each course material in the PELS system is assigned a required minimum reading time by course experts based on the courseware content, the effort level is defined as the actual reading time compared with the required minimum reading time for the learned courseware, and the notation EL is used to represent the learning factor in this study.
This study measures the final test grade through the summative assessment scheme of fixed-length testing examination after the entire learning process is completed, and the notation GRADE is used to represent the learning factor in this paper.
2.2.2 Learning factors gathered by PDA
(1) Attendance rate (AR)The attendance rate is defined as the rate of participating in courseware learning in a course unit, and the notation AR is employed to represent the learning factor.
(2) Accumulated score of question and answer (QA)
The teacher side formative assessment agent defines various scores for the different qualities of question and answer responses. Teachers can give different scores that were predefined by the system as 1 point, 3 points and 5 points according to the qualities of learner question or answer responses. The accumulated score of question and answer responses represents the level of active interaction with teachers, and the notation QA is used to represent the learning factor in this study. (3) Concentration degree (CD)
If a learner does not concentrate on the learning activity during learning processes, the teacher can give him/her –1 point, -3 points and –5 points according to the degree of his/her distraction, respectively. The summation of the score assessed by the teacher can be viewed as the distraction degree. Therefore, the concentration degree is an inverse score according to the score of the distraction degree and the notation CD is used to represent the learning factor.
(4) Accumulated score based on teacher’s comments (SC)
The teacher side formative assessment agent implemented on PDA provides an interface for teachers to edit some default comments before performing learning activities. In the study, the positive comments and negative comments will get 3 points and –3 points, respectively. The teacher gives a comment score based on assessing each learner’s learning behaviors during learning processes and the total score of teacher’s comments will be accumulated automatically. The notation SC is used to represent the learning factor.
2.3 The Proposed Formative Assessment Approach Based on Web-based
Learning Portfolios
2.3.1 The flowchart of formative assessment
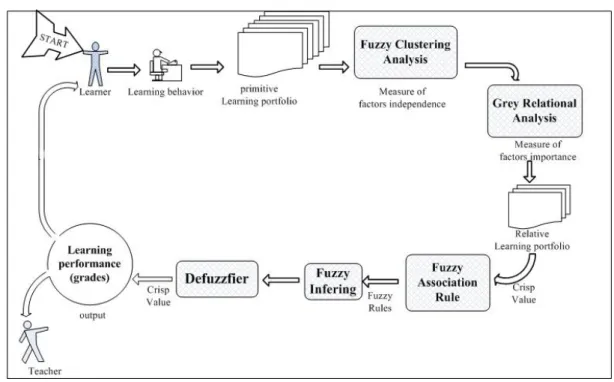
Figure 3 shows the entire flowchart of the proposed learning performance assessment scheme. Initially, the factor analysis procedure attempts to identify the main learning factors, which are independent and important factors affecting the final learning outcome. To identify the independence between learning factors, a statistical correlation analysis and the fuzzy clustering method are primarily employed, and then the grey relational analysis is used to measure the importance of factors. Next, the K-means clustering algorithm (Krishna & Murty, 1999) is used to logically determine the fuzzy membership function based on real data distribution of learning portfolios for the fuzzy association mining, and hence discover valuable fuzzy knowledge rules for learning performance assessment. The K-means clustering algorithm is a very popular, simple, useful, and unsupervised clustering method (Chinrungrueng & Sequin, 1995; Sarkar, Yegnanarayana & Khemani, 1997; Lee, Baek & Sung, 1997; Krishna & Murty, 1999) based on the Euclidean distance measure for numerous engineering and scientific disciplines such as image segmentation, patterns reorganization and data mining (Wu & Huang, 2006). Based on the reasons, this study employed the K-means clustering algorithm to logically determine the membership functions used in the fuzzy association rule mining. After the fuzzy association rule mining identifies the fuzzy rules for learning performance assessment, the fuzzy inference is employed to grade the learning performance for learners. The following sections give details for the proposed
learning performance assessment scheme for individual learners.
Figure 3. The flowchart of learning performance assessment
2.3.2 Learning factor analysis
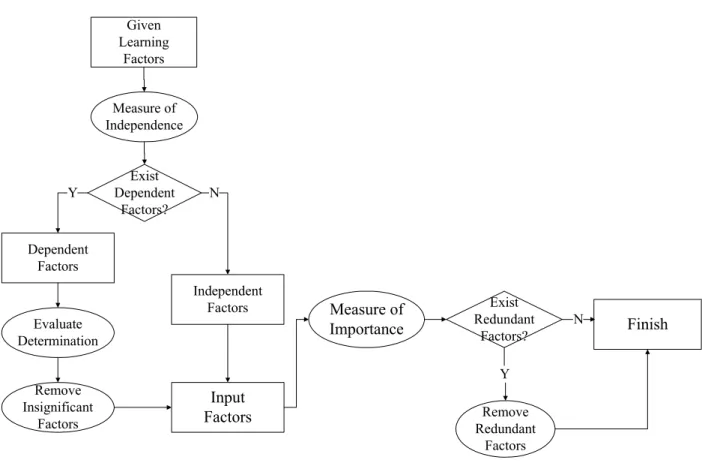
First of all, factor analysis is an essential and important step towards finding key learning factors affecting learning performance assessment (Wang & Kuo, 2004). Before mining the learning performance assessment rules from the learning portfolios, the independent and important learning factors have to be first decided. Learning factor analysis is critical for the proposed learning performance assessment scheme owing to it can enhance the learning evaluation efficiency and accuracy with respect to filtering out some factors that are dependent and less important to learning performance from the learning portfolios (Chen, Chen & Liu, 2007). The purpose of learning factor analysis aims to find the minimum number of learning factors that can represent complete information of the learning process as possible. Fig. 4 shows the proposed flowchart of the learning factor analysis.
Given Learning Factors Measure of Independence Independent Factors Dependent Factors Evaluate Determination Input Factors Finish Remove Redundant Factors Measure of Importance N N Y Exist Redundant Factors? Exist Dependent Factors? Remove Insignificant Factors Y
Figure 4. The learning factor analysis flowchart
2.3.2.1 Learning factor dependence analysis using the fuzzy clustering method
To consider the independence of factors is because they can represent the key learning factor better than considering all learning factors (Wang & Kuo, 2004). Therefore, identifying the independence of learning factors is also the necessary condition of mining key formative assessment rules from the learning portfolios in the web-based learning system. Learning factor dependence analysis not only improves the efficiency of data mining due to reducing the complexity of the procedure, but also facilitates the teacher to understand the simple and clear learning performance assessment rules. To analyze the dependence among the learning factors, the statistic theory and fuzzy set theory are employed, which involves the correlation analysis, the coefficient of determination and fuzzy clustering analysis.Statistic theory is a conventional method broadly used to investigate the relationship between factors. From the statistic point of view, the correlation is generally used to define whether one factor is related to another. Therefore, the independence among the learning factors can be measured by their pairwise correlation coefficient (Johnson & Wichern, 1988). Moreover, fuzzy clustering analysis algorithm is then employed to cluster those learning factors based on their similarities (Behounek & Cintula, 2005). Since fuzzy theory was proposed by Zadeh (1996) in 1965, fuzzy clustering analysis algorithm had been successfully implemented in taxonomy, feature analysis, pattern recognition, image processing, medicine, geology and neural network (Bezdek, 1981; Hoppner et al., 1999; Yang, 1993). Unlike most of the traditional clustering algorithms, fuzzy clustering analysis accepts the fact that every data belongs to all clusters with different degrees of membership between 0 and 1 to every datum (Kennedy, Price & Susanto, 1997). For such a reason, the learning factors belong to different clusters with different degrees and the dependence of learning factors can then be determined accordingly. The learning factors dependence analysis will be elaborated as following steps:
The first step for adopting statistical correlation for factor dependence analysis is to determine the original referred sequence and comparative sequence. The final test grade is regarded as the referred sequence, and the rest of nine learning factors mentioned-above are treated as the comparative sequences.
Step 2. Calculating the correlation coefficient
Correlation analysis is a statistical technique that can evaluate whether and how strongly pairs of learning factors are related by computing the pairwise correlation coefficient ri,j of the learning factors x and i x . The formula is defined as following (Johnson & Wichern, 1988): j
) ( ) ( ) , ( , j i j i j i x Var x Var x x Cov r (1)
where Cov(xi,xj) represents the covariance of the learning factors x and i x , j Var(xi) and
) (xj
Var respectively stand for standard deviations of the learning factors x and i x . j
The correlation coefficient always takes a value between -1 and 1, with 1 or -1 indicating perfect correlation. A positive correlation indicates a positive relation between the learning factors, while a negative correlation indicates a negative relation between the learning factors. A correlation value close to 0 indicates no relation between the learning factors.
Step 3. Fuzzifying the correlation coefficient
If the learning factors x and i x are independent, then j ri,j is 0. However, it is difficult to define any two factors are completely independent or dependent. Based on the fuzzy theory (Behounek & Cintula, 2005), the relation of two factors can be viewed as “degree of dependence” by fuzzifying the correlation coefficient of the learning factors x and i x within the range j between 0 to 1. In this work, the membership function ~
(
r
)
A
was employed to fuzzify the correlation coefficients computed in Step 2, and formulated as the following: 1 , ) 1 ( 0 , ) ( 2 2 2 2 ~ r a r a a b b a r r a a b b r A (2) where a,b
0,1 , r ri,j .Step 4. Constructing the fuzzy relation matrix
A fuzzy relation matrix A~i can be constructed to represent the level of dependence between each pair of learning factors. The notation ~
(
r
)
A
in fuzzy relation matrix is the fuzzy degree computed in Step 3. The A~i is represented as following:12 13 1 21 23 2 31 32 3 1 1 1 1 1 n n n n A (3)
Step 5. Clustering the learning factors
For each fuzzy relation matrix, a hierarchical clustering method (Liao, 2001) with a chosen -cut value for identifying dependence level is used to detect the dependent learning factors. Different -cut values of dependence levels form different number of clusters. To optimize the clustering result, the fuzzy correlation coefficients within the same cluster are expected as high as possible, but the ones between different clusters are expected as low as possible. Thus, the cost function, which integrates maximizing the fuzzy correlation coefficients in the same cluster and
minimizing the fuzzy correlation coefficients among different clusters, was employed to determine best appropriate number of clusters under considering differentα-cuts in the employed fuzzy clustering analysis scheme. In other words, the used cost function aims to consider that the learning factors within the same cluster should be as similar as possible, but the learning factors of different clusters should be as dissimilar as possible.
Step 6: Computing the coefficient of determination
After the dependence of learning factors clustered in the same cluster is detected, the dependent learning factors with the lower degree of importance should be removed. The factor with higher coefficient of determination indicates that the factor contains the larger amount of information to contribute the prediction of the learning performance (i.e. final test grade). Therefore, the dependent factors with the lower degree of importance will be removed because of their unimportance, whereas factors with the larger degree of determination are remained. The coefficient of determination of each dependent learning factor is computed as follows:
yy yy yy xy SS SSE SS SSE SS r2 1 (4)
( ˆ )2 i i y y SSE (5) 2 ) (
y y SSyy i (6) where 2 xyr represents the coefficient of determination of the learning factors x against the
learning performance y (i.e. final test grade), SSE measures the deviation of the observation of the learning performance y with their predicted values yˆ , SSi yy measures the deviation of the
observation of the learning performance y with the mean y, and yˆ is the predicted value of the i
regression curve.
2.3.2.2 Learning factor importance analysis using the grey relational analysis
The relationships between the learners’ learning performance and the learning factors affecting the learning performance are usually unclear or the relational information is incomplete. It could be difficult to analyze important learning factors related to the learning performance by the traditional statistical methods or machine learning methods. This is because these methods usually require a large amount of complete samples or data must follow a certain statistical distribution, but the grey relational analysis (GRA) method (Deng, 1982) in grey system theory throws emphasis on the problem of “small-sized data samples, poor information and uncertainty” which cannot be handled by traditional statistics (Kui, 2005; Qinbao, Martin & Carolyn, 2005). The main reason of using the GRA is the consideration of the reference sequence. The grey relational analysis (GRA) proposed by Professor Deng, which ranks sub-factors with each main factor by degree of relevance using the grey relational grade (Deng, 1989; Chen, Chang, & Liao, 2000). The importance of a single data sequence can be explored by the grey relational grade.2.3.3 Fuzzy association rule mining
Hong et al. study (1999) presented the fuzzy association rule to overcome a defect in Boolean association rules for handling quantitative transaction data. To identify the large fuzzy grids for the fuzzy association rule mining, the transaction data with quantitative value must be first transformed into fuzzy degrees. To determine the fuzzy membership function logically, the K-means clustering algorithm (Krishna & Murty, 1999) is used to determine the centers of the triangle fuzzy membership functions automatically according to the data distribution of each learning factor in the learning portfolios for the fuzzy association rules mining herein. Additionally, this study employed Hong’s fuzzy association rule scheme (Hong et al., 1999) to discover whether the fuzzy knowledge rules are related to the learning performance from the learning portfolios. The employed fuzzy
association rule mining procedures for mining formative assessment rules has been proposed in our previous study (Chen, Chen & Liu, 2007).
2.3.4 Fuzzy inference for the learning performance assessment
The discovered fuzzy production rules are formed by IF-THEN rules. A defuzzification strategy aims to convert the outcome of fuzzy inference into a crisp value. In the fuzzy set theory, the center of gravity (COG) (Lin & Lee, 1996), which is most widely used defuzzification scheme, is utilized to obtain the crisp value of a learner’s learning performance.
3. Experiments
In this section, the performance of the proposed formative assessment scheme is first evaluated in Section 3.1. Section 3.2 explains the discovered learning performance assessment rules in the actual teaching scene. Next, the developed formative assessment tools for both the learner and teacher sides are introduced in Section 3.3. Section 3.4 describes the experimental design for evaluating the promotion of the learning performance with learning performance assessment feedback. Section 3.5 illustrates the evaluation results of learning performance. Finally, a discussion is drawn out for the proposed learning performance assessment scheme.
3.1 Evaluation Results of the Proposed Learning Performance Assessment
Scheme
To verify the quality of the discovered learning performance assessment rules, the learning portfolio gathered from 583 third-grade students of Taipei County Jee-May Elementary School, who were invited to participate in the learning activity of the “Fractions” course unit in elementary school mathematics, was first used to identify learning performance fuzzy rules affecting their learning outcomes. In the experiment, the learning records of 400 out of 583 learners were used as training data to extract learning performance assessment rules, and the other learning records served as testing data to verify the accuracy of the discovered learning performance assessment rules. The experimental results are described as follows.
3.1.1 Learning factor analysis
3.1.1.1 Learning factor independence analysis
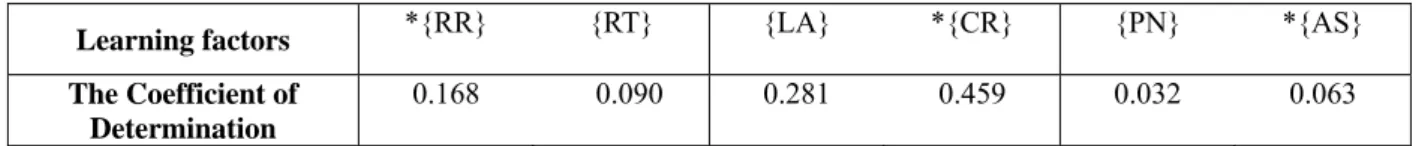
Initially, Table 1 displays the computing correlation coefficients between the seven considered learning factors presented in our previous study (Chen, Chen & Liu, 2007). Then, the correlation coefficients of learning factors are fuzzified for the fuzzy clustering analysis. Table 2 lists the result of fuzzy clustering analysis with different -cut values. When the -cut value is set 0.79, the best clustering result {{RR, RT}{LA, CR}{PN, AS}{EL}} with maximum value of clustering cost function mentioned-above is obtained. Next, the coefficients of determination of those dependent learning factors in the clusters {RR, RT}, {LA, CR} and {PN, AS} are measured, and the dependent learning factors are filtered out except the one with largest coefficient of determination. Table 3 shows the learning factors{RT}、{LA} and { PN } can be removed due to relatively lower coefficients of determination to the learning performance assessment. Thus, these four learning factors {RR}、{CR}、{AS} and {EL} are served as significant learning factors after performing the factor dependence analysis.
Table 1. The correlation coefficients between seven considered learning factors Learning Factors RR RT LA CR PN AS EL RR 1 -0.705 0.256 0.495 0.269 0.381 0.309 RT -0.705 1 -0.242 -0.421 -0.278 -0.406 -0.240 LA 0.256 -0.242 1 0.859 0.276 0.323 -0.027 CR 0.495 -0.421 0.859 1 0.286 0.357 0.102 PN 0.269 -0.278 0.276 0.286 1 0.667 -0.033 AS 0.381 -0.406 0.323 0.357 0.667 1 -0.078 EL 0.309 -0.240 -0.027 0.102 -0.033 -0.078 1
Table 2. The fuzzy clustering results with different -cutvalues
-cut Value Clustering Results Dependence in
the Same Cluster
Independence
between Clusters Total
0.69 {RR, RT, LA, CR, PN, AS, EL} 14.012 0 14.012 0.70 {RR, RT, LA, CR, PN, AS}{EL} 13.223 5.211 18.434 0.78 {RR, RT, LA, CR}{PN, AS}{EL} 10.645 10.633 21.279 0.79 {RR, RT}{LA, CR}{PN, AS}{EL} 9.232 13.219 *22.451 0.90 {RR, RT}{LA, CR}{PN}{AS}{EL} 8.564 13.552 22.116 0.92 {RR, RT}{LA}{CR}{PN}{AS}{EL} 7.705 13.693 21.397 0.93 {RR}{RT}{LA}{CR}{PN}{AS}{EL} 7.000 13.988 20.988
Table 3. The coefficients of determination of dependent learning factors
Learning factors *{RR} {RT} {LA} *{CR} {PN} *{AS}
The Coefficient of Determination
0.168 0.090 0.281 0.459 0.032 0.063
3.1.1.2 Learning factor importance analysis
In the previous subsection, the four independent learning factors {RR}、{CR}、{AS} and {EL} are extracted based on the proposed learning factor analysis scheme. Next, these four learning factors are further measured by the grey relational analysis in order to figure out the degree of importance. Table 4 lists the grey relational grades between the referred sequence and various comparative sequences based on the ranking order of the grey relational grades. The results indicate that the top three considered learning factors are highly relevant to the final test score since their grey relational grades are greater than the threshold of 0.5. Thus, the three learning factors were preserved to perform the fuzzy association rule mining and detect useful fuzzy rules for learning performance assessment, but the learning factor AS was eliminated since it has lowest relevance to the final test score among four considered learning factors.
Table 4. The grey relational grades between the referred sequence and comparative one
Factor Analysis Item Grey Relational Grade
) , (GRADECR 0.8594 ) , (GRADEEL 0.7027 ) , (GRADERR 0.5883 ) , (GRADE AS 0.4757
3.1.2 The discovered fuzzy rules for learning performance assessment
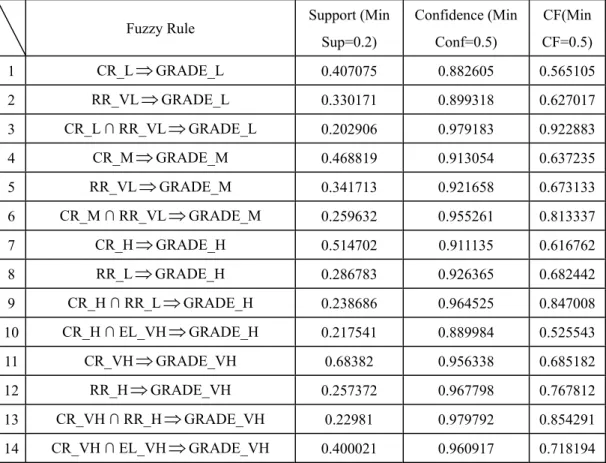
To explain the discovered fuzzy association rules for learning performance assessment, the simplified representation notations VH, H, M, L and VL were employed to represent “very high”, “high”, “moderate”, “low” and “very low” for fuzzy rules, respectively. After performing the fuzzy association rule mining procedure, fourteen fuzzy learning rules are discovered in this study. Table 5 displays the entire discovered fuzzy rules that can be employed to assess the learning performance of learners with various grade levels in the proposed learning performance assessment scheme. These interpretable fuzzy rules for the learning performance assessment of various grade levels are valuable to teachers to understand which learning factors influence the learning performance in a web-based learning environment.
Table 5. The discovered learning performative assessment rules with the satisfied minium fuzzy support, confidence, and certainty factor
Fuzzy Rule Support (Min Sup=0.2) Confidence (Min Conf=0.5) CF(Min CF=0.5) 1 CR_LGRADE_L 0.407075 0.882605 0.565105 2 RR_VLGRADE_L 0.330171 0.899318 0.627017 3 CR_L ∩ RR_VLGRADE_L 0.202906 0.979183 0.922883 4 CR_MGRADE_M 0.468819 0.913054 0.637235 5 RR_VLGRADE_M 0.341713 0.921658 0.673133 6 CR_M ∩ RR_VLGRADE_M 0.259632 0.955261 0.813337 7 CR_HGRADE_H 0.514702 0.911135 0.616762 8 RR_LGRADE_H 0.286783 0.926365 0.682442 9 CR_H ∩ RR_LGRADE_H 0.238686 0.964525 0.847008 10 CR_H ∩ EL_VHGRADE_H 0.217541 0.889984 0.525543 11 CR_VHGRADE_VH 0.68382 0.956338 0.685182 12 RR_HGRADE_VH 0.257372 0.967798 0.767812 13 CR_VH ∩ RR_HGRADE_VH 0.22981 0.979792 0.854291 14 CR_VH ∩ EL_VHGRADE_VH 0.400021 0.960917 0.718194
To measure the accuracy rate of learning performance assessment for the proposed method, two methods were used to measure the predicted learning performance. First, the 5 point method was used to evaluate the accuracy rate of the predicted learning performance. That is, if the difference between the predicted learning score and the actual final test score was in the range −5 to +5, then the predicted result is served as correct; otherwise, the predicted result is incorrect. Additionally, the score level method was used to evaluate the accuracy rate of the predicted learning performance. In this evaluation method, the each learner is assessed according to one of five score levels based on the mapping membership degrees of learning factor GRADE. For example, the score level of a learner with a final test score of 85.16 was set to GRADE.M, because the linguistic term of GRADE.M has the largest mapping membership degree among the other linguistic terms of the learning factor GRADE.
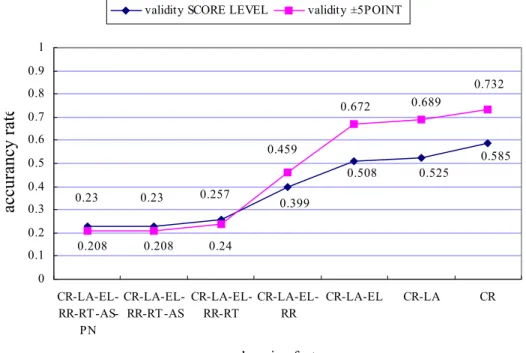
Figure 5 illustrates the prediction accuracy rates of 183 testing data under various combinations of learning factors for the two proposed accuracy evaluation methods. The experimental results show that the proposed dependence and importance analysis scheme of learning factor can help the proposed learning performance assessment scheme to identify the key learning factors. As mentioned early, when the more sets of dependent learning factors, such as {CR, LA}, {RR, RT} and {PN, EL}, are included, the lower accuracy rate is displayed in Figs. 5. For example, when the dependent learning factor set {CR, LA} is considered to perform the learning performance assessment, the predicted accuracy rate is lower than those of only considering the learning factor {CR}. According to the results, the independent learning factors to each other facilitate the learning performance assessment.
In addition, the experimental results revealed as Fig. 5 show that the proposed grey relational analysis scheme can help the proposed learning performance assessment scheme to identify the significant learning factors. When the learning factors with low grey relational grades, such as PN, AS and RT, were considered to perform the learning performance assessment, the predicted accuracy rate will descend. Conversely, if only the learning factor with the largest grey relational grad was considered, then the proposed method obtained the highest prediction accuracy rate.
0.399 0.257 0.23 0.23 0.508 0.525 0.585 0.24 0.459 0.208 0.208 0.672 0.689 0.732 0 0.1 0.2 0.3 0.4 0.5 0.6 0.7 0.8 0.9 1 CR-LA-EL-RR-RT -AS-PN CR-LA-EL-RR-RT -AS CR-LA-EL-RR-RT CR-LA-EL-RR CR-LA-EL CR-LA CR learning factors accurancy rat e
validity SCORE LEVEL validity ±5POINT
Figure 5. The predicted accuracy rates of 183 testing data under considering various combinations of learning factors for the two proposed accuracy evaluation methods
Teaching Scene
In the actual teaching experiment for verifying how the feedback of learning performance assessment outcomes affects the learning performance assessment, 69 third-grade students of Taipei County Jee-May Elementary School, who had majored in the “Fractions” course unit in elementary school mathematics, were invited to test this system. The learning portfolios with 9 considered learning factors gathered from PELS and PDA-based formative assessment tool were used to mine the learning performance assessment rules. After performing factor analysis, the learning factors {CR}, {RT}, {AR}, and {CD} were identified as key learning factors influencing learning performance. All of the 40 discovered learning performance assessment rules are listed in Table 6. Table 6. The discovered learning performance assessment rules in the actual teaching experiment
Fuzzy Rule Support (Min Sup=0.2) Confidence (Min Conf=0.5) CF(Min CF=0.5) 1 CR_LGRADE_L 0.69233 0.967124 0.764938 2 CD_MGRADE_L 0.546624 0.985402 0.895627 3 RT_HGRADE_L 0.446809 0.966771 0.762413 4 CR_L ∩ CD_M GRADE_L 0.518934 1 1 5 CR_L ∩ RT_H GRADE_L 0.446809 0.966771 0.762413 6 CR_L ∩ AR_H GRADE_L 0.69233 0.967124 0.764938 7 CR_M ∩ RT_H GRADE_L 0.273413 1 1 8 CD_M ∩ AR_H GRADE_L 0.546624 0.985402 0.895627 9 RT_H ∩ AR_H GRADE_L 0.446809 0.966771 0.762413 10 CR_L ∩ CD_M ∩ RT_H GRADE_L 0.273413 1 1 11 CR_L ∩ CD_M ∩ AR_H GRADE_L 0.518934 1 1 12 CR_L ∩ RT_H ∩ AR_H GRADE_L 0.446809 0.966771 0.762413 13 CD_M ∩ RT_H ∩ AR_H GRADE_L 0.273413 1 1 14 CR_L ∩ CD_M ∩ RT_H ∩ AR_H GRADE_L 0.273413 1 1 15 CR_MGRADE_M 0.530424 0.930341 0.713427 16 RT_MGRADE_M 0.380117 0.900504 0.590679 17 CR_M ∩ CD_VH GRADE_M 0.241811 0.948051 0.786285 18 CR_M ∩ RT_M GRADE_M 0.285976 0.935708 0.735505 19 CR_M ∩ AR_H GRADE_M 0.530424 0.930341 0.713427 20 RT_M ∩ AR_H GRADE_M 0.380117 0.900504 0.590679 21 CR_M ∩ CD_VH∩AR_HGRADE_M 0.241811 0.948051 0.786285 22 CR_M ∩ RT_M ∩ AR_H GRADE_M 0.285976 0.935708 0.735505 23 CR_ H GRADE_H 0.555071 0.916925 0.613411 24 CD_ VH GRADE_H 0.383544 0.916144 0.609776 25 RT_ M GRADE_H 0.264558 0.917956 0.618208
26 CR_ H∩ CD_VH GRADE_H 0.264974 0.96196 0.822979 27 CR_ H∩ RT_M GRADE_H 0.215576 0.943127 0.735342 28 CR_ H∩ AR_H GRADE_H 0.555071 0.916925 0.613411 29 CD_ VH∩ AR_H GRADE_H 0.383544 0.916144 0.609776 30 RT_ M∩ AR_H GRADE_H 0.264558 0.917956 0.618208 31 CR_ H∩ CD_VH ∩ AR_HGRADE_H 0.264974 0.96196 0.822979 32 CR_ H∩ RT_M ∩ AR_H GRADE_H 0.215576 0.943127 0.735342 33 CR_ VH GRADE_VH 0.556584 0.967693 0.825014 34 RT_ VL GRADE_VH 0.386925 0.930153 0.621686 35 CR_ VH ∩ CD_H GRADE_VH 0.266175 0.964644 0.808503 36 CR_ VH ∩ RT _VLGRADE_VH 0.360335 0.960131 0.784057 37 CR_ VH ∩ AR_HGRADE_VH 0.556584 0.967693 0.825014 38 RT_ VL ∩ AR_HGRADE_VH 0.386925 0.930153 0.621686 39 CR_ VH∩CD_H∩AR_HGRADE_VH 0.266175 0.964644 0.808503 40 CR_VH∩RT_VL∩AR_HGRADE_VH 0.360335 0.960131 0.784057
3.3 The Implemented Learning Performance Assessment Tools
3.3.1 The teacher side formative assessment tool
Figures 6(a) thru 6(k) display the proposed teacher formative assessment tool implemented on the PDA to support teachers to perform formative assessment in a computer classroom with Internet for supporting web-based learning. Before using the formative assessment tool, teachers have to register their user accounts and passwords in advance. Figure 6(a) shows the user login interface. After a user logins the mobile assessment tool by legal accounts, the user menu with two functions is displayed as Fig. 6(b) for teachers. The first function is to view the detailed learning statuses of individual learners on the PELS, and the second function is to perform the formative assessment in the classroom with computer-assisted learning.
In Fig. 6(b), if the second function is selected, then teachers can assess learning statuses of individual learners including attendance statuses, concentration degree, question & answer responses, and learning comments. Figure 6(c) shows the interface for assessing the attendance statuses of learners. Figure 6(d) displays the interface for recording learners’ question & answer responses during learning processes. Figure 6(e) shows the interface that can assist teachers to evaluate the concentration degrees of individual learners. In Fig. 6(f), several default comments about learners’ performances can be selected for assessing the learning statuses of individual learners. In addition, these default comments can also be edited by teachers. Figure 6(g) illustrates the interface for editing learning comments as positive or negative. In other words, each teacher can freely create his/ her own comments that appropriately characterize his/her learners.
If the first button shown as Fig. 6(b) is selected, then teachers can view the comprehensive degree of each courseware for individual learners through the interface shown as Fig. 6(h). Figure 6(i) displays the interface for viewing the variances of learners’ learning abilities during learning processes. Furthermore, each learner has to take a test after finishing the learning process on the PELS, and then the tests results are stored in the user profile database. Figure 6(j) displays the interface for viewing learners’ test scores. The interface makes teachers understand learners’ learning effects on the PELS and this function is also helpful to judge whether remedy learning is
needed. Finally, the learning portfolios based on the considered learning factors gathered by PELS system and PDA-based teacher assessment tool were utilized to mine learner’s learning performance assessment rules. Figure 6(k) shows the discovered learning rules influencing learners’ learning performances. In conclusion, the proposed teacher side formative assessment tool offers assessing information related to learners’ learning statuses on the PELS as well as provides a friendly user interface for assessing learners’ learning processes by PDA. Using the tool, teachers not only can monitor learners’ learning statuses, but also can know how to guide more effectively learning.
(a) User login interface (b) Menu of learning performance assessment tool
(c) The interface for assessing the attendance statuses of learners
(d) The interface for recording learners’ Q & A responses
(e) The interface for recording learners’ concentration degree during learning
processes
(f) The interface for giving learners’ learning comments
(g) The interface for editing learning comments as positive or negative
(h) The interface for viewing the difficulty levels of courseware from learners’ feedback
responses
(i) The interface for viewing the variances of learners’ learning abilities assessed by the proposed PELS during learning processes
(j) The interface for viewing learners’ test scores
(k) The interface for viewing the discovered learning performance assessment rules Figure 6. The implemented mobile formative assessment tool for teachers
3.3.2 The learner side formative assessment tool
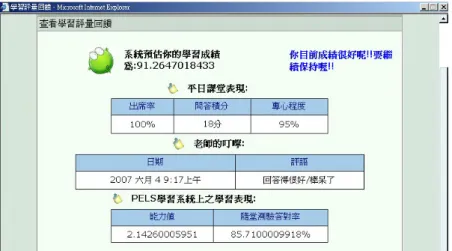
Figures 7(a) and 7(b) present the feedback interface of learning performance assessment for individual learners on the PELS. In Fig. 7(a), the learning feedback assessed by the teacher side formative assessment tool can help each learner to adjust his/her learning strategy during learning processes. In actual teaching scene, the information of learning feedback was first explained by the teacher to confirm that each learner understood the feedback information meaning. Initially, the system inferred the final learning score according to the discovered formative assessment fuzzy rules automatically. The inferred score was conveyed to individual learner, thus reminding the learner with low learning score to study hard in the next learning stage. Next, the learning behaviors in the classroom with computer-assisted learning including the attendance rate, accumulated score of question and answer responses, accumulated score of teacher’s comments were showed to individual learner through the feedback interface on PELS. In this work, these learning portfolios recorded by teacher through PDA are integrated with learning portfolios gathered by PELS to progress the formative assessment. These formative assessment outcomes are helpful to illustrate the learning pictures of the learning process. Besides, learner ability and correct response rate of randomly selecting testing questions were also important messages for each learner. Each learner can use the information to view his/her final learning states and make his/her learning better. Finally, Fig. 7(b) displays the learning rules associated with five grade levels involving “very high score”, “high score”, “moderate score”, “low score” and “very low score”. Learners could select different grade levels to look at related learning rules and find out key learning factors influencing the learning performance.
(a) Learning feedback about learning behavior of individual learners from teacher formative assessment
(b) The discovered learning performance rules
Figure 7. The implemented feedback interface for the discovered learning performance assessment rules on PELS
3.4 Experimental Design
The participants of this study were recruited from two intact three-grade classes of Taipei County Jee-May Elementary School. There are 35 learners in the experimental group and 34 learners in the control group, ranging in age from 9 to 11 years old. The experimental group received a two-week mathematical courseware learning in a computer classroom using PELS with learning feedback of formative assessment during learning processes. In contrast with the experimental group, the control group received the same mathematical courseware by PELS without learning feedback of formative assessment during learning processes.
The pretest-posttest nonequivalent group design of quasi-experimental method was adopted for investigating the promotion of learning performance in the study. Its purpose was to assess whether learning feedback of formative assessment contributes a significant positive effect on the promotion of learners’ learning performances and learning attitude. The duration of this study lasted two weeks.
Table 7 displays the procedures of quasi-experimental design method for assessing learning performance of both the participating groups in the study. Both the learning modes perform the pretest and posttest for comparing the difference of learning performance before and after learning.
Table 7. The procedures of quasi-experimental design method
Pre-test Treatment Post-test
1
O X O3
O2 C O4
1
O and O represent the pre-test processes; 2 O and 3 O are the post-test processes; X and 4 C stand for the experimental and control groups performed by learning mode with and without learning feedback of formative assessment, respectively.
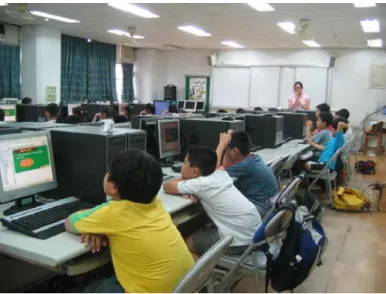
In the experiment, the teacher first detailed the system operation procedures for all participators in the first hour, and then all participators logged in the system to perform the learning process. Figure 8 exhibits the actual teaching scene at Taipei County Jee-May Elementary School in the experiment.
Figure 8. The actual teaching scene at Taipei County Jee-May Elementary School
3.5
System Evaluation
Three evaluating procedures including a pre-test, post-test, and questionnaire were performed to assess the learning outcomes for the proposed system. That is, the system evaluation in the study includes two parts which are the learning performance promotion of learners and questionnaire results from learner’s feedback responses.
3.5.1 Learning performance evaluation
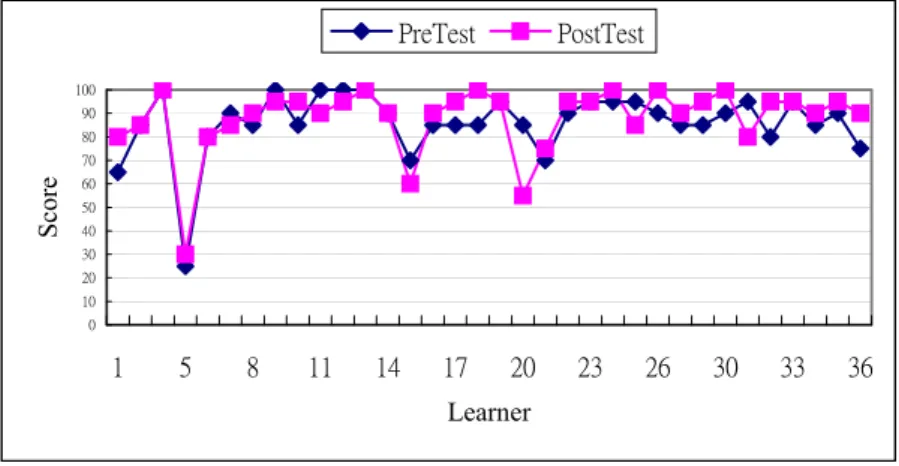
Table 8 displays the comparison result of learning performance for both the learning modes. The results reveal that 54.29% learners who learnt by the proposed personalized e-learning system with formative assessment feedback have progressive score, but only 52.94% learners who learnt by the proposed personalized e-learning system without formative assessment feedback have progressive score. Additionally, Fig. 9 indicates that most learners have obvious progress in score according to the score distributions of the experimental group. In contrast with the experimental group, Fig.10 shows that the progressive score of the control group is not so obvious like the
experimental group. Besides, the information is beneficial to further analyzing the learning performance by statistics analysis method.
Table 8. Comparison result of learning performance for both the participating groups conducting different learning modes
Learning Mode Comparison Item
The Experimental Group Performing Learning
with Formative Assessment Feedback
The Control Group Performing Learning without Formative
Assessment Feedback Number of learners 35 34 Number of learners with progress score 19 (54.29%) 18 (52.94%) Number of learners with retrogression score 6 (17.14%) 8(23.53%) Number of learners with constant score 10 (28.57%) 8 (23.53%)
0 10 20 30 40 50 60 70 80 90 100 1 4 7 10 13 16 19 22 25 28 31 34 Learner Score PreTest PostTest
Figure 9. The score distributions of the experimental group with formative assessment feedback for both the pre-test and post-test
0 10 20 30 40 50 60 70 80 90 100 1 5 8 11 14 17 20 23 26 30 33 36 Learner Score PreTest PostTest
Figure 10. The score distributions of the control group without formative assessment feedback for both the pre-test and post-test
In the work, the independent samples t-test and matched-pairs t-tests were used to analyze whether the experimental group with formative assessment feedback or the control group without formative assessment feedback provides benefits in terms of learning performance promotion based on pretest and posttest scores. First, the gathered pre-test and post-test scores were analyzed using
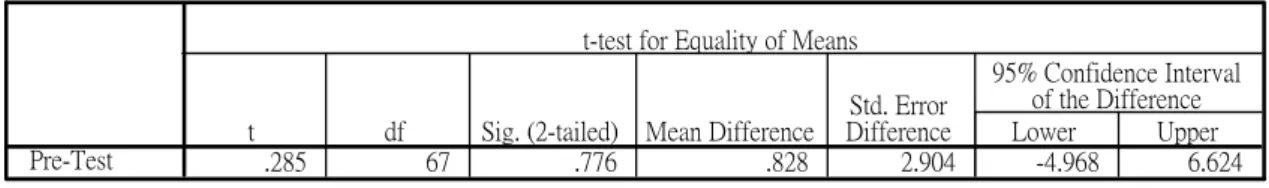
the independent samples t-test. The SPSS analysis result of pre-test is presented in Table 9. The results indicate that the mean and standard deviation of the experimental group on the pre-test score is 86.86 and 9.858 points, respectively. The mean and standard deviation of the control group on the pre-test score is 86.03 and 13.969 points. Since these two participating groups do not reach significant difference on the pre-test score (t=-.285, p = .776 > 0.05), the mathematics abilities of two participating groups in the “Fraction” unit can be viewed as equivalent before performing the experiment process.
Table 9. The independent samples T-test of pre-test between two participating groups (a) Group statistics
35 86.86 9.858 1.666 34 86.03 13.969 2.396 Group
Exp. Ctrl.
Pretest N Mean Std. Deviation Std. Error Mean
(b) Independent samples t-test
.285 67 .776 .828 2.904 -4.968 6.624 Pre-Test
t df Sig. (2-tailed) Mean Difference DifferenceStd. Error Lower Upper 95% Confidence Interval
of the Difference t-test for Equality of Means
Next, the SPSS analysis result of post-test is presented in Table 10. The post-test of two participating groups were also analyzed using independent-samples t-test and the mean scores of the experimental and control groups on the post-test score are 91.86 and 87.94, respectively. The t-test result (t=1.417, p=. 163 > 0.05) shows that two participating groups do not reach significant difference on the post-test score. Thus, this study further compared the pre-test and post-test for each group using the paired-samples t-test. Table 11 shows the result of the paired samples t-test of the experimental group. In the experimental result, the difference of the mean scores of pre-test and post-test is -5 and the results of paired-samples t-test reach the significant level (t= -3.3, p=. 002 < 0.05). In other words, the promotion of learning performance in the experimental group is significant and the mean score increases 5 points.
Table 10. The independent samples t-test of post-test between two groups (a) Group statistics
35 91.86 6.869 1.161 34 87.94 14.622 2.508 Group Exp. Ctrl. Posttest
N Mean Std. Deviation Std. Error Mean
(b) Independent samples t-test
p p
1.417 46.587 .163 3.916 2.763 -1.645 9.477 Post-Test
t df Sig. (2-tailed) Mean Difference DifferenceStd. Error Lower Upper 95% Confidence Interval
of the Difference t-test for Equality of Means
Table 11. The paired samples t-test of the experimental group (a)Paired samples statistics
86.86 35 9.858 1.666 91.86 35 6.869 1.161 Pretest
Posttest
Pair 1 Mean N Std. Deviation Std. Error Mean
(b)Paired samples t-test
Paired Samples Test
-5.000 8.911 1.506 -8.061 -1.939 -3.3 34 .002 Pretest-Posttest Pair 1 Mean DeviationStd. Std. Error
Mean Lower Upper 95% Confidence Interval of the
Difference Paired Differences
t df (2-tailed)Sig.
Next, the pre-test and post-test scores of the control group are also assessed using the paired-samples t-test. Table 12 displays the result of the paired samples t-test of the control group. In the experimental result, the difference of the mean scores between pre-test and post-test is -1.91 and the result of paired-samples t-test (t=-1.169, p=. 251 > 0.05) shows that the control group does not achieve significant difference after performing learning mode without formative assessment feedback. Besides, the testing score in the experimental group is 5 points higher than that in the control group. This result can prove that the learning performance of the learning mode with formative assessment feedback is superior to the learning mode without formative assessment feedback.
Table 12. The paired samples t-test of the control group (a) Paired samples statistics
86.03 34 13.969 2.396 87.94 34 14.622 2.508 Pretes t Postte st Pair 1
Mean N Std. Deviation Std. Error Mean
(b) Paired samples t-test
Paired Samples Test
-1.91 9.536 1.635 -5.239 1.415 -1.169 33 .251 Pretest-Posttest Pair 1 Mean DeviationStd. Std. Error
Mean Lower Upper 95% Confidence Interval of the
Difference Paired Differences
t df (2-tailed)Sig.
Moreover, to investigate whether the proposed learning modes with and without formative assessment feedback provide different learning performances for learners with various mathematics abilities, the learners of each class in both the participating groups were divided into three groups based on their pre-test scores. The learners whose pre-test scores are above 27% in each class are viewed as high score group, and the learners whose pre-test scores are below 27% are viewed as low score group. The remaining learners are viewed as moderate score group. Similarly, the paired-samples t-test was employed to analyze these three groups with different learning abilities in both the experimental and control groups, respectively. Table 13 shows the result of the paired-samples t-test. In the experimental group, the progress scores of the learners with high, moderate and low score are –2.00, 5.00 and 12.778, respectively. Besides, the t- test results of the
three different score groups of the experimental group (i.e. the high score group: t=-1.309, p=.223 > 0.05; the moderate score group: t=-3.464, p=.003 < 0.05; the low score group: t=-3.507, p=.008 < 0.05) show that the score progress of the moderate and low score groups reaches significant level after performing the learning mode with formative assessment feedback, but the high score group does not reach significant level. Nevertheless, all the t-test results of the three different score groups in the control group do not reach significant level. In conclusion, the proposed learning mode with formative assessment feedback indeed surpasses the learning mode without formative assessment feedback because it can direct learners to adjust their learning states based on immediate learning performance result during learning processes.
Table 13. The paired samples t-test result of three groups with various learning abilities for both the experimental and control groups
Pre-test Post-test Paired Difference Learning abilities Statistics Class Mean Std. deviatio n Mean deviationStd. Mean (pretest-post test) Std. deviation t Sig. 306(Exp.) 96.50 2.415 94.50 4.972 2.000 4.830 1.309 .223 High score group 305 (Ctrl.) 97.27 2.611 93.64 6.360 3.636 5.954 2.025 .070 306(Exp.) 88.13 2.500 93.13 5.439 -5.000 5.774 -3.464 .003* Moderate score group 305 (Ctrl.) 90.00 .000 94.17 5.845 -4.167 5.845 -1.746 .141 306(Exp.) 73.89 9.280 86.67 8.660 -12.778 10.929 -3.507 .008* Low score group 305 (Ctrl.) 77.35 15.012 82.06 18.205 -4.706 11.106 -1.747 .100
3.5.2 Questionnaire analysis
To evaluate learners’ satisfaction degree for the learning mode and learning system, a questionnaire which involves twenty-four questions distinguished five various question types was designed to measure whether the provided services in the PELS with formative assessment feedback satisfy the real requirements of most learners. The five question types contain the personal information about learner’s learning experience using the computer, the convenience of the system operation, the learners’ learning attitude towards using the proposed learning system, the benefits related to the proposed learning mode with formative learning feedback, and the improvement of learner’s mathematics abilities and confidence after using the proposed learning mode. Table 14 gives a summarization of the descriptions of question types. Totally, there are 35 learners in the experimental group and 34 learners in the control group to participate in the experiment and they were invited to fill out this questionnaire after attending the two weeks’ learning activity. The evaluation results of satisfaction degree are listed in Table 15. To conveniently observe the evaluating results, the investigation results of “strongly agreed” and “agreed” are merged as “approved”, and the investigation results of “strongly disagreed” and “disagreed” are merged as “disapproved”.
Table 14. The descriptions of question types
Question Type The number of
questions Description
Personal Information 3 To get the personal information about learners who attend the learning activity
System Operation 5 Questions related to the user interface and the content of learning materials
Learning Attitude 6 To investigate whether the system can enhance learners’ learning motivation or interests or not
Learning Mode 6 Questions related to the proposed PELS system with formative assessment feedback responses for individual learners
Learning Performance 4 To explore whether the learning mode can promote their learning achievements and confidence or not
The investigation results of the personal information are listed in Table 15(a) and it indicates 94.29% learners of the experimental group and 94.12% learners of the control group have computers at home. Additionally, 97.14% learners of the experimental group and 94.12% learners of the control group like to use computers, but only about a half of learners of both the groups respectively used the learning system through the Internet. From Table 15(b), the satisfaction degrees of “approved” of system operation of the experimental group are 84% and that of the control group are 77.65%. Moreover, Table 15(c) specifies the 84.29% learners of the experimental group and 76.47% learners of the control group agreed that the proposed learning system can promote their learning motivation. Finally, in terms of the learning mode and learning performance, the results are summarized in Tables 15(d) and (e). Most learners in two participating groups agreed that the learning records and learning feedback provide benefit in terms of the promotion of the learning performance. 84.97% learners of the experimental group and 72.06% learners of the control group believed that the proposed learning system can improve their confidence in learning and get good grades in the learning.
Table 15. The satisfaction evaluation results of questionnaire (a) The investigation results of the personal information
(b) The investigation results of the system operation
Satisfaction Degree
The Experimental Group The Control Group
Question Type Question Strongly Agreed Agreed No OpinionDisagreed Strongly Disagreed Strongly Agreed Agreed No Opinion Disagreed Strongly Disagreed The Number of Learners
The Experiment Group The Control Group
Question Type Question
Yes No Yes No
33 2 32 2 Do you have any computer at your home?
94.29% 5.71% 94.12% 5.88% 34 1 32 2 Do you like to use the computer?
97.14% 2.86% 94.12% 5.88% 15 20 17 17
Personal Information
Have you ever used any web site for learning?