1. Introduction
With limited natural resources, about 99%
required energy of Taiwan is imported, putting uncertainties on the economy and energy safety.
Developing renewable energy will alleviate such situation. Among the potential options, the wind energy and photovoltaic (PV) are the most practical techniques. For wind energy, project for the offshore wind farm has been proposed by Bureau of Energy with the goal of 5.5 GW by 2025. The onshore installation capacity is 686 MW, with the goal of 1,200 at 2025. Historical power production by wind and PV are listed in Figure 1. Wind energy was managed by Taiwan Power Company (TPC) since 2001 as shown in Figure 1, while purchased wind power initialized in 2006 with similar trend
in growth rate. Stagnation was observed in wind energy near 2011, indicating the saturation of large onshore wind turbine. For the case of PV, it began from 2008 for TPC and keeping relatively low rate comparing the purchased one. Rapid increase was observed for the purchased PV since 2011.
The growth rate of purchased PV is still strong until 2016, but it is expected to become stable within few years due to the limited available land for installation of PV. The offshore wind power will become the primary source for the growth of renewable energy in the future for Taiwan.
As mentioned above, locations suitable for the large and onshore wind turbine have almost been installed. Large onshore wind turbines are installed along the coastal line of western Taiwan. Thus, further installation should shift to the inland and
Volume 5, No. 3, September 2018, pp. 217-232
Wind Resources Assessment and Micro-Siting in Institute of Nuclear Energy Research
Ming-Hong Chen1*
ABSTRACT
The developed wind atlas in the present study would be useful for high resolution evaluation and micro-sitting to allocate the suitable spot for the installation of wind turbine. The comprehensive comparison was made, and the locations of maximum wind speed were also identified. Large deviation was observed depended on the investigated regions. Besides the cases of Hualien and Taitung, the results in the North, Central and South region were consistent, and differences were acceptable for the prediction of wind resources. With the developed turbine generator model, the annual electricity production (AEP) and the optimized deployment of wind farm can be calculated by the proposed model. The methodology for micro-siting has also been presented. Commercial wind turbine systems were virtually installed on top of the selected buildings of the renewable energy campus of Institute of Nuclear Energy Research. The corresponding mean wind velocity and generated AEP were calculated and compared.
Keywords: wind power, wind atlas, micro-siting, wind turbine
Received Date: April 23, 2018 Revised Date: August 15, 2018 Accepted Date: August 16, 2018
1 Assistant Researcher, Mechanical and System Engineering Program, Institute of Nuclear Energy Research.
* Corresponding Author, Phone: +886-3-4711400#3351, E-mail: [email protected]
urban region.
The features of weather in Taiwan include the Asia monsoon and tropical cyclones in summer time and northeast trade wind in winter time, leading to strong winds in many places.
In the inland and urban region, the topography is generally more complex, and it is not easy to find the place with good potential to install wind turbine. Therefore, reliable assessment for the wind resource is paramount for decision making.
In the present study, the software Wind Atlas Analysis and Application Program (WAsP) (DTU Risoe, 2012) is employed to develop the wind atlas of Taiwan. By including the digital map of the analyzed region and local weather data, the wind resources can be evaluated by the proposed model. The public wind atlas from the website of Thousand Wind Turbines Project is introduced (Industrial Technology Research Institute, 2014) for the comparison and validation.
Since the grid system with higher resolution is introduced, this model cannot include the entire Taiwan in one calculation. The analysis will be
made by dividing the whole map into several regions, i.e., north, central, south, east and offshore islands. Each analyzing case includes the digital map, local weather information for evaluation of wind resources. The developed wind atlas will be useful for high resolution evaluation and micro-sitting to allocate the suitable spot for the installation of wind turbine. For the evaluation of annual electricity production (AEP) in the interested regions, the characteristics curve (power curve) of the Voluntary Product Certification (VPC) qualified small wind turbine model will be developed and included.
1.1 Literature review
Wi n d r e s o u r c e s e v a l u a t i o n h a s b e e n conducted for decades and there have been several kinds of commercial software available. Such programs can be classified as the simple-linear and detail-nonlinear model. For the simple-linear (such as WAsP) model, the overall trend and distribution of wind resources can be obtained in short period of time. For the detail-nonlinear Fig. 1. Power production by wind turbine and PV in Taiwan (Taipower, 2017).
model (such computational fluid dynamics, CFD), sophisticated pre-process of the numerical model and large amount of computational resources are required. The comparison of the linear and non- linear model has been made in several studies in the past. Hillring and Krieg (1998) developed the wind atlas by WAsP for a region in Sweden. As the preliminary study, the resolution was low, and rough indication can be obtained by this analysis.
They also pointed out that further study with better resolution should be made as the reference for policy making process. Durak and En (2002) used WAsP to virtually install 20 wind turbines with rated power of 600 kW in a wind farm of
Turkey with average distance of 150-200 m. They also suggested that the AEP evaluated by WAsP should be reduced by 10% due to the effect of the comprehensive loss. The yielding AEP with the effect of loss was 31 ~ 41 GWh. Chang et al. (2003) firstly evaluated the wind resources for Taiwan in 2003 by the two-stage procedure. By comparing three wind turbine characteristics (available factor, capacity factor and turbine efficiency), they pointed out four locations with good wind resources, i.e., Wuchi, Lanyu, Tungchitao, and Hengchun, as shown in Figure 2.
Ozerdem and Turkeli (2005) evaluated the wind resources of Turkey by the software of WAsP
Fig. 2. Four locations with good wind resources by Chang et al. (2003)
and WindPRO. Wind turbines with capacity from 600 to 1,500 kW were employed for the evaluation of AEP and micro-sitting. Berge et al. (2006) compared the results by 2 CFD models and WAsP, and no improvement was observed. Therefore, with simplicity and weakness for complicated terrain, reliable results still can be obtained by using WAsP.
Palma et al. (2008) evaluated the wind resources in the location with complex terrain by using the linear (WAsP) and non-linear (CFD) modeling method. Results showed that in the location with complex terrain (i.e., cliff in this study), the non- linear CFD modeling method was superior to linear (WAsP) model. Dehmas et al. (2011) built the wind atlas by WAsP for a wind farm in Algeria.
Five wind turbines were employed in the model to evaluate the AEP of the investigated wind farm. Furthermore, the economic and carbon- reduction analysis were also conducted. Results showed that the simple payback was about 13.3 years, and the carbon reduction was 8,588 tons/
year. Carvalho et al. (2013) evaluated the wind resources by Weather Research and Forecasting (WRF) and WAsP in two sites located in Portugal with complex terrain. Results showed that the output data by the mesoscale model shouldn’t be employed mainly due to the lower resolution of the terrain data. Fang (2014) assessed the wind energy along the west coast line of Taiwan and Penghu archipelago using WAsP. Averaged wind speed and power density with different heights among the investigated locations were presented.
The average wind speed in the area of Penghu archipelago was above 10 m/s and power density was above 1,400 W/m2. By installing 180 wind turbines of 3 MW on the offshore wind farm of Changhua, the resulting AEP was about 11.3 GWh with corresponding income of each wind turbine about 60 million NTD based on the offshore
wind power feed-in tariff of Taiwan. Waewsak et al. (2014) built the wind atlas along the coastal regions of Thailand. Optimization was conducted with parameters of wind turbine capacity and inter-distance of each turbine. Resulted showed that the average wind speed on the height of 120 m in the coastal regions was about 3.3 ~ 5.3 m/s, which is not good when comparing the value of Taiwan (at least 9 m/s above). With the scope of 90 MW for the investigated wind farm, the calculated AEP was about 170 GWh/year.
Lennard et al. (2015) employed the Karlsruhe Atmospheric Mesoscale Model (KAMM) and WRF to compare the generalized wind climate by WAsP for South Africa. Results showed that the bias among the investigated regions was about 10% by KAMM-based method, while it was about 5% by WRF-based method. This study also point out that the WRF model is better suited in the prediction of wind resources for the regions with complex topography with the expense of longer computational time. Kim and Lim (2017) used the WAsP and WindPRO to evaluate the inaccuracy when evaluating the AEP of an offshore wind farm. Results showed that the prediction error could be reduced by increasing the height of the wind measuring tower and the effect of roughness of the analyzed island was minor on the prediction of AEP. Ayala et al. (2017) evaluated the AEP of a wind farm in Ecuador by using the software of Meteodyn and WAsP. Results showed that both model predicted lower AEP comparing to the actual value. The underestimation was 7% when using Meteodyn, while it was 8.9% for WAsP. The non-linear, CFD-based software-Meteodyn slightly improved the prediction of AEP of a wind farm, but it required more efforts to setup sophisticated model and computational resources.
From the above review, it can be concluded
that the software-WAsP has been employed for the analysis of wind resources for many years in several countries. Case studies were made in Europe and Asia, proofing its credibility.
Comparing to the computational resources demanded CFD model, the WAsP is relatively simple and reliable results can be obtained except the regions with complex terrain. For the case study of Taiwan, a simplified mathematical model was proposed. Later, the wind atlas of western and coastal region of Taiwan was made by WAsP with only one weather data. For regions far away from the observation side (north and south end of Taiwan), the reliability of the calculated results might be problematic. In the present study, the wind atlas of the divided region of Taiwan will be provided in smaller area with local observation data. Results can be employed for planning of wind farm and micro-sitting.
2. Numerical Model
In this study, the commercial software- WAsP is employed to evaluate the wind resource and develop the wind atlas for Taiwan. This software was proposed firstly by Wind Energy and Atmospheric Physics Department at Risø National Laboratory in 1987. It is designed to process wind data and create wind atlas. The climate estimation, prediction of wind power and wind turbine siting can also be made by this software.
With implementation in more than 100 countries around the world for decades, WAsP has become the generally accepted tool for the assessment of wind sources and turbine siting.
From the literature review, it has been presented that the error of the calculation by WAsP is lower than 10%. Nevertheless, reliable input data should be provided to ensure results with
good quality. Weather data and terrain map are the most important information for the evaluation by WAsP. The hourly averaged wind speed and corresponding wind direction collected by the observation site are transformed into statistic data by WAsP Climate Analyst (WACA). The terrain information is edited by the WAsP Map Editor to generate the digital map file for further calculation.
By importing time sequential wind speed and direction, the statistical wind data can be obtained and expressed by the Weibull probability density distribution function in Equation (1)
(1) where A is the scale parameter, and k is the shape parameter.
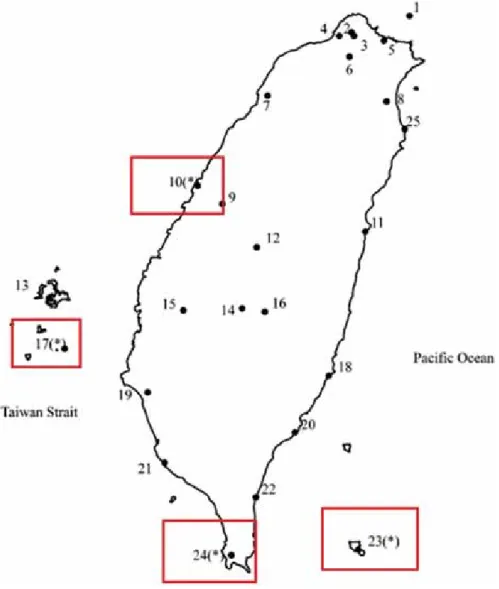
In this study, the wind atlas of Taiwan is divided into several regions (Figure 3). In each region, local weather data is incorporated with digital map to evaluate the wind resources.
The Shuttle Radar Terrain Mission (SRTM) 90 m Digital Elevation Data is employed in this study, which is obtained from The Consortium of International Agricultural Research Center- the Consortium of Spatial Information (CGIAR- CSI). The SRTM files were made by NASA (National Aeronautics and Space Administration, NASA) and it had some void problem. These no- data voids were processed by CGIAR-CSI from the original SRTM DEM (digital elevation model, DEM). The comparison was made for the digital elevation model to ensure the quality (Jarvis et al., 2004). The satellite image from Google Earth was employed to draw the roughness of analyzed terrain. For the comparison and validation, the public wind atlas from the website of Thousand Wind Turbines Project was introduced (Industrial Technology Research Institute, 2014), where the evaluation of wind resources was conducted by the
( )
⎥⎥⎦
⎤
⎢⎢
⎣
⎡ ⎟
⎠
⎜ ⎞
⎝
−⎛
⎟⎠
⎜ ⎞
⎝
⎟⎛
⎠
⎜ ⎞
⎝
=⎛ −
k k
w A
V A
V A V k
p exp
1
open sources code-WRF with resolution of 2 km
× 2 km. In this study, the micro-scale based model by WAsP is employed with better grid resolution to develop the wind atlas of Taiwan.
3. Results and discussion
The analysis is made by dividing the whole map into several regions, i.e., north, central, south, east and offshore islands. Each analyzing case includes the digital map and the local weather information for evaluation of wind resources. For the evaluation of AEP in the interested regions, the characteristics curve (power curve and thrust coefficient) of the VPC proofed small wind turbines are developed and included. Due to the limitation of the length, those digital maps and weather data in Central, Southern and Eastern
regions were not presented in this article. However, the simulation models in those regions were successfully built by including the digital map and wind rose deduced from the local measurement.
Comprehensive comparison was also made accordingly with literature data. The developed wind atlas will be useful for high resolution evaluation and micro-sitting to allocate the suitable spot for the installation of wind turbine.
3.1 Northern Taiwan
For the northern Taiwan, the cities from Keelung, Taipei, Miaoli and Yilan are included in the analysis as shown in Figure 4. Measured weather data from Zhuzihu is employed, and its wind rose information is presented in Figure 5. Primary wind comes from north-east with frequencies larger than 10%. At the angle of 30 Fig. 3. Map for the analyzed regions for Taiwan (by author).
Fig. 4. Map for the analyzed Northern Taiwan (by author).
Fig. 5. Wind rose and statistical data for Zhuzihu (by author).
degree, the average wind speed is about 3.58 m/s, and it is about 2.64 m/s at the angle of 60 degree.
The height of measurement site is about 10 m, the overall average wind speed is 2.33 m/s, and the power density is 30 W/m2.
Total energy produced by the designated wind turbine system during a one-year period is generally referred as the AEP with unit of MWh (for small scale wind turbine system) or GWh (for large scale wind turbine system). In the calculation of AEP, it is assumed that the availability of the wind turbine system is 100%, and the losses due to the mechanical and electrical transmission are not considered. The power produced by the employed wind turbine depends on the speed of coming wind.
The wind speed at the hub height is usually used as a reference value to describe the performance of a wind turbine. The power curve is defined as the power generated within the operable range of hub height wind speed (from cut-in to cut-out). In Figure 6, the power curve of the employed wind turbine (KE4800) is plotted as a piecewise linear curve (blue line), with unit of kW for the generated power, and meter per second for the reference wind
speed. The generated power increases with the wind speed as the wind speed is larger than the cut- in value of the wind turbine system. The maximum value of power is also called the rated-power of the wind turbine system. For the wind speed larger than the cut-out value, the turbine will be stopped to prevent the damage on the turbine system.
The ratio of the thrust force upon the wind turbine system and the dynamic force of air is generally referred as the thrust coefficient. This dimensionless coefficient indicates how much the wind turbine system affects the fluid flow. The thrust coefficient for the employed wind turbine (KE4800) is described in Figure 6 (gray line). The data for the thrust coefficient can be measured via the tower bending moment or estimated by a rotor simulation program. With the given data of the thrust coefficient, the wake loss of the investigated wind farm can be estimated. By including the wake loss of the modeled wind farm, the calculated AEP will be reasonably reduced. In the present study, these two characteristic curves (power curve and thrust coefficient) are built by the WAsP-Turbine editor as shown in Figure 6.
Fig. 6. Power curve and thrust coefficient of the turbine of KE4800 (by author).
The schematic diagram of KE4800 is sown in Figure 7.
R e s u l t s b y t h e e v a l u a t i o n w e r e t h e n overlapped with google map to identify the spots with feasible wind resources as shown in Figure 8.
Three spots were identified with higher averaged wind speed up to 9.5 m/s at the height of 80 m. By the calculation of WAsP, the region of Dream Lake and Siangtian Mountain were identified with better wind resources. The AEP could be up to 9 MWh by the 5 kW horizontal axial wind turbine in these two areas.
Results were then compared with that by WRF (Industrial Technology Research Institute, 2014) where the analysis was made with resolution of 2 km × 2 km. As shown in Figure 9, a large region in Beitou District was indicated with higher wind speed. The overall trend is similar with the results by WAsP of the present study. However, sports with higher wind speed can only be found using the model with higher resolution. Wind resources assessments for other region indicated in Figure 3 were conducted. Detail results and comparison will not be able to be presented in this article. Nevertheless, comprehensive comparison Fig. 7. Schematic diagram of KE4800 (by author).
Fig. 8. Yearly averaged wind speed in Beitou District (by author).
Fig. 9. Yearly averaged wind speed in Taipei City by WRF (Industrial Technology Research Institute, 2014).
with available reference data for selected locations was addressed in the next section.
3.2 Comprehensive comparison
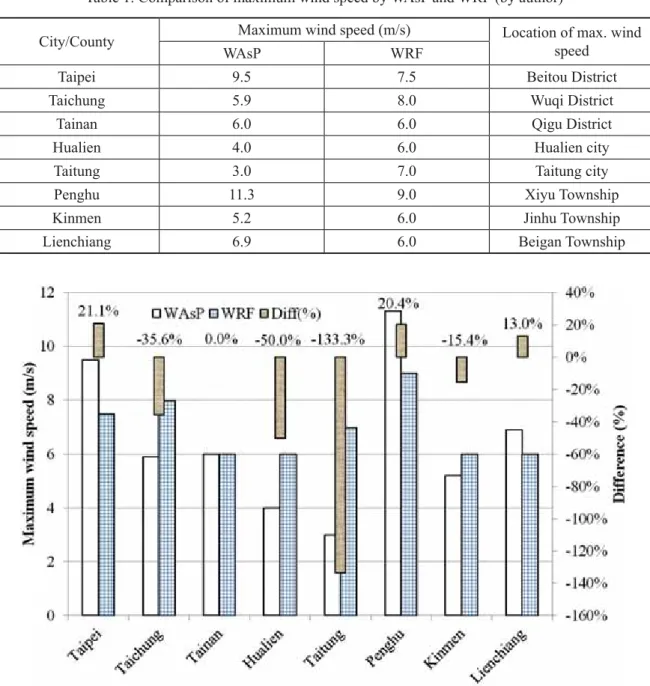
The comprehensive comparison was made as shown in Table 1. The maximum wind speeds by WAsP and WRF are compared for the investigated cities or counties. The location of the maximum wind speed was also identified.
In Figure 10, the differences between two
investigated models were also provided. Within the eight investigated cases, the most consistent value was obtained in Tainan city, while the difference is larger than 133% in Taitung County. Large deviation has been observed depended on the investigated regions. Besides the cases of Hualien and Taitung, the results in the North, Central and South region were consistent, and differences were acceptable for the prediction of wind resources.
The average wind speed for the location with
Table 1. Comparison of maximum wind speed by WAsP and WRF (by author)
City/County Maximum wind speed (m/s) Location of max. wind speed
WAsP WRF
Taipei 9.5 7.5 Beitou District
Taichung 5.9 8.0 Wuqi District
Tainan 6.0 6.0 Qigu District
Hualien 4.0 6.0 Hualien city
Taitung 3.0 7.0 Taitung city
Penghu 11.3 9.0 Xiyu Township
Kinmen 5.2 6.0 Jinhu Township
Lienchiang 6.9 6.0 Beigan Township
Fig. 10. Comparison of maximum wind speed by WAsP and WRF (by author).
largest deviation, i.e., Taitung, at the test site is 2.24 m/s. By using the power law relationship for wind profile with different exponent coefficients, the deduced wind speed at the height of 80 m is about 2.6 m/s and 3.4 m/s. The calculated value by WAsP is 3.0 m/s, while it is 6.0 m/s by WRF. Therefore, the value by WRF might be overestimated.
For the WAsP model, the digital map with higher resolution and local measured wind data are employed. Micro-sitting of high resolution can be conducted by the proposed WAsP model. For example, three spots in the Beitou District with higher wind potential are identified in Taipei City as addressed in Section 3.1. For WRF model, such sitting cannot be conducted since the resolution of the WRF model is 2 km × 2 km. One can survey via the results of WRF model with the scale of city
or county as the first step. For the second step, the evaluation by the scale of district can be conducted by the proposed WAsP model with local measured wind data. Locations with better wind resources can be identified. With the developed turbine generator model in WAsP, the AEP and optimized deployment of wind farm can be calculated by the proposed model.
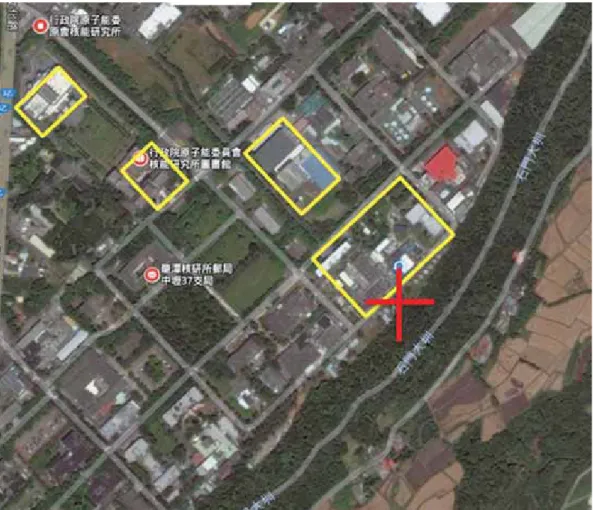
3.3 Micro-sitting in Institute of Nuclear Energy Research (INER)
In this section, micro-sitting has been conducted for the renewable energy campus of Institute of Nuclear Energy Research (INER) as indicated in Figure 11.
As indicated in Figure 11, primary buildings
Fig. 11. Renewable energy campus of INER (by author).
within the renewable energy campus of INER were modeled as rectangle boxes in WAsP. Nearby trees were also modeled with porosity of 0.5 as suggested by WAsP. The effects of obstacles by buildings and trees on the flow field, wind speed and power generation of wind turbine were calculated. In the renewable energy campus of INER, the 150 kW horizontal axial wind turbine (location indicated with cross in Figure 11) and 3 kW vertical axial wind turbine systems have been developed. For micro-siting, the 3 kW VAWT (vertical-axis wind turbine, VAWT) (DS3000) and 5 kW HAWT (horizontal-axis wind turbine, HAWT) (KE4800) will be virtually installed on
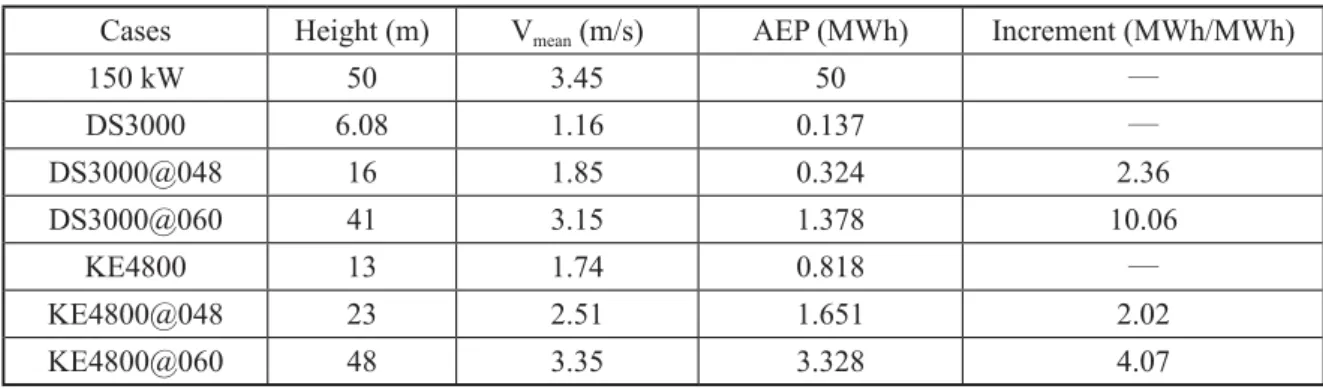
the top of some selected buildings, i.e., 048 and 060 as indicated in Figure 12. The heights for the calculated and compared sites were specified in Table 2. The mean wind velocities and AEP at different sites were calculated and compared.
Increments of AEP from original location to the top of selected buildings were also specified.
As compared in Table 2, by shifting the location of DS3000 to 048 and 060, the ratio of increment of AEP are 2.36 and 10.06, respectively.
It also indicates that the wind resource for the original location of DS3000 is not good enough for it to perform properly. For the case of KE4800, the increments are 2.02 and 4.07. When shifting
Fig. 12. Micro-siting model with obstacles (by author).
Table 2. Comparison of AEP by VAWT and HAWT for micro-sitting (by author)
Cases Height (m) Vmean (m/s) AEP (MWh) Increment (MWh/MWh)
150 kW 50 3.45 50 ʇ
DS3000 6.08 1.16 0.137 ʇ
DS3000@048 16 1.85 0.324 2.36
DS3000@060 41 3.15 1.378 10.06
KE4800 13 1.74 0.818 ʇ
KE4800@048 23 2.51 1.651 2.02
KE4800@060 48 3.35 3.328 4.07
the location from 048 to 060, the increment of AEP for KE4800 is lower than DS3000, but the generated AEP is 3.33 MWh, which is about 2.4 times larger than that of DS3000. As indicated in Table 2, larger AEP is produced by the HAWT system even though the mean velocities are comparable (3.15 m/s for DS3000 and 3.35 m/s for KE4800). Among the investigated cases, however, the highest position is 50 m for the 150 kW HAWT system, and its mean wind speed is only 3.45 m/
s, indicating the limited wind resources for the renewable energy campus of INER.
In this study, the methodology for micro- siting has been presented. Similar investigation will be conducted in the region with better wind resources in Taoyuan in the future.
4. Conclusion
The features of weather in Taiwan include the Asia monsoon and tropical cyclones in summer time and northeast trade wind in winter time, leading to strong winds in many places.
In the inland and urban region, the topography is generally more complex, and it is not easy to find the place with good potential to install wind turbine. Therefore, reliable assessment for the wind resource is paramount for decision making. In this study, the analysis was made by dividing the whole map into several regions, i.e., north, central, south, east and offshore islands.
Each analyzing case includes the digital map, local weather information for evaluation of wind resources. Due to the limitation of the length, those digital maps and weather data in Central, Southern and Eastern regions were not presented in this article. However, the simulation models in those regions were successfully built by including the digital map and wind rose deduced from the
local measurement. Comprehensive comparison was also made accordingly with literature data as shown in Table 1 and Figure 10. The major finding that the resolution of the employed digital map will greatly affect the precision of the calculated results was presented in this study. The developed wind atlas will be useful for high resolution evaluation and micro-sitting to allocate the suitable spot for the installation of wind turbine.
From the literature review, the reliability of employed WAsP has been proofed by comparing with different codes. In this study, the hourly averaged wind speed and corresponding wind direction collected by the observation site are transformed into statistic data by WACA. The terrain information is edited by the WAsP Map Editor to generate the digital map file for further calculation. For the comparison and validation, the public wind atlas from the website of Thousand Wind Turbines Project was introduced. The evaluation of wind resources was conducted by the open sources code-WRF with resolution of 2 km
× 2 km. In this study, the micro-scale based WAsP model was employed with better grid resolution to develop the wind atlas of Taiwan.
The comprehensive comparison was made, and the locations with the maximum wind speeds were also identified. Within the eight investigated cases, the most consistent value was obtained in Tainan city, while the difference was larger than 133% in Taitung County. Besides the cases of Hualien and Taitung, the results in the North, Central and South region were consistent, and differences were acceptable for the prediction of wind resources. Three spots in the Beitou District with higher wind potential were identified in Taipei City. For WRF model, such sitting cannot be conducted since the resolution of the WRF model is 2 km × 2 km.
Practically, one can survey via the results of WRF model as the first step. For the second step, the evaluation by the scale of district can be conducted by the proposed WAsP model. Locations with better wind resources can be identified. With the developed turbine generator model in WAsP, the AEP and optimized deployment of wind farm can be obtained by the proposed model.
The methodology for micro-siting has been presented. Commercial HAWT and VAWT systems were virtually installed on top of selected buildings of the renewable energy campus of INER. The corresponding mean wind velocities and generated A E P s w e r e c a l c u l a t e d a n d c o m p a r e d . T h e investigation will be conducted in the region with better wind resources in Taoyuan in the future.
References
Ayala, M., J. Maldonado, E. Paccha and C. Riba, 2017. “Wind Power Resource Assessment in Complex Terrain: Villonaco Case-Study Using Computational Fluid Dynamics Analysis.”
Energy Procedia 107, 41-48.
Berge, E., a. R. Gravdahl, J. Schelling, Lars Tallhaug and Ove Undheim, 2006. “Wind in Complex Terrain. A Comparison of WAsP and Two CFD-Models.” Proceedings from EWEC.
Carvalho, D., A. Rocha, C. Silva Santos and R.
Pereira, 2013. “Wind Resource Modelling in Complex Terrain Using Different Mesoscale- Microscale Coupling Techniques.” Applied Energy, 108, 493-504.
Chang, Tsang-jung, Yu-Ting Wu, Hua-Yi Hsu, Chia-Ren Chu and Chun-Min Liao, 2003.
“Assessment of Wind Characteristics and Wind Turbine Characteristics in Taiwan Assessment of Wind Characteristics and Wind Turbine Characteristics in Taiwan”, 28, 851-
871.
Dehmas, Djamila Abdeslame, Nabila Kherba, Fouad Boukli Hacene, Nachida Kasbadji Merzouk, Mustapha Merzouk, Hacene Mahmoudi and Mattheus F. A. Goosen, 2011. “On the Use of Wind Energy to Power Reverse Osmosis Desalination Plant: A Case Study from Téns (Algeria).” Renewable and Sustainable Energy Reviews, 15, 956-963.
DTU Risoe. 2012. “Wind Atlas Analysis and Application Program.” 2012. http://www.
wasp.dk/.
Durak, Murat and Zekai En, 2002. “Wind Power Potential in Turkey and Akhisar Case Study.”
Renewable Energy, 25, 463-472.
Fang, Hsin Fa, 2014. “Wind Energy Potential Assessment for the Offshore Areas of Taiwan West Coast and Penghu Archipelago.”
Renewable Energy, 67, 237-241.
Hillring, Bengt and Roland Krieg, 1998. “Wind E n e rg y P o t e n t i a l i n S o u t h e r n S w e d e n E x a m p l e o f P l a n n i n g M e t h o d o l o g y. ” Renewable Energy, 13, 471-479.
Industrial Technology Research Institute, 2014.
“Thousand Wind Turbines Project.” 2014.
http://www.twtpo.org.tw/intro.aspx?id=462.
Jarvis, Andy, Jorge Rubiano, Andy Nelson, Andrew Farrow and Mark Mulligan, 2004.
“Practical Use of SRTM Data in the Tropics – Comparisons with Digital Elevation Models Generated from Cartographic Data.”, working document no. 198.
Kim, Yong Hwan and Hee Chang Lim, 2017.
“Effect of Island Topography and Surface Roughness on the Estimation of Annual Energy Production of Offshore Wind Farms.”
Renewable Energy, 103, 106-114.
Lennard, Christopher, Andrea N. Hahmann, Jake Badger, Niels G. Mortensen and Brendan
Argent, 2015. “Development of a Numerical Wind Atlas for South Africa.” Energy Procedia, 76, 128-137.
Ozerdem, B. and H. M.Turkeli, 2005, “Wind Energy Potential Estimation and Micrositting on Izmir Institute of Technology Campus, Turkey.” Renewable Energy, 30, 1623-1633.
Palma, J. M L M, F. A. Castro, L. F. Ribeiro, A.
H. Rodrigues and A. P.Pinto, 2008. “Linear and Nonlinear Models in Wind Resource Assessment and Wind Turbine Micro-
Siting in Complex Terrain.” Journal of Wind Engineering and Industrial Aerodynamics, 96, 2308-2326.
Taipower, 2017. “Development of Renewable Energy.” 2017.
Waewsak, J., T. Chaichana, C. Chancham, M.
Landry and Y. Gagnon, 2014. “Micro-Siting Wind Resource Assessment and near Shore Wind Farm Analysis in Pakpanang District, Nakhon Si Thammarat Province, Thailand.”
Energy Procedia, 52, 204-215.
ॳຟեЅਯंـܚཌᢎᒵ֭Ϸݙ
ങሜIJī
ᄢȁौ
檀妋㜸⹎䘬桐傥⛘⚾㚱≑㕤⽖奨怠⛨冯⮳㈦怑⎰䘬⛘溆墅姕桐㨇ˤ㛔䞼䨞憅⮵冢䀋⛘⋨⊭⏓暊 Ⲟ⺢䩳桐傥⛘⚾炻᷎憅⮵∫↮䘬⋨➇㈦↢桐屯㸸庫Ἓᷳ⛘溆炻᷎冯㔯䌣㔠㒂 㭼庫ˤ㭼庫䳸㝄栗 䣢炻⛐剙咖冯冢㜙⛘⋨䘬ⶖ䔘庫⣏ˤỮ⛐大⋲悐⛘⋨䘬⊿悐ˣᷕ悐冯⋿悐⛘⋨䘬䳸㝄⇯ᶨ农炻婌ⶖ
⯂⛐⎗㍍⍿䭬⚵ˤ⇑䓐⺢䩳䘬桐㨇㔠ῤ㧉✳炻⌛⎗忚埴桐⟜夷∫冯⸜䘤暣慷䘬Ộ䬿ˤ㛔㔯⎎憅⮵
㟠傥䞼䨞䘬ℵ䓇傥㸸⚺⋨忚埴⽖奨怠⛨↮㜸ˤ⛐⸦ᾳ㑯⭂䘬⺢䈑ᶲ姕伖嘃㒔桐㨇炻᷎Ộ䬿䚠⮵ㅱ 䘬⸜䘤暣慷冯⸛⛯桐忇炻᷎忚埴㭼庫冯㍊妶↮㜸ˤ
ᜰᗤຠȈॳȃॳӴყȃཌᢎᒵ֭ȃॳᐠ
㓞⇘㖍㛇: 2018⸜04㚰23㖍 ᾖ㬋㖍㛇: 2018⸜08㚰15㖍
㍍⍿㖍㛇: 2018⸜08㚰16㖍
1 埴㓧昊⍇⫸傥⥼⒉㚫㟠傥䞼䨞㨇㡘⍲䲣䴙ⶍ䦳⮰㟰妰䔓 ≑䎮䞼䨞⒉
*忂妲ἄ侭, 暣娙: 03-4711400#3351, E-mail: [email protected]