國立臺灣大學生命科學院分子與細胞生物學研究所 碩士論文
Graduate Institute of Molecular and Cellular Biology College of Life Science
National Taiwan University Master Thesis
以蛋白質體學探討 ATP 合成酶抑制劑在肺癌異種移植模式的作用
Proteomic Analysis Reveals the Effect of Targeting Ectopic ATP Synthase by Citreoviridin in Lung Cancer Xenograft Model
吳怡萱 Yi-Hsuan Wu
指導教授:阮雪芬 博士 Advisor: Hsueh-Fen Juan, Ph.D.
中華民國 101 年 7 月
July 2012
I
口試委員會審定書
II
誌謝
這是一本記錄著我在這個實驗室裡點點滴滴回憶的論文,從大二時來這裡直 到今天,一路上都有溫暖的人們與我相伴。我非常感謝我的指導教授阮雪芬老師,
老師不但在研究上與我討論,在生活中老師也時常與我們愉快地談天,是老師讓 我能夠擁有今天的豐收喜悅。感謝陽明生資所黃宣誠老師在資料分析部分的討論 與建議,使我能夠對統計與數據處理有更深入的認識。另外,感謝中研院化學所 陳玉如老師讓我有機會學習 iTRAQ 的實驗,並且在論文上給我專業的協助。再來 要感謝中研院生多中心李文雄老師與中研院生化所陳水田老師,謝謝您們在口試 與論文上給予的寶貴建議。最後感謝中研院農生中心梁佑全老師在動物實驗的數 據詮釋上的討論,感謝長庚醫院張廷彰教授在最初讓我學習實驗的技術以及一直 以來對我的鼓勵。
謝謝實驗室的夥伴們在這一段日子裡陪我一起努力、一起歡笑,謝謝心儀學 姊即使在很忙碌時也在實驗上給我許多幫助,在我遇到困境難過時給我打氣,有 妳在感覺很放心。謝謝家瑋學姊在我來到這裡時那麼細心地帶我做實驗,並且總 是幫助我解決許多困難,能夠認識妳真好。芷薇學姊,謝謝妳這麼用心教導我做 實驗,在我有任何問題時都很有耐心教我,妳是很棒的學姊。謝謝翠琴學姊在實 驗室時與我討論,給予我許多的鼓勵讓我有勇氣、讓我感覺對研究的熱忱。謝謝 人勻學長、卓逸學長、振慶學長與佳憲學長在分析資料時給我的協助,有你們在 真好。謝謝建偉學長、俐伶學姊、佩君學姊與牧寰學姊在遇到問題時總是用心地 給予我幫忙,你們很貼心。在我剛到實驗室時遇到的存瑄學姊、成諭學長、宜德 學長與仲誠學長,謝謝你們對研究的熱忱,讓我能夠也努力做自己的研究;後來 遇見的家琪學姊、乃寧學姊、凱能學長、宣凱學長與聖爵學長,跟你們一起在實 驗室相處非常快樂,也謝謝你們一直以來給我的支持。謝謝大學時我的實驗室夥 伴秀娟,碩一的同學思凱與寬豪,能有你們的陪伴真美好。最後感謝跟我一起成
III
長、一起揮灑汗水淚水的夥伴們孟禾、曉雲與惠婷,能在這裡遇見妳們並與妳們 成為好朋友真的很幸福。
感謝台大化學系蛋白質體質譜核心實驗室的寶玉學姊,在質譜分析上給予我 許多協助,並且幫助我解決一切困難。感謝師大化學系陳頌方老師讓我們使用儀 器,謝謝郡倫學姊一直以來都很熱心幫忙。感謝生命科學院 TechComm 科技共同 空間在 Mascot 使用上的協助。
再來,謝謝柏凱在研究生活的每一天都一直陪伴著我,謝謝你總是在我遇到 困難時不厭其煩地幫助我、鼓勵我。最後感謝我最摯愛的家人們,謝謝你們總是 給我最溫暖的支持,讓我能夠無憂無慮地專心做研究,唯有你們對我的愛才能夠 使這本論文更完整。我將這本論文謹獻給我最親愛的人們,謝謝你們。
IV
中文摘要
先前的研究發現 ATP 合成酶在多種癌細胞的細胞膜上表現,使用 ATP 合成酶 抑制劑黃綠青黴素(citreoviridin)可以在不影響正常細胞下,而抑制肺癌細胞增生與 腫瘤生長。由於在體內抑制表面型 ATP 合成酶的整體影響仍未清楚,因此在本研 究中我們以相對和絕對定量的等量異位標籤(isobaric tags for relative and absolute
quantitation, iTRAQ)定量蛋白質體學來分析 citreoviridin 在肺癌異種移植(xenograft) 模式中的調控。我們以良好的再現性鑑定並定量了 2,659 個蛋白質,並且以它們在 控制組與 citreoviridin 處理組的相對表現量挑選出表現量有差異的 141 個蛋白質。
使 用 生 物 資 訊 學 方 法 加 以 分 析 表 現 量 有 差 異 的 蛋 白 質 , 結 果 發 現 在 肺 癌 中
citreoviridin 會改變與葡萄糖代謝相關酵素的表現。參與糖質新生(gluconeogenesis) 與葡萄糖儲存的酵素表現量增加,顯示 citreoviridin 可能藉由降低提供給合成巨分 子所需的糖解作用中間產物來達到抑制癌細胞增生的效果。本研究以蛋白質體學 探討 citreoviridin 抗肺癌作用可能影響代謝的功能,根據此研究結果,我們希望能 有助於深入了解代謝與腫瘤生成的關係,並提供肺癌治療的策略方向。
關鍵詞:蛋白質體學、相對和絕對定量的等量異位標籤(iTRAQ)、表面型 ATP 合 成酶、肺癌、糖質新生
V
ABSTRACT
ATP synthase is present on the plasma membrane of several types of cancer cells.
Citreoviridin, an ATP synthase inhibitor, selectively suppresses the proliferation and tumor growth of lung cancer without affecting normal cells. However, the global effects of targeting ectopic ATP synthase in vivo have not been well defined. In this study, we performed quantitative proteomic analysis using isobaric tags for relative and absolute quantitation (iTRAQ) and provided a comprehensive insight into the complicated regulation by citreoviridin in lung cancer xenograft model. With high reproducibility of the quantitation, we obtained quantitative proteomic profiling with 2,659 proteins identified. Bioinformatics analysis of the 141 differentially expressed proteins selected by their relative abundance revealed that citreoviridin induces alterations in the expression of glucose metabolism-related enzymes in lung cancer. The up-regulation of enzymes involved in gluconeogenesis and storage of glucose indicated that citreoviridin may reduce the glycolytic intermediates for macromolecule synthesis and inhibit cell proliferation. The results provide metabolic aspects from comprehensive proteomics for the antitumorigenic effect of citreoviridin in lung cancer, which may lead to a better understanding of the links between metabolism and tumorigenesis in cancer therapy.
Keywords: proteomics, iTRAQ, ectopic ATP synthase, lung cancer, gluconeogenesis
VI
CONTENTS
口試委員會審定書 ... I 誌謝 ... II 中文摘要 ... IV ABSTRACT ... V CONTENTS ... VI LIST OF FIGURES ... XI LIST OF TABLES ... XIV
Chapter 1 Introduction ... 1
1.1 Lung cancer treatment ... 1
1.2 Ectopic ATP synthase ... 2
1.3 ATP synthase inhibitor citreoviridin ... 4
1.4 Proteomics ... 5
1.5 Quantitative proteomics by iTRAQ labeling ... 6
1.6 Cancer metabolism ... 8
1.7 Specific aims ... 10
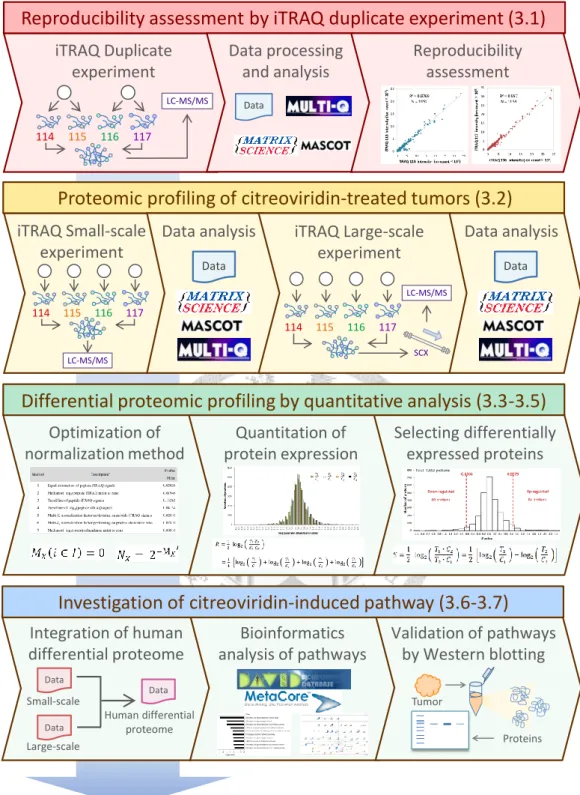
1.8 Experimental design ... 11
Chapter 2 Materials and Methods ... 14
VII
2.1 Reagents ... 14
2.2 Tumor tissues ... 15
2.3 Protein preparation ... 16
2.4 Reduction, alkylation and digestion of proteins ... 16
2.5 iTRAQ labeling of peptides ... 18
2.6 Strong cation exchange (SCX) chromatography ... 19
2.7 ZipTip desalting ... 19
2.8 LC-MS/MS analysis ... 20
2.9 Protein identification ... 21
2.10 Selecting peptides for quantitation ... 23
2.11 iTRAQ signal normalization ... 24
2.12 Protein quantitation ... 25
2.13 Selection of differentially expressed proteins ... 26
2.14 Integration of differentially expressed human proteins ... 29
2.15 Bioinformatics analysis ... 30
2.16 Western blotting ... 31
Chapter 3 Results ... 34 3.1 Reproducibility assessment by analysis of iTRAQ duplicate experiment . 34
VIII
3.2 Proteomic profiling of citreoviridin-treated tumors ... 35
3.3 Optimization of peptide iTRAQ signal normalization ... 37
3.4 Quantitation of protein expression by iTRAQ signals ... 40
3.5 Cut-off value calculation for selecting differentially expressed proteins ... 41
3.6 Bioinformatics analysis of human differential proteomic profiling induced by citreoviridin ... 44
3.7 Validation of citreoviridin-induced gluconeogenesis in lung cancer xenograft tumors ... 47
Chapter 4 Discussion ... 49
4.1 Protein inference of xenograft ... 49
4.2 Protein abundance ratio calculation ... 50
4.3 The occurrence of gluconeogenesis ... 51
4.4 The effect on glucose metabolism by targeting ectopic ATP synthase ... 54
4.5 The antitumorigenic potential of metabolic therapy... 56
Chapter 5 Conclusion ... 62
Chapter 6 Future work ... 63
REFERENCES ... 65
Figures ... 82
IX
Tables ... 111
APPENDIX A ... 133
Appendix A1 Seven different normalization methods ... 133
APPENDIX B ... 137
Appendix B1 The proteomic data of the duplicate experiment ... 137
Appendix B2 The proteomic data of the small-scale experiment ... 137
Appendix B3 The proteomic data of the large-scale experiment ... 137
Appendix B4 The normalized data of duplicate experiment by seven different normalization methods ... 138
Appendix B5 The normalized data of large-scale experiment by normalization method 1 and method 2 ... 138
Appendix B6 Calculation of cut-off values and estimation of individual variations among biological replicate of samples... 139
Appendix B7 The results of Gene Ontology biological process clustering enrichment analysis ... 139
Appendix B8 The results of pathway map analysis and network analysis ... 139
APPENDIX C ... 141
Protocol: iTRAQ quantitative proteomics ... 142
X
APPENDIX D ... 162 Posters ... 162
XI
LIST OF FIGURES
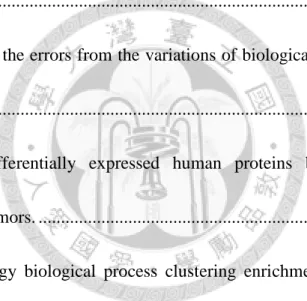
Figure 1. The structure and molecular formula of citreoviridin. ... 83
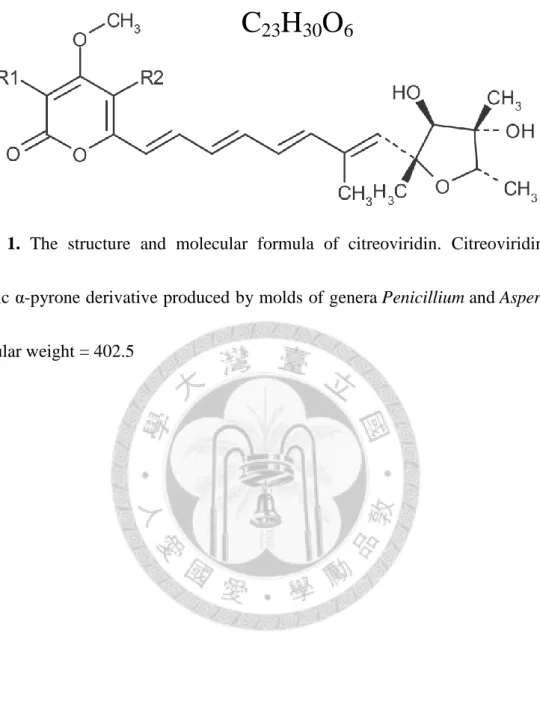
Figure 2. Schematic workflow of shotgun proteomics. ... 84
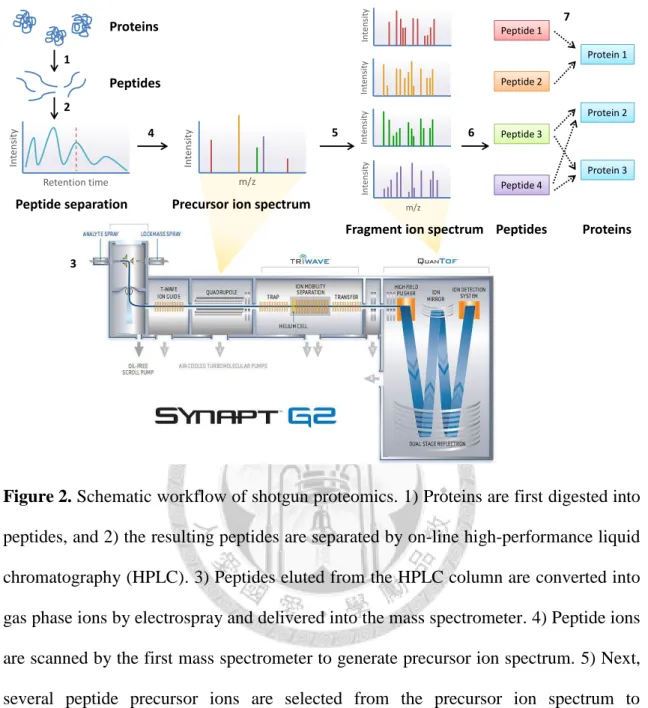
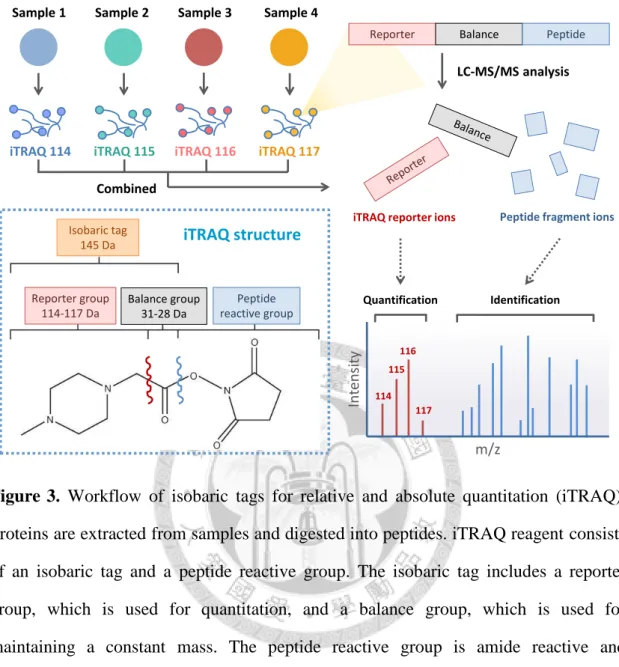
Figure 3. Workflow of isobaric tags for relative and absolute quantitation (iTRAQ). .. 85
Figure 4. The overall experimental design of this study. ... 86
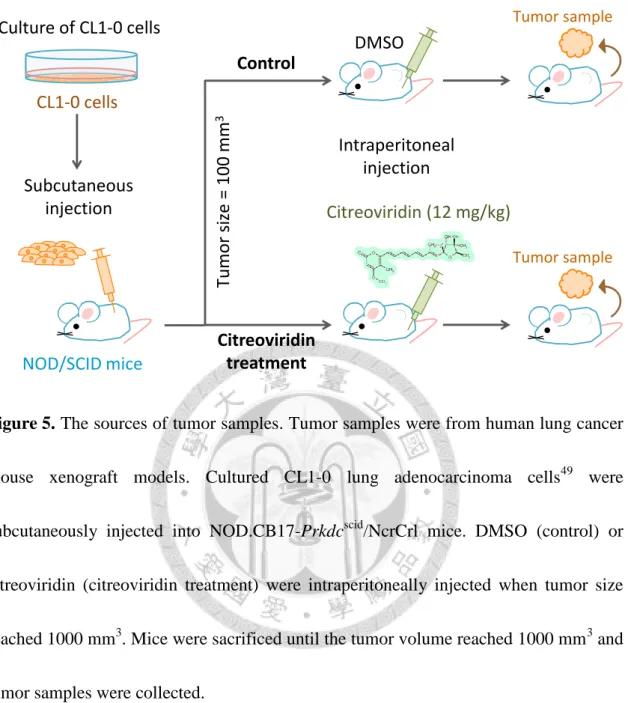
Figure 5. The sources of tumor samples. ... 87
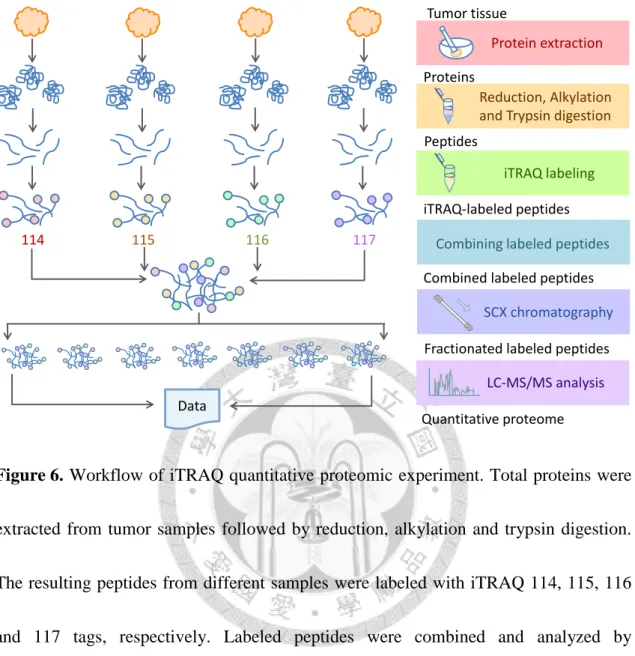
Figure 6. Workflow of iTRAQ quantitative proteomic experiment. ... 88
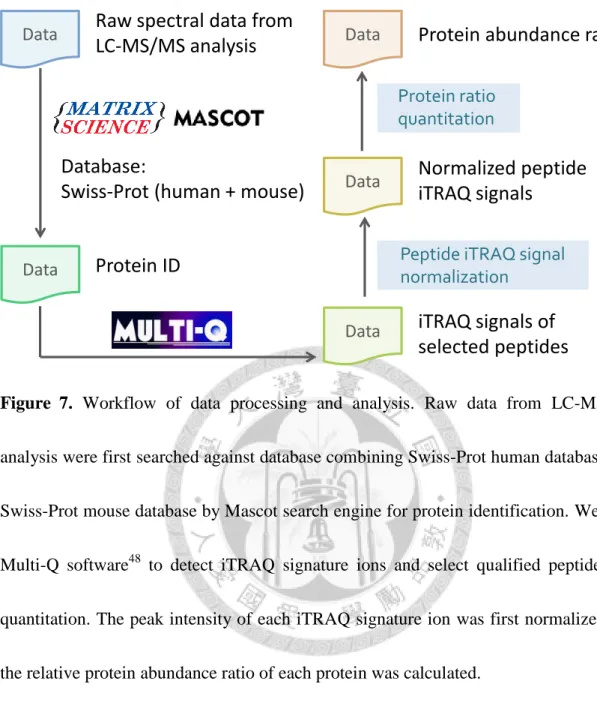
Figure 7. Workflow of data processing and analysis... 89
Figure 8. Workflow of bioinformatics analysis of differentially expressed human proteins. ... 90
Figure 9. The experimental design and data analysis process of iTRAQ duplicate experiment. ... 91
Figure 10. iTRAQ quantitative proteomic experiments showed high reproducibility and accuracy. ... 92
Figure 11. The experimental design and data analysis process of iTRAQ small-scale experiment and large-scale experiment. ... 93
Figure 12. Strong cation exchange (SCX) chromatography... 95
Figure 13. Strong cation exchange (SCX) chromatogram. ... 96
XII
Figure 14. The distribution of log2 (C2/C1) and log2 (T2/T1) in the large-scale experiment
by using normalization method 1. ... 97
Figure 15. The distribution of log2 (C2/C1) and log2 (T2/T1) in the large-scale experiment by using normalization method 2. ... 98
Figure 16. The distribution of four sets of treatment to control log2 protein ratio in the small-scale experiment. ... 99
Figure 17. The distribution of four sets of treatment to control log2 protein ratio in the large-scale experiment. ... 100
Figure 18. The distribution of R value in the small-scale experiment. ... 101
Figure 19. The distribution of R value in the large-scale experiment. ... 102
Figure 20. The distribution of S value in the large-scale experiment. ... 103
Figure 21. The distribution of S value in the duplicate experiment. ... 104
Figure 22. Pathways associated with differentially expressed human proteins by MetaCore pathway map analysis. ... 105
Figure 23. The expression level of enzymes involved in gluconeogenesis and glycolysis in the large-scale experiment. ... 106
Figure 24. Top 1 network: macromolecule catabolic process and ubiquitin-regulated cell cycle network. ... 107
XIII
Figure 25. The protein expression levels of alpha-enolase and mitochondrial phosphoenolpyruvate carboxykinase (PEPCK-M) in control and citreoviridin-treated tumor tissues. ... 108 Figure 26. Signaling pathways that regulate glucose metabolism. ... 109 Figure 27. The conclusion of this study. ... 110
XIV
LIST OF TABLES
Table 1. The review of ectopic ATP synthase. ... 112 Table 2. Statistics of three iTRAQ quantitative proteomic experiments. ... 113 Table 3. The S value calculated by seven different normalization methods in the duplicate experiment. ... 114 Table 4. The S value calculated by normalization method 1 and 2 in the large-scale experiment. ... 115 Table 5. Estimation of the errors from the variations of biological replicate of samples.
... 116 Table 6. List of differentially expressed human proteins between control and citreoviridin-treated tumors. ... 117 Table 7. Gene Ontology biological process clustering enrichment analysis of human differential proteome induced by citreoviridin. ... 125 Table 8. List of proteins in gluconeogenesis and glycolysis identified in the large-scale experiment. ... 126 Table 9. Gene Ontology biological process clustering enrichment analysis of down-regulated proteins with citreoviridin treatment. ... 129 Table 10. Top 5 networks of human differential proteome induced by citreoviridin. . 130
XV
Table 11. List of glucose metabolism-related proteins identified in the large-scale experiment. ... 131
1
Chapter 1 Introduction
1.1 Lung cancer treatment
Lung cancer is the leading cause of cancer-related death worldwide, with nearly 1.4 million people died from lung cancer each year1. It is estimated that lung cancer will be responsible for more deaths than combined colorectal cancer, breast cancer and prostate cancer. The prognosis with 5-year survival rate of patients with metastatic lung cancer is less than 20%, emphasizing the poor recovery probability of the disease2. Due to the slight symptoms at early stage of the disease progression, the diagnosis of lung cancer is usually late, so the treatment cannot provide remarkable improvement. Local lung cancer discovered at early stage can be cured with lung resection, but it accounts for only 20-30% of individual lung cancer patients3. Other cases of lung cancer are mainly treated with chemotherapy. Unfortunately, chemotherapeutic drugs have severe side effects and sometimes on the contrary become heavy burdens for patients. One of the treatment strategies is based on the discovery that subsets of lung cancer harbor specific mutations in genes coding crucial proteins involved in signaling pathways of cell survival and proliferation. For example, Gefitinib (Iressa) and Erlotinib (Tarceva), two drugs inhibiting epidermal growth factor receptor (EGFR) tyrosine kinase, are effective therapies when confronted with non-small cell lung cancer (NSCLC)4. However,
2
unavoidable drug resistance eventually develops on patients with objective response to gefitinib or erlotinib initially5. Furthermore, 30% of patients receiving gefitinib showed no much change from pre-treatment conditions6.
1.2 Ectopic ATP synthase
The ATP synthase is nature’s smallest motor that is important in producing energy to drive many processes in cells. It converts energy into cellular energy ATP from the proton gradient generated from electron transport chain. Although ATP synthase has been thought to exclusively locate on the inner membrane of mitochondria for a long time, several reports show that components of ATP synthase also exist on the plasma membrane of several types of cells. The ATP synthase that locates on the plasma membrane is called ectopic ATP synthase or ecto-ATP synthase. Here we reviewed the current knowledge about ectopic ATP synthase, including the major cell types it expresses in, the functions it exhibits and the processes it regulates (Table 1). In endothelial cells, the ectopic ATP synthase was discovered as an angiostatin binding protein, which exhibits antiangiogenic effects and inhibits endothelial cell proliferation and migration7. It is also recognized as an endothelial monocyte-activating polypeptide (EMAP) II-binding protein, which is involved in the inhibition of the endothelial cell
3
proliferation8. The extracellular ATP synthesis of ectopic ATP synthase and its role in cell proliferation was also described9. One subunit of ATP synthase, coupling factor 6 (CF6) was known to act as an endogenous vasoconstrictor and plays a role in cardiovascular disease10. In hepatocyte, ectopic ATP synthase was discovered to be as an apolipoprotein A-I receptor and regulates hepatic HDL endocytosis11. In tumor cells, ectopic ATP synthase was recognized as a ligand of a cytolytic pathway used by naive natural killer (NK) and lymphokine-activated killer (LAK) cells12. Furthermore, ATP synthase was also found on the surface of breast cancer cells and involved in cell proliferation, which showed that it could be a target for cancer therapy13. In adipocyte, ectopic ATP synthase was known to regulate lipid metabolism14 and adipocyte differentiation15. The ATP generated from ectopic ATP synthase in keratinocytes was shown to involve in the autocrine and paracrine regulation of cell proliferation, differentiation and apoptosis16. Ectopic ATP synthase expressed on T cells was recognized as a histidine-rich glycoprotein (HRG)-binding protein, which regulates the cell adhesion and morphologic changes induced by concanavalin17. Cholesterol metabolism in neurons and fibroblasts was also regulated by the ectopic ATP synthase expressed on these cells18.
4
1.3 ATP synthase inhibitor citreoviridin
Many inhibitors of ATP synthase have been discovered and investigated. A review summarized the natural and synthetic inhibitors of ATP synthase and diverse categories of the inhibitors were found, including peptides, polyphenolic phytochemicals, polyketides, polyenic α-pyrone derivatives and so on19. One of the compounds called citreoviridin, which has been studied in our lab, has been proved to inhibit the proliferation of lung adenocarcinoma cell lines A549 and CL1-0 and the growth of CL1-0 xenograft tumors (unpublished data). Citreoviridin is a polyene mycotoxin produced by several molds of genera Penicillium and Aspergillus. It consists of an α-pyrone ring conjugated to a furan ring (Figure 1). Most of the research on citreoviridin was done in 1970s to 1990s. At first, the mycotoxin was discovered in “yellowed rice”—the rice infected by fungi—and implicated to cause acute cardiac beriberi, which is characterized by heart failure and inability of heart muscle20. Citreoviridin, a toxic yellow compound was first isolated from infected rice by Hirata21. The structure of citreoviridin was determined by Sakabe et al. with NMR spectrometry in 196422 followed by the confirmation with X-ray crystallography23. The biosynthesis of citreoviridin was investigated by Nagel et al. in 197224. In 1978, Linnett et al. first demonstrated the inhibitor effect of citreoviridin on ATP synthase25. Citreoviridin inhibits the activity of
5
ATP synthase by interacting with β subunit of F1 ATP synthase26. It was shown to affect several metabolic enzymes, including glycogen synthase, glutamic-oxalacetic transaminase and transketolase27.
1.4 Proteomics
In 1996, the word proteome was defined as the entire set of proteins expressed in a specific state of an organism or a cell population28. Proteomics provide a global view at the protein level, which is analog to obtain the level of DNA and RNA with genomics.
Genomics measures the genotype of an organism, while proteomics extends it to phenotype of an organism expressed in a specific environment. Compared with the measurement of transcriptome by microarray, proteomics measures mature proteins, which are the end products of gene expression. Therefore, proteomics could be an observation more closely to the biological functions in cells29. The fast development of proteomics is owing to the advancement of mass spectrometric technologies. Recently, the most widely used mass spectrometry (MS)-based proteomics is shotgun proteomics or the so-called peptide-centric proteomics30. Generally, the main goal of proteomics is to accurately characterize as many proteins as possible in the complex mixture containing more than 10,000 different proteins in a cell population29.
6
The workflow of shotgun proteomics is shown in Figure 2. First of all, proteins are digested into peptides by sequence-specific enzymes such as trypsin. The resulting peptides are separated by on-line Ultra Performance Liquid Chromatography (UPLC) and subjected to electrospray31 which converts peptides eluted from the column into gas phase ions. These peptide ions are scanned by mass spectrometer to generate mass spectra. Next, several peptide precursor ions are selected from the mass spectra and subjected to collision-induced dissociation (CID) for fragmentation. The fragment ions are measured by the second mass spectrometer to generate spectra; the process is called tandem mass spectrometry (MS/MS). In peptide-spectra matching, the fragment ion spectra are assigned to their corresponding peptide by sequence database search algorithm. Finally, protein represents a set of peptide sequences is calculated and identified29, 32.
1.5 Quantitative proteomics by iTRAQ labeling
Comparative analysis has a central role in investigation of proteomes in different cell states. Quantitation is essential for determination of the relative changes in response to different conditions when performing comparative proteomic analysis. There are two major methods available for MS quantitation, the stable isotope-based and the label-free
7
approaches29. A well-established and widely used stable isotope-based method is isobaric tags for relative and absolute quantitation (iTRAQ)33. The structure and quantitation by iTRAQ is shown in Figure 3. iTRAQ reagents are amide reactive and covalently link to the N terminus and side chain of lysine residues of peptides. It provides multiplex protein quantitation by labeling peptides from different samples with different iTRAQ reagents.
The term “isobaric” means that all different iTRAQ reagents have equal mass and so are not distinguished or quantified in the survey scan of the first mass spectrometer. With collision-induced dissociation (CID) prior to the second mass spectrometer, iTRAQ reagents are fragmented to generate reporter ions of m/z 114, 115, 116 and 117 in MS/MS spectra for four-plexed reagent set. For quantitation, the intensities of the reporter ions are used for calculating the relative abundance of peptides and proteins in samples. The remaining peaks in MS/MS spectra are used for peptide sequence identification. One of the most significant advantages of iTRAQ quantitation is that the intensities of peptide precursor ions in MS and fragment ions in MS/MS are enhanced by combination of all iTRAQ-labeled samples prior to MS analysis, which increases the accuracy of quantitation.
8
1.6 Cancer metabolism
Cancer cells are uncontrolled cells which have six hallmarks including sustaining proliferative signaling, evading growth suppressors, resisting cell death, enabling replicative immortality, inducing angiogenesis, and activating invasion and metastasis34. These abnormal characteristics are reflected in the alterations of metabolism in cancer cells, and this metabolic transformation is the consequence of oncogenic signaling and gene expression. Not only to maintain the homeostasis, cancer cells take efforts to grow and divide. Unlike normal cells, the proliferating cancer cells uptake more nutrients and alter their metabolism pathways to meet the need. Nutrients are converted to biosynthetic building blocks, which are further converted to macromolecules for constituting the new cells35. Glucose is the major source of cellular energy and building blocks for new cells. Hence, the glucose metabolism and dependence are altered in cancer cells. In 1924, Otto Warburg observed that rapidly proliferating cancer cells exhibit higher glucose consumption than normal cells through higher levels of glycolysis, which turns glucose into lactate even in the presence of oxygen36. The phenomenon is known as Warburg effect. This phenomenon is also called aerobic glycolysis to distinguish from the traditional anaerobic glycolysis that glucose is converted to lactate when limited oxygen is available.
9
The high level of aerobic glycolysis provides many advantages for cancer cells.
The major advantage is that up-regulated glycolysis maintains the level of glycolytic intermediates to sustain continuous building blocks for macromolecular synthesis, including generating nucleotides, lipids, and amino acids37. The macromolecular synthesis is essential when cancer cells are dividing. In addition to the enzymatic functions, glycolytic enzymes have other functions to benefit cancer cells. For example, glyceraldehyde 3-phosphate dehydrogenase (GAPDH) plays a role in the regulation of cell death and tumor progression38, pyruvate kinase M2 (PK-M2) may modulate transcription factor Oct4, which maintains cancer stem-like properties39, and phosphoglycerate kinase (PGK) could be secreted to act as a disulfide reductase to facilitate the cleavage of angiogenesis inhibitor40. Furthermore, lactate generation from the glycolytic pathway is also an important step in cancer cells. For continuous glycolytic flux, NAD+ is regenerated from the conversion of pyruvate to lactate by lactate dehydrogenase (LDH). The secretion of lactate also provides acidic environments that favor the invasion and metastasis41.
About the molecular basis of aerobic glycolysis, the PI3K/AKT signaling pathway plays a crucial role in regulating glucose metabolism. PI3K through AKT stimulates the expression of glucose transporter GLUT-1, and thus increases the glucose uptake of the
10
cell42. The activation of this pathway also increases the activity of hexokinase (HK) by maintaining HK associated with mitochondria43. In addition, the PI3K/AKT pathway increases the transcription of hypoxia-inducible factor 1 (HIF-1). HIF-1 enhances glycolysis by up-regulating the expression of GLUT-1 and glycolytic enzymes including HK, 6-phosphofructokinase (PFK-1), aldolase, GAPDH, PGK, enolase 1 and PK-M244. Like PI3K/AKT, MYC also promotes transcription of glucose transporters and glycolytic enzymes45. The LKB1/AMPK signaling pathway also regulates glucose metabolism in cells. It has been reported that AMPK modulates glycolysis by phosphorylating the enzyme 6-phosphofructo-2-kinase/fructose-2,6-bisphosphatase 2 (PFK-2/FBPase-2)46. Besides, cAMP-dependent protein kinase (PKA) increases the activity of FBPase-2 and decreases the activity of L-type pyruvate kinase. On the other hand, the tumor suppressor p53 inhibits the expression of glucose transporters and glycolytic enzymes47. The understanding of cancer metabolism showed that the aerobic glycolysis is promising target for cancer therapies.
1.7 Specific aims
ATP synthase inhibitor citreoviridin is able to inhibit cell proliferation of lung cancer cell lines without affecting normal cell line and repress growth of lung cancer xenograft
11
tumors, indicating that citreoviridin is a promising antitumorigenic agent. In this study, our major objective is to elucidate the effect induced by citreoviridin in the lung cancer xenograft model. Applying proteomic analysis, we investigated the proteomic changes caused by citreoviridin and showed the pathways leading to cell proliferation inhibition by citreoviridin in lung cancer.
Specific aims:
1. To assess the reproducibility of the iTRAQ-based proteomic strategies.
2. To acquire the differential proteomic profiling induced by citreoviridin in lung cancer xenograft tumors.
3. To investigate and validate the pathways induced by citreoviridin in lung cancer xenograft tumors.
1.8 Experimental design
The experimental design of this study is shown in Figure 4. The samples we analyzed were lung tumors collected from control and citreoviridin-treated mice illustrated in Figure 5. Briefly, CL1-0 lung adenocarcinoma cells were subcutaneously injected into mice followed by intraperitoneal injection of DMSO or citreoviridin. This study is divided into four parts (Figure 4). First, duplicate experiment that analyzes duplicate
12
preparations of the same sample was performed. We evaluated the reproducibility of iTRAQ quantitative proteomic strategy in our experiments (see Section 3.1). The second part is acquisition of the proteomic profiling of citreoviridin-treated tumors with iTRAQ proteomic experiments. Proteins were identified in the small-scale experiment and large-scale experiment both analyzing two control and two citreoviridin-treated tumors (see Section 3.2). In the third part, we first optimized the normalization of iTRAQ signals (see Section 3.3) and quantified the expression of proteins identified in the second part (see Section 3.4). Next, the cut-off values were calculated for selecting differentially expressed proteins between control and citreoviridin-treated tumors (see
Section 3.5). Finally, we investigated the pathway induced by citreoviridin in lung
cancer xenograft tumors. Differentially expressed human proteins were selected and analyzed by bioinformatics methods to reveal the pathways (see Section 3.6). The most significant pathway was subsequently validated by Western blotting (see Section 3.7).
The workflow of iTRAQ quantitative proteomic experiments, including duplicate, small-scale and large-scale experiments were shown in Figure 6. First, total proteins were extracted from tumor samples. Subsequently, reduction, alkylation and trypsin digestion were performed, so the proteins were digested into peptides. Peptides from different tumor samples were labeled with four different iTRAQ reagents, respectively.
13
The combined iTRAQ-labeled peptides were directly analyzed by LC-MS/MS in duplicate and small-scale experiments. In the large-scale experiment, combined iTRAQ-labeled peptides were first fractioned by strong cation exchange (SCX) chromatography to reduce the complexity of sample. Next, each fraction was analyzed by LC-MS/MS for protein identification and quantitation.
The MS/MS data from duplicate, small-scale and large-scale experiments were processed and analyzed to acquire the quantitative proteomes (Figure 7). We searched the MS/MS data against the database combining Swiss-Prot human and Swiss-Prot mouse databases by Mascot search engine for protein identification. Multi-Q software48 was used for detecting iTRAQ signature ions and selecting qualified peptides for quantitation. The peak intensity of each iTRAQ signature ions was first normalized and the relative protein abundance ratio of each protein was calculated.
14
Chapter 2 Materials and Methods
2.1 Reagents
Citreoviridin was obtained from Enzo Life Sciences (Farmingdale, NY, USA). Dimethyl sulfoxide (DMSO, cell culture grade) was purchased from AppliChem (Darmstadt, Germany). Protease inhibitor was obtained from Bioman Scientific (Taipei, Taiwan).
MatrigelTM was from from BD Biosciences (Bedford, MA, USA). Glycerol was purchased from Scharlau (Barcelona, Spain). BCATM Protein Assay Reagent kit was obtained from Pierce (Rockford, IL, USA). Triethylammonium bicarbonate buffer (TEABC), tris(2-carboxyethyl)phosphine hydrochloride (TCEP),
S-Methyl
methanethiosulfonate (MMTS), N,N,N’,N’-Tetramethylethylenediamine (TEMED), trifluoroacetic acid (TFA), tween 20, anti-rabbit IgG-HRP and anti-mouse IgG-HRP were purchased from Sigma-Aldrich (St Louis, MO, USA). Acrylamide/bisacrylamide (40%, v/v, 37.5:1) was obtained from Bioshop (Burlington, ON, Canada). Ammonium persulfate (APS, ACS grade) was from Amresco (Solon, OH, USA). Acetonitrile (ACN) was obtained from Lab-Scan (Dublin, Ireland). Sequencing grade modified trypsin was purchased from Promega (Madison, WI, USA). iTRAQ® Reagent kit (including iTRAQ Reagent 114, iTRAQ Reagent 115, iTRAQ Reagent 116, iTRAQ Reagent 117 and iTRAQ Dissolution buffer) was obtained from Applied Biosystems (Forster City, CA,15
USA). ENO1 antibody and PCK2 antibody were purchased from GeneTex (Irvine, CA, USA). Anti-actin, clone 4 was from Millipore (Bedford, MA, USA).
2.2 Tumor tissues
Tumor tissue samples were collected from human lung cancer xenograft model of our previous study (Figure 5). The NOD.CB17-Prkdcscid/NcrCrl female mice were purchased from National Taiwan University Hospital (Taipei, Taiwan) and housed in an isolator and ad libitum fed with autoclaved food. All animal work was performed in accordance with NIH animal use guidelines. 5.0 × 10⁶ CL1-0 lung adenocarcinoma cells49 in 0.1 mL Hanks’ balanced salt solution (HBSS) mixed with MatrigelTM were bilaterally subcutaneously injected into 4-5-weeks-old mice. Tumor size was measured every two days by using vernier calipers (length and width in millimeters), and tumor volume was calculated by the formula: volume = 1/2 × length × width2 (mm3). Tumor growth was checked frequently after injection of cancer cells. When the tumor volume reached 100 mm3, citreoviridin (treatment group, N = 2) or dimethylsulfoxide (DMSO, control group, N = 2) was intraperitoneally injected into mice three times a week on Mondays, Wednesday, and Fridays to a final dosage of 12 mg/kg. Mice were sacrificed until the tumor volume reached 1000 mm3 and tumors were dissected, washed and
16
stored at -80°C for the following proteomic studies.
2.3 Protein preparation
Tumor tissues were grinded into a fine powder using pestle and mortar in liquid nitrogen.
Liquid nitrogen was added to the mortar frequently to ensure that the tissues didn’t thaw during grinding. Tissue power was then suspended in lysis buffer containing 1% (v/v) SDS, 50 mM Tris-HCl, 10% (v/v) glycerol and protease inhibitor. The amount of lysis buffer added was based on the amount of tissue powder. The solution containing tissue powder was keep pipetting until there was almost no visible pellet. The sample solution was homogenized on ice using homogenizer (LABSONIC® M ultrasonic homogenizer;
Sartorius AG, Goettingen, Germany) with 60% amplitude, cycle = 0.6 (operated 0.6 sec every 1 sec) for 4-5 min. The lysate was centrifuge at 17,000g, 4°C for 30 min. The supernatant, which contained the crude extract proteins, was collected. The concentration of proteins was measured with BCATM Protein Assay Reagent kit.
2.4 Reduction, alkylation and digestion of proteins
We followed the methods of a previous study by Han et al. for protein reduction, alkylation and digestion50. Equivalent amount of proteins in control and treatment
17
samples were used for further processing, 100 μg/sample was for the duplicate experiment and small-scale experiment, while 400 μg/sample was for the large-scale experiment. Each sample was adjusted to have the same concentration of proteins by adding lysis buffer. We added 1 M triethylammonium bicarbonate buffer (TEABC) to make every sample containing 50 mM TEABC (pH was about 8.5). Proteins were reduced by 5 mM Tris(2-carboxyethyl)phosphine hydrochloride (TCEP) in a dry bath at 37°C for 30 min and then alkylated by 2 mM S-Methyl methanethiosulfonate (MMTS) at room temperature avoiding light for 30 min.
Next, we applied gel-assisted digestion for proteins. Acrylamide/bisacrylamide (40%, v/v, 37.5:1), 10% APS (w/v) and TEMED were mixed with the protein solution (protein solution: acrylamide/bisacrylamide: APS: TEMED = 14:5:0.3:0.3, v/v) to make it polymerize as a gel. The gel was cut into small pieces and washed by 25 mM TEABC and 25 mM TEABC/50% (v/v) acetonitrile (ACN) several times. Briefly, buffer was added to the gel and then we vortexed the solution. The gel was further dehydrated with 100% ACN and dried completely with a centrifugal evaporator (CVE-2000; Eyela, Tokyo, Japan). 25 mM TEABC was added to rehydrate the gel and trypsin (protein:
trypsin = 10:1, w/w) was subsequently added to the rehydrated gel. After ensuring the gel was fully covered by 25 mM TEABC, sample was incubated at 37°C overnight (at least
18
16 h). Peptides were extracted from the gel with 0.1% (v/v) Trifluoroacetic acid (TFA), 50% (v/v) ACN /0.1% (v/v) TFA, and 100% ACN sequentially. Like the step of washing the gel, buffer was added to the gel and then we vortexed the gel solution. The liquid part of the sample was collected and combined. The extracted peptide solution was dried with a sample concentrator (miVac Duo Concentrator; Genevac, Ipswich, UK).
2.5 iTRAQ labeling of peptides
The peptides were resuspended in iTRAQ Dissolution buffer. We confirmed that the solution was basic (about pH 8.5). The concentration of peptide was measured with BCATM Protein Assay Reagent kit. For duplicate experiment and small-scale experiment, 5 μg peptides of each sample were required for iTRAQ labeling. For large-scale experiment, 150 μg peptides of each sample were required. Each vial (1 unit) of iTRAQ Reagent was brought to room temperature and dissolved in 70 μL absolute ethanol by vortexing for 1 min. Equal amount of peptides from different samples was labeled by adding iTRAQ Reagent 114, iTRAQ Reagent 115, iTRAQ Reagent 116, iTRAQ Reagent 117, respectively and vortexing at room temperature for 1 h. Labeled peptides were combined and dried with a centrifugal evaporator (CVE-2000; Eyela, Tokyo, Japan).
19
2.6 Strong cation exchange (SCX) chromatography
For large-scale experiment, SCX chromatography was performed after iTRAQ labeling.
The labeled peptides were resuspended in 2 mL buffer A (5 mM KH2PO4 and 25% (v/v) ACN, pH 3) and fractioned by SCX chromatography. The peptide solution was subjected onto a 2.1× 200 mm PolySULFOETHYL ATM column containing 5-μm particles with 200-Å pore size (PolyLC, Columbia, MD, USA). A flow rate of 200 μl/min with a gradient of 0-25% buffer B (5 mM KH2PO4, 350 mM KCl and 25% ACN (v/v), pH 3) for 30 min followed by a gradient of 25-100% buffer B for 20 min was applied for peptide elution. The eluate was monitored by the absorbance of peptide bond at 214 nm, and fractions were collected every 1 min. Each fraction was dried with a sample concentrator (Savant SpeedVac® Plus SC210A Concentrator; Thermo Scientific, Waltham, MA, USA).
2.7 ZipTip desalting
For duplicate experiment and small-scale experiment, iTRAQ-labeled peptides were directly subjected to desalting step. For large-scale experiment, each fraction of peptides was desalted individually. We perform desalting using ZipTip® Pipette Tips (Millipore, Bedford, MA, USA). Dried peptides were resuspended in 20-30 μL 0.1% (v/v) TFA,
20
and 10% TFA was added to adjust the pH of the solution to about pH 2-3. The ZipTip was first wetted in 50% (v/v) ACN/0.1% (v/v) TFA followed by equilibrated in 0.1%
(v/v) TFA. The peptides bound to the ZipTip by aspirating and dispensing the peptide solution 20 cycles. Subsequently, ZipTip was washed with 0.1% (v/v) TFA. At last, peptides were eluted with 20 μL 50% (v/v) ACN/0.1% (v/v) by aspirating and dispensing the eluate 10 cycles. The eulate was dried with a centrifugal evaporator (CVE-2000; Eyela, Tokyo, Japan).
2.8 LC-MS/MS analysis
After ZipTip desalting, samples containing about 3 μg peptides were reconstituted in 24 μL buffer A (0.1% (v/v) formic acid (FA) in H2O) and analyzed by LC-ESI-Q-TOF mass
spectrometry (Waters SYNAPT® G2 HDMS; Waters Corp., Milford, MA, USA).
Samples were injected into a 180 μm × 2 cm capillary trap column and separated by a 75 μm × 25 cm nanoACQUITY UPLC™ 1.7 μm Ethylene Bridged Hybrid (BEH) C18
column using a nanoACQUITY Ultra Performance LC™ System (Waters Corp., Milford, MA, USA). The column was maintained at 35°C. Buffer A was 0.1% FA in H2O and buffer B was 0.1 % FA in ACN. Bound peptides were eluted with a linear gradient of 6 to 50% buffer B at a flow rate of 300 μl/min for 100 min. MS was operated in
21
electrospray ionization sensitivity mode. NanoLockSprayTM source (Waters Corp., Milford, MA) was used for accurate mass measurements, and the lock mass channel was sampled every 30 s. The mass spectrometer was calibrated with a synthetic human [Glu1]-Fibrinopeptide B solution (1 pmol/μl; Sigma-Aldrich, St Louis, MO, USA) delivered through the NanoLockSpray source. Data acquisition was operated in the data directed analysis (DDA). The DDA method included one full MS scan (m/z 350-1700, 1 s) and three MS/MS scans (m/z 100-1990. 1.5 s for each scan) sequentially on the three most intense ions present in the full scan mass spectrum. Each sample was analyzed in duplicate.
2.9 Protein identification
The peak list resulting from MS/MS spectra was exported to mgf format by Mascot Distiller v2.3.2 (Matrix Science, London, United Kingdom) with charge state set to 2+, 3+, 4+ and 5+ and other default parameters. Data files were merged and searched against combined sequence database (containing 36,774 sequence entries) of Swiss-Prot human database (April 2, 2012) and Swiss-Prot mouse database (April 2, 2012) using Mascot search engine v2.3.02 (Matrix Science, London, United Kingdom). Search parameters for peptide and MS/MS mass tolerance were both ± 0.3 Da with allowance for
22
two missed cleavages made from the trypsin digestion. Variable modifications of deamidated (NQ), oxidation (M), iTRAQ4plex (K), iTRAQ4plex (N-term), and methylthio (C) were selected and none of the fixed modifications was selected. Peptide charge was set to Mr, instrument was set to ESI-QUAD-TOF and decoy database was searched. Mascot search results were filtered using “Significance threshold” set at p <
0.05 and “Ions score or expect cut-off” set at 0.05. Only peptides with ion scores higher than the Mascot identity score (P < 0.05) were confidently assigned. A protein hit required at least one “bold red” peptide match to have the most likely assignment. The peptide shown in “red” represents it is the highest scoring match for the spectrum.
When the peptide matched to the spectrum doesn’t appear in any higher scoring protein, it is shown in “bold”. Thus, the “bold red” match is the highest scoring match to a particular spectrum listed under the highest scoring protein containing that match. To evaluate the false discovery rate (FDR), we performed a decoy database search against a randomized decoy database created by Mascot using identical search parameters and validation criteria. FDR was calculated as D / R × 100%, where D and R are the number of matches above identity threshold in search of decoy and real database, respectively.
23
2.10 Selecting peptides for quantitation
Mascot search results were exported in XML format and raw data files from Waters SYNAPT® G2 HDMS mass spectrometer were converted to mzXML format using massWolf (Institute for Systems Biology, Seattle, WA, USA). Data files of XML format and mzXML format were analyzed by Multi-Q software (v1.6.5.4)48 for detecting signature ions (m/z = 114, 115, 116 and 117) and selecting peptides satisfying all the following four criteria: 1) the peptide is labeled with iTRAQ tag; 2) the peptide is considered as confidently identified (the peptide has ion score higher than the Mascot identity score (P < 0.05)); 3) the peptide is unique (non-degenerate); 4) the iTRAQ signature ion peak intensity (ion count) of the peptide is within the dynamic range (the peak intensity of each iTRAQ signature ion must be > 0, the average of the peak intensities of all iTRAQ signature ions must be ≥ 30). Only peptide satisfying the above four criteria was considered as qualified peptide and applied for further analysis. We ensured that the percentage of peptides indeed labeled with iTRAQ tag in every dataset was over 99%.
24
2.11 iTRAQ signal normalization
Before quantitation of the expression of each protein, we first normalized the peak intensity (ion count) of iTRAQ signature ion (hereafter referred to as peptide iTRAQ signal), which was used for calculating protein abundance ratios. We have tried seven different normalization methods (see Appendix A1) and choose the optimal normalization method, as described below.
Each of the proteomic experiment performed in this study contained four different cell states A, B, C and D labeled with iTRAQ tags m/z = 114, 115, 116, and 117, respectively. For peptide in cell state X, the original peptide iTRAQ ratio is
calculated as follows:
where and denote the original peptide iTRAQ signal representing the abundance of peptide in cell state X and A , respectively. The peptide iTRAQ ratio represents the relative peak intensity of the iTRAQ signature ion m/z 114, 115, 116 or 117 to the iTRAQ signature ion m/z 114.
Next, the original peptide iTRAQ ratio of peptide , [ ] is calculated.
The normalization is performed to make
25
where denotes the median of normalized peptide iTRAQ ratio [ ] of all peptides belonging to in cell state X. is the set containing all
qualified peptides in the dataset, which satisfy the four criteria described above; is the normalized peptide iTRAQ ratio calculated from the normalized iTRAQ peak intensity .
To achieve the above normalization, the normalized peptide iTRAQ signal is
calculated as follows:
where is the normalization factor, which is expressed as
where denotes the median of [ ] of all peptide belonging to . Normalized peptide iTRAQ signals were used for calculating protein abundance ratios.
2.12 Protein quantitation
For determination of the relative expression of proteins in two different cell states, C and T, the relative protein abundance ratio / of protein in two different cell states, C and T, is expressed as
∑
∑
26
where and denote the normalized peptide iTRAQ signal representing the abundance of peptide in cell state C and T, respectively; is the set containing qualified peptides assigned to protein .
We have checked that over 90% of proteins in each dataset were quantified and had the protein abundance ratios.
2.13 Selection of differentially expressed proteins
For both of the small-scale and the large-scale experiments, there were two biological replicate of samples in every condition. In other words, two control tumors (C1 and C2) and two citreoviridin-treated tumors (T1 and T2) from a total of four different mice were
analyzed. Therefore, each protein identified had four protein abundance ratios, / , / , / and / , in an experiment. We calculated the value of each protein,
which is expressed as (
) [ ( ) ( )]
[ ( ) ( )]
[ ( ) ( ) ( ) ( )]
value is also the average of the of these protein abundance ratios. Besides, we
calculated the median of value ( ) in the large-scale experiments. On the other
27
hand, the standard deviation of value ( ) of each protein can be calculated as follows:
√[ ( )] [ ( )]
where / and / are protein abundance ratios of two control tumors (C1 and C2) and two citreoviridin-treated tumors (T1 and T2), respectively.
To select proteins which are differentially expressed between control and citreoviridin-treated tumors, first the errors of value should be considered. The measurement errors in experiments and individual variations among tumors from different mice cause the errors of value. These errors cannot be accounted for the difference between the proteomes of control and citreoviridin-treated tumors. To estimate the errors, and of equation of value are exchanged to calculate the value of
each protein, which is given by (
) [ ( ) ( )]
If there are no measurement errors and individual variations, value should be equal to zero. The value of each protein quantified in the large-scale experiment was calculated for estimate the measurement errors in experiments and individual variations.
In reality, the values are not zero due to the errors. Therefore, the distribution of all value can be deemed as the distribution of errors. Assuming that the errors follow a
28
normal distribution, 1.96-fold of the standard deviation (1.96 S.D.) of values ( ) calculated from the large-scale experiment is statistically significant (P < 0.05) and can be taken as cut-off value for selecting differentially expressed proteins. In the small-scale and large-scale experiments, proteins with value larger than (up-regulated) or smaller than (down-regulated) were selected as differentially expressed. is the median of value and is the standard deviation of values calculated by the data in the large-scale experiment.
The duplicate experiment, which containing two replicate preparations of both controls (C1α and C1β) and citreoviridin-treated (T1α and T1β) tumor samples, is suitable for estimate the measurement errors in experiments. Subsequently, the individual variations of biological replicate of samples can be measured. The value of each
protein in the duplicate experiment was also calculated as follows:
(
) [ (
) (
)]
The standard deviation (S.D.) of values from the duplicate experiment ( ) was calculated. The individual variation resulted from biological replicate of samples ( )
was expressed as
where is the standard deviation (S.D.) of values calculated from the large-scale
29
experiment, which represents the total measurement errors and individual variations among biological replicate of samples.
2.14 Integration of differentially expressed human proteins
After protein identification and quantitation, differentially expressed proteins between control and citreoviridin-treated tumors were selected from the small-scale and large-scale experiments. Our aim is to analyze the effects of citreoviridin on human lung tumors. However, the human lung cancer xenograft tumors were grown in mice and there could be some contaminants of mouse tissue. Therefore, we applied the following analysis strategy to select only human proteins and exclude mouse proteins. First, combined sequence database of Swiss-Prot human database and Swiss-Prot mouse database was searched against in the protein identification procedure and differentially expressed proteins were selected as described previously. To selected only human proteins from all the differentially expressed proteins, three situations and their corresponding protein inference were described here: 1) if a set of peptides matches only human protein, then this protein is selected; 2) if a set of peptides matches only mouse protein, then this protein is excluded; 3) if a set of peptides matches both human and mouse proteins (these proteins are conserved between human and mouse). With the
30
above strategy, differentially expressed human proteins were selected. Subsequently, we took the union of differentially expressed human proteins acquired from both small-scale and large-scale experiments to form the human differential proteomic profiling induced by citreoviridin, which was analyzed by bioinformatics methods later.
2.15 Bioinformatics analysis
We analyzed the human differential proteomic profiling induced by citreoviridin using bioinformatics methods to investigate the effects of citreoviridin on lung cancer xenografts (Figure 8). For Gene Ontology (GO) analysis, DAVID Bioinformatics Resources version 6.751 was used for functional annotation of GO terms biological processes (GOTERM_BP_FAT). The differentially expressed proteins were uploaded and analyzed using functional annotation clustering with human background, high stringent clustering option and enrichment threshold set as 0.05. The functional annotation clustering is designed to reduce the redundancy of GO annotations. It makes the report more focused than the traditional chart report. The grouping algorithm is based on the hypothesis that similar annotations have similar gene members. Therefore, the more common genes two annotations share, the higher probability they are clustered
31
together. For the analysis of only down-regulated proteins, medium stringent clustering option was set and enrichment threshold was set as 0.05.
MetaCoreTM databases and software version 6.10 build 31731 (GeneGo, St. Joseph, MI, USA) was used to map the differentially expressed human proteins. MetaCore is an integrated functional enrichment software suite for analyzing the experimental data. It consists of curated interactions based on manually annotated and regularly updated databases. The databases of MetaCore provide information about interactions between protein and protein, protein and DNA, protein and compound. It also describes metabolic and signaling pathways. For pathway map analysis, the list and expression level data of differentially expressed proteins was uploaded and the intersection between the proteins in our data and the proteins of all pre-existing pathway maps was calculated. The pathway
maps were ordered based on the significance of associating with our protein dataset. We also used the “Analyze network” option to build sub-networks enriched with the
differentially expressed proteins as seed nodes. Sub-networks were ranked by p-value and interpreted in terms of Gene Ontology processes.
2.16 Western blotting
Proteins for Western blotting were extracted from two biological replicates of control
32
and citreoviridin-treated tumors, which were the same protein samples as for iTRAQ proteomics. For electrophoresis, 20 μg proteins each sample were mixed with 5× sample
buffer (250 mM Tris-HCl, pH 6.8, 20% (w/v) SDS, 50% (v/v) glycerol, 40% (v/v) β-mercaptoethanol, 0.25% (w/v) bromophenol blue) and incubated at 95°C for 5 min.
Proteins were subjected to 8% polyacrylamide gel in SDS-PAGE and the electrophoresis was run at 100 V for 90 min. After electrophoresis, proteins were transferred to 0.45 μm polyvinylidene fluoride (PVDF) membrane (Millipore, Bedford, MA, USA) at 260 mA for 45 min. After blocking in 5% (w/v) nonfat milk in TBS containing 0.1% (v/v) Tween 20 at room temperature for 1 h, the membrane was incubated with primary antibody. After incubation of primary antibody, the membrane was washed with TBST for 10 min three times followed by incubation with secondary antibodies diluted in 0.5% (w/v) nonfat milk in TBST. For alpha-enolase, membrane was incubated with ENO1 antibody (1:2500) at 4°C overnight and incubated with anti-rabbit IgG-HRP (1:100000) at room temperature for 3 h. For PEPCK-M, membrane was incubated with PCK2 antibody (1:1000) at 4°C overnight and incubated with anti-rabbit IgG-HRP (1:100000) at room temperature for 3 h. For actin, membrane was incubated with anti-actin (1:5000) at room temperature for 2 h and incubated with anti-mouse IgG-HRP (1:100000) at room temperature for 1 h. The immunoblots were
33
all visualized using Immobilon Chemiluminescent HRP substrate and exposed to X-ray film (Fuji, Tokyo, Japan). X-ray film of Western blot was scanned and quantitation was performed by Kodak 1D image analysis software (Eastman Kodak Co, Rochester, NY, USA).
34
Chapter 3 Results
3.1 Reproducibility assessment by analysis of iTRAQ duplicate experiment
To investigate the effects of targeting ectopic ATP synthase in human lung cancer xenograft model by proteomic analysis, the experiments for acquiring the proteomes should be established. Reproducibility is an important concern for quantitative proteomic study. Any procedure including protein extraction, reduction, alkylation, trypsin digestion and iTRAQ labeling may affect the reproducibility and accuracy of quantitation. The quantitation of protein expression is accurate enough only when the preparations of each sample for LC-MS/MS analysis are consistent. In order to check the reproducibility, two replicate preparations of proteins from both controls (C1α and C1β) and citreoviridin-treated (T1α and T1β) tumor samples were analyzed (Figure 9).
Two replicate proteins were independently extracted from tumors and separately subjected to reduction, alkylation and trypsin digestion. For iTRAQ labeling, equal amounts of peptides from each sample were labeled with iTRAQ. Sample C1α was labeled with iTRAQ 114 tag while sample C1β was labeled with iTRAQ 115 tag.
Sample T1α was labeled with iTRAQ 116 tag while sample T1β was labeled with iTRAQ 117 tag. All iTRAQ-labeled peptides were combined and analyzed by LC-MS/MS.
After protein identification and peptide selection, the original intensity of each iTRAQ
35
signature ions was plotted in Figure 10. Theoretically, the iTRAQ signature ion intensity of each peptide from the two replicate samples should be equal. In our iTRAQ proteomic analysis, there was a high correlation (the correlation coefficient R2 = 0.9769) between two replicate control tumor samples, iTRAQ 114-labeled C1α and iTRAQ 115-labeled C1β (Figure 10A). Two replicate citreoviridin-treated tumor samples, iTRAQ 116-labeled T1α and iTRAQ 117-labeled T1β, also showed high correlation (the correlation coefficient R2 = 0.9879, Figure 10B). The high correlation of peptide iTRAQ signature ion intensity between duplicate samples indicated that the iTRAQ quantitative proteomic experiment has high reproducibility and accuracy.
3.2 Proteomic profiling of citreoviridin-treated tumors
To investigate the proteomic change induced by citreoviridin, proteins of two control tumors (C1 and C2) and two citreoviridin-treated tumors (T1 and T2) from a total of four different mice were analyzed (Figure 11). Proteins were extracted followed by the reduction, alkylation and trypsin digestion procedures. We first performed the small-scale experiment, which analyzed 5 μg peptides of each sample. For iTRAQ labeling, peptides from sample C1, C2, T1 and T2 were labeled with iTRAQ 114, 115, 116 and 117 tags, respectively. All iTRAQ-labeled peptides were combined and
36
analyzed by LC-MS/MS. For protein identification, data from LC-MS/MS analysis were searched against combined sequence database of Swiss-Prot human and Swiss-Prot mouse databases. In this small-scale experiment, we identified 277 proteins with FDR of 3.51%. It was confirmed that 99.72% of identified peptides were labeled with iTRAQ and a total of 1,185 peptides were qualified for protein quantitation (Table
2).
To identify more proteins, large-scale experiment, which analyzed 150 μg peptides of each sample, was performed to acquire the proteomic profiling of two control tumors (C1 and C2) and two citreoviridin-treated tumors (T1 and T2) from a total of four different mice (Figure 11). Peptides from sample C1, C2, T1 and T2 were also labeled with iTRAQ 114, 115, 116 and 117 tags, respectively. To reduce the sample complexity and increase the possibility of detecting low abundance proteins, the combined iTRAQ-labeled peptides were fractioned by strong cation exchange (SCX) chromatography (Figure 12). A total of 39 fractions were individually analyzed by LC-MS/MS. For protein identification, data from LC-MS/MS analysis were searched against combined sequence database of Swiss-Prot human and Swiss-Prot mouse databases. The SCX chromatogram and the number of proteins identified in each fraction were shown in Figure 13. In this large-scale experiment, we identified a total of
37
2,659 proteins with FDR of 2.22% (Table 2). Compared to the results of small-scale experiment, SCX chromatography reduced the sample complexity and enhanced the protein identification. It was also confirmed that 99.53% of identified peptides were labeled with iTRAQ and a total of 28,894 peptides were qualified for protein quantitation (Table 2).
3.3 Optimization of peptide iTRAQ signal normalization
From the small-scale and large-scale experiments described above, proteins expressed in the lung cancer xenograft tumors were identified. The peptides with qualified intensities of iTRAQ signature ions were selected for further quantitative analysis. The iTRAQ signature ions intensities of peptides (hereafter referred to as peptide iTRAQ signals) reflect the abundance of peptides, so they can be used for calculating the relative abundance of proteins in different samples. In practice, deviation of the peptide iTRAQ signals may exist due to the measurement errors in the experiments and the individual variations of biological replicate of samples. Therefore, normalization is necessary for the accuracy in protein quantitation.
About the normalization of the peptide iTRAQ signals, we have tried seven different normalization methods (see Appendix A1 for details) using the dataset from
38
the duplicate experiment (Figure 9), which contained 296 identified proteins and 1,159 qualified peptides for protein quantitation (Table 2). For the normalization performed on the level of peptide iTRAQ signals (method 1 to 5), normalized peptide iTRAQ signals were used for the calculation of protein abundance ratios, / and / . Next, we calculated the values, which represent the errors of protein abundance ratios, followed by calculation of the mean of all values. For the normalization performed on the level protein abundance ratios, protein abundance ratios, / and
/ were calculated from the original peptide iTRAQ signals followed by the normalization of these protein abundance ratios. Subsequently, the values and the mean of all values were also calculated. Compared with other normalization methods, method 7 had the smallest mean of values (Table 3), which indicated that method 7 minimize the deviation from the actual protein abundance ratios. However, normalization method 7 was performed on the level of protein abundance ratios, so it did not directly correct the peptide iTRAQ signals, which were the origin of the deviations. Normalization method 1 and 2, which were performed directly on the level of peptide iTRAQ signals, also had relative small mean of values (Table 3), indicating that method 1 and 2 were also able to minimize the deviation from the actual protein abundance ratios.
39
To test whether method 1 and method 2 had the capability of normalizing larger dataset, we applied these two normalization methods to the dataset of large-scale experiment (Figure 11), which contained 2,659 identified proteins and 28,894 qualified peptides for protein quantitation. We calculated / and / from the normalized peptide iTRAQ signals, followed by the calculation of the mean of values. It was shown that method 1 had smaller mean of values than method 2 (Table 4). Next, normalized peptide iTRAQ signals were used for the calculation of protein abundance ratios, / and / , which represent the relative protein expression in two biological replicate of control tumor samples (C1 and C2) and two biological replicate of
citreoviridin-treated tumor samples (T2 and T1), respectively. In theory, the / and / protein abundance ratios of each protein should be equal to 1. However, the
measurement errors in experiments and the individual variations of biological replicate of samples may cause the deviation from 1. Therefore, a good normalization method is necessary for minimizing the deviation to obtain the accurate protein abundance ratios.
The results showed that the mode of / was -0.2 with the method 1 normalization (Figure 14), while the mode of / and / were both 0 with the method 2 normalization (Figure 15). Compared with method 1, method 2 was able to correct the protein abundance ratios / and / to be closer to 1, that