奧林匹克運動會對地主國股票市場的影響:以北京奧運與倫敦奧運為例
65
0
0
全文
(2) . . I .
(3) . Abstract The main purpose of this research is to use multiple regression models in the examination of the relationship between the Olympics and stock markets of host countries. The research objectives include China, host of Beijing Olympics 2008 and the United Kingdom, host of London Olympics 2012. The dependent variables are Shanghai Stock Exchange Composite Index of China and Financial Times Stock Exchange 100 Index of the United Kingdom. The macroeconomic explanatory variables include unemployment rate, consumer price index, industrial production, exchange rate, interest rate and money supply while the dummy variables are set to the periods between 2008/5 and 2008/11 of the Beijing Olympics and between 2012/5 and 2012/11 of the London Olympics. The empirical results showed that unemployment rate, exchange rate and money supply have no significant effects on the stock markets of China and the United Kingdom. Consumer price index and industrial production have significantly positive effects on the stock market of China but not on the stock market of the United Kingdom. Interest rate has significantly negative effects on stock markets of China and the United Kingdom. The Beijing Olympics 2008 have no significant effects on the stock market of China, but the London Olympics 2012 have significantly negative effects on stock market of the United Kingdom.. Keywords: Olympics, Stock Market, Market Efficiency, Sports Economics. . II .
(4) . 摘要 本研究使用多元迴歸模型,試圖找出奧運的舉辦與地主國股票市場的關係。 研究對象為 2008 年舉辦北京奧運的中國與 2012 年舉辦倫敦奧運的英國。本研 究的應變數為中國的上海證券交易所綜合指數與英國的金融時報 100 指數。本 研究除了將奧運視為虛擬變數以外,還將總體經濟變數納入考量,總體經濟變 數包含:失業率、消費者物價指數、工業生產指數、匯率、利率以及貨幣供給 量。就虛擬變數而言,本研究考量到股市投資者的預期效果與落後效果,設定 北京奧運的時間範圍為 2008 年 5 月到 2008 年 11 月,倫敦奧運的時間範圍為 2012 年 5 月到 2012 年 11 月。實證結果顯示,失業率、匯率與貨幣供給量不會 對中國與英國的股票市場造成顯著影響。消費者物價指數與工業生產指數皆對 中國的股票市場造成顯著的正面影響,但是此二變數對英國的股票市場沒有顯 著影響。而利率對中國與英國的股票市場都造成顯著的負面影響。最後,2008 年北京奧運設定的 2008 年 5 月到 2008 年 11 月的期間對中國的股票市場沒有顯 著影響,但是 2012 年倫敦奧運設定的 2012 年 5 月到 2012 年 11 月的期間對英 國的股票市場有 10%顯著水準的負面影響。 . 關鍵字:奧運、股票市場、市場效率、運動經濟 . . III .
(5) . 誌謝 時光匆匆,兩年的碩士班生涯轉眼即過,終於到了完成論文準備畢業的時 刻,很感謝這兩年來遭遇到的人、事、物。 首先要感謝我的論文指導老師,康信鴻教授。我從碩一剛入學就成為了康 教授的助理,跟康老師有相當長時間的相處。康老師不僅傳授學術上的知識, 也教導我許多做人處世的道理。 再來,我要感謝我的同班同學,你們身上有許多不同的優點與長處讓我學 習。跟你們同學的這兩年讓我學會了很多以前不會的想法、價值觀與態度。 接下來,我想感謝我的家人,尤其是父母。自從我十八歲進入大學以後, 一直都在外地求學,一年中鮮有待在家中的時光。我的父母一直扮演支持我的 後盾,讓我可以毫無後顧之憂地過完我的學生生涯。 最後,我要感謝口試委員們:張紹基老師、許永明老師、林懿貞老師以及 傅英芬老師。學生的碩士論文多有疏漏,感謝各位委員在口試當天不吝給予建 議,使學生的論文可以臻於完美。 . . IV .
(6) . Contents Chapter 1 Introduction ................................................................................................ 1 Chapter 2 Literature Review and Research Direction ................................................ 3 2.1 The Effects of Mega Events .......................................................................... 3 2.2 The Effects of Other Variables on Stock Market .......................................... 8 2.3 Research Direction and Expected Contributions ........................................ 13 Chapter 3 Research Design....................................................................................... 16 3.1 Research method and Research process ...................................................... 16 3.2 Research Variables and Data....................................................................... 22 3.3 Empirical Model .......................................................................................... 29 Chapter 4 Empirical Results ..................................................................................... 31 4.1 Empirical Results and Analyses of China ................................................... 31 4.2 Empirical Results and Analyses of the United Kingdom ............................ 39 Chapter 5 Conclusion and Suggestion ...................................................................... 47 5.1 The Impacts of Macroeconomic Variables on Stock Markets .................... 47 5.2 The Effects of the Olympics on Stock Markets .......................................... 50 5.3 Research Limitation .................................................................................... 53 5.4 Research Suggestions .................................................................................. 54 References ................................................................................................................ 56. . V .
(7) . List of Tables Table 3-1 Summaries of Expected Signs of Explanatory Variables on Dependent Variables ……………………………………………………………… 26 Table 3-2 Summaries of Variables for China …………………………………… 27 Table 3-3 Summaries of Variables for the United Kingdom ……………………. 28 Table 4-1 Primitive Regression Model of China …...…………………………… 32 Table 4-2 Multicollinearity Test of China ………………………………………. 33 Table 4-3 Revised Regression Model of China ….…………………………….... 34 Table 4-4 Heteroskedasticity Test for Revised Regression Model of China ……. 35 Table 4-5 Autocorrelation Test for Revised Regression Model of China ………. 35 Table 4-6 Final Regression Model of China ……………………………………. 36 Table 4-7 Primitive Regression Model of the United Kingdom ……….……..… 40 Table 4-8 Multicollinearity Test of the United Kingdom …………………….… 41 Table 4-9 Revised Regression Model of the United Kingdom …………………. 42 Table 4-10 Heteroskedasticity Test for Revised Regression Model of the United Kingdom ………………………………………………… 43 Table 4-11 Autocorrelation Test for Revised Regression Model of the United Kingdom ………………………………………………… 43 Table 4-12 Final Regression Model of the United Kingdom …………..……….. 44. List of Figures Figure 3-1 Flowchart of Model Modification Process ………………………..… 21. . VI .
(8) . Chapter 1 Introduction The advancements of telecommunication and transportation contribute to the increasing frequency and easily access between international communications in recent years. In every few years, there will be some mega events that provide a stage for countries to demonstrate their national power. Such types of mega events are multifarious, including exposition mega events such as World Expo and International Flora Expo or sport mega events such as FIFA World Cup and the Olympics. The holding of mega events usually requires a lump sum of money from the host country to renew the infrastructure and plan the entire event. In 1984, the U.S. held the Los Angeles Olympics through commercial methods such as selling tickets, offering TV live broadcasting, accepting sponsorship, advertisement and recruiting volunteers. The U.S. government hit a huge success in receiving a significant amount of revenue. Ever since then, countries worldwide consider the hosting of mega events as an excellent opportunity to increase international visibility and image while bringing certain economic advantages. For this reason many nations are committed in applying for the hosting of mega events in these years. However, it requires huge government expenditure to host a mega event. The government would convince people by claiming the substantial benefits to be brought upon the hosting of mega events. Nonetheless, many people are still skeptical about the claims, knowing that they would not receive as plentiful revenue. . 1 .
(9) . as Los Angeles. For example, the Greece government spent large sum of money but suffered deficits after the 2004 Athens Olympics. Although we cannot attribute the debt crisis to the hosting of Olympics, such claim is unlikely to be supported in the case of Greece. The stock market is a leading indicator of business cycle. The Efficient Market Hypothesis suggested that stock market would reflect information quickly. If investors are optimistic about the future after receiving the information, then the stock market will prosper more, and vise versa. Therefore, this study will examine the relationship between the Olympics and the stock market of hosting countries to test the claims for benefits through hosting Olympics. This research applies multiple regression models to test the effects of the Olympics on the stock markets of China and the United Kingdom. The dependent variables include Shanghai Stock Exchange Composite index of China and Financial Times Stock Exchange 100 index of the United Kingdom. The explanatory variables include unemployment rate, consumer price index, industrial production, exchange rate, interest rate, money supply and the Olympics. The research process is described in the follows. Chapter 1 presents the introduction and motivation. Chapter 2 reviews relevant literatures. Chapter 3 explains the research methods. Chapter 4 shows the empirical results. Finally, Chapter 5 is the conclusions and suggestions.. . 2 .
(10) . Chapter 2 Literature Review and Research Direction In this Chapter, this study will review the literatures related to the overall effect of mega events, the effects of mega events on the stock market, and the other effects of independent macroeconomic variables on the stock market. Then, this study presents research direction and expected contributions.. 2.1 The Effects of Mega Events 2.1.1 The Overall Effects of Mega Events Nowadays, governments of many countries are committed applying for the mega events. At the same time, the governments will inform people of the many benefits through the hosting of mega events, including improved national development, increased international visibility, promoting tourism, economy and the domination in the world. So, this study divided the possible effects of mega events into two sides. One is the economic side whereas the mega events may promote consumption, investment, and tourism, following the increase of gross domestic product. Another is the non-economic side, or so-called mental side, which is difficult to be measured in monetary term as people may perceive happiness, pride and more identity with their countries. Due to the difficulty in measurement of the mental side, this research will focus on the economic side. Chiang (2008) mentioned that hosting mega events offers some positive benefits, including politics, economy, tourism and culture. However, the negative effects accompanied include a large sum of government expenditures, crowding out. . 3 .
(11) . effect of socially vulnerable groups and the valley effect. Nonetheless, Chiang suggested that if the concerning authorities could prepare comprehensive plan and efficient implementation, the hosting of mega events will become more advantageous. From the perspective of economic side, hosting mega events will increase public expenditure because local governments will maintain or rebuild infrastructure such as new gymnasium, urban renewal and planning additional mass transit systems. Such measures may cause housing price to increase in the future. Kontokosta (2011) used adjusted time-series method to compare the host cities of the Olympics and nearby cities. He discovered that the Olympics are not the one perfect policy that fits all in terms of acquiring economic benefits. Kontokosta believed that government should plan and implement while the people should support this policy with honor so that the housing price will increase significantly. And Kavetsos (2012) applied semi-log model to find out that overall housing price in London, which increased by 1.5 billion pound sterling after London announced the hosting of 2012 Olympics. But the levels of price increasing vary from place to place. Nevertheless, Chiang (2008) disagree with the concept that hosting mega events may increase the housing price. He mentioned of some valley effects associated. Namely, the large fiscal expenditure of local government will crowd out other use after the events. Moreover, there is a white elephant effect, whereas many buildings were constructed for a unique purpose and these buildings are difficult to. . 4 .
(12) . be transformed into other purposes, yet requiring a large sum of money to maintain. From the perspective of non-economic side, the public may increase identify with the city or country as well as perception of honor. The city or country will increase it publicity while improving its dominance in the world. Kavetsos and Szymanski (2008) used the questionnaire data from Europe to conduct regression analyses. They found that the European people perceived better during the mega football games period such as World Cup or the UEFA Champions League. In general, most people were proud of their cities with game hosting. However, the degree of “better perception” depended on how much they loved this sport. If the government host a sports game they are least fond of, such martial arts, the degree of well perception will become less significant. 2.1.2 The Effects of Mega Events on the Stock Market Based on the Efficient Market Hypothesis, if one stock market is efficient, all information will reflect on the stock market completely. Hosting mega events may stimulate consumption, tourism, investment and government expenditure and attain some benefits. In other words, many fiscal deficits or maintenance fees were also derived, resulting in a controversial issue over the pros and cons between the economies of countries hosing mega events. The stock market is seen as an important indicator of business cycle. We can infer partial economic condition in the future through the performance of the stock market. This study will discuss the pros and cons between the hosting mega events for the future economy. According to the Hypothesis of Efficient Market, if the. . 5 .
(13) . investors perceive the good sides of the hosting of mega events, they will be optimistic about the future which causes the stock market index to increase. In contrary, they will be pessimistic about the future which causes the stock market index to decrease. The information of mega event can be divided into three phases. The first one is the hosting of nations announced to receive hosting rights. The second one is the opening of the event. The third phase refers to the ending of the event. Li (2007) discovered that in the Olympics, World Cup and the UEFA Champions League, host announcement and the opening are insignificant to the stock market and the trading volume did not encounter significant difference. However, the ending of events is significantly related to the stock market. Beijing applied for hosting of Olympics twice, namely the first one in 2000 and the second one in 2008. The former failed but the latter succeeded. Liu (2011) employed the event study approach to analyze these two periods. Liu discovered that the success of application of the Olympics is negatively related to the stock market. Thus, Liu inferred that hosting the mega events might face with some negative effect on the hosting nation. This study is skeptical to the statement that hosting mega events is beneficial to the economy. Nishio, Lim and Downward (2009) did the cross-sectional analysis of the host applications between the winning cities and losing cities, in addition to conducting research of whether if there is significant difference in their stock markets. Nishio et al. found that mega events serve as factors that influence the stock price. But the. . 6 .
(14) . directions are uncertain, and it must study the relevant industries with the Olympics. However, Martins and Serra (2007) employed the event study to host countries of Olympics, World Cup, UEFA Champions League, World Expo and European Capital of Culture. Martins et al. found that there are no significant positive effects on stock market in these hosting countries. Furthermore, there are still no significant positive effects to the relevant industries. Veraros, Kasimati and Dawson (2004) conducted the event study on Athens and Milan, who competed for the hosting of 2004 Olympics. They discovered that there is a positive effect on the Athens stock market, which won the hosting of 2004 Olympics. There is no significant effect on the Milan stock market, the losing host. Samitas, Asteriou and Kenourgios (2012) employed OLS regression model and GARCH model to discover that there are limited evidences to infer the significant relationship between the Olympics and London stock market. Nonetheless, the negative relationship between host announcement and oil and gas industry exists. Kaplanski and Levy (2011) discovered the investors might make different investment decision during mega event period. In the period of the World Cup 2010 in Germany, the results of games add instability to the emotion of investors, which affected the stock price. It will affect the efficiency of market in the short term. But in the long run, the market will be return to efficiency. Finally, the mega events will affect the performance of relevant industries and their stock price, followed by affecting the stock market. Chen (2007) studied the factors that influenced the stock price of China hotel industry. Chen considered. . 7 .
(15) . Beijing Olympics as a non-macroeconomic factor and discovered that the Olympics game was negatively related to stock price of China hotel industry. Samitas, Kenourgios and Zounis (2008) studied the relationship between sponsorship and stock price of the Athens Olympics 2004. They discovered sponsorship affecting the stock price positively. To sum up, the relationship between Olympics and the stock market of hosting nations is still uncertain. This study will look into Beijing Olympics 2008 and the London Olympics 2012 to find out the relationship between the Olympics and the stock market.. 2.2 The Effects of Other Variables on Stock Market Except for the mega events like the Olympics or World Cup, there are still are large numbers of variables that affect the stock market. The following are six macroeconomic variables. (1) Unemployment Rate Birz and Lott Jr. (2011) said that the information of macroeconomic variables would affect the return of the stock market. Previous studies discovered that there were no significant relationship between macroeconomic variables and stock returns. Thus, they used newspaper as a proxy of information delivery to examine the impacts of economic growth rate, unemployment rate, retailing sales and demand change of durable goods on the return of stock market. The empirical evidences showed that economic growth rate and unemployment rate affect the return of stock market significantly. Birz and Lott Jr. also inferred that the. . 8 .
(16) . information of unemployment rate would cause negative expectations from investors and negative stock return. Bestelmeyer and Hess (2010) discovered the information of macroeconomic condition would cause volatility of stock market severely. But the results are mixed by many different factors and affected by business cycles. Their empirical evidences showed that the information of unemployment rate would influence the pricing decisions of investors. And there is a negative relationship between unemployment rate and return of stock market. (2) Consumer Price Index Bekaert and Engstrom (2010) employed the Fed Model to examine their research. In a Fed Model, the return of stock market will be equal or highly related to return of the Treasury Bills. Looking into the U.S. data, there are highly related between stock return and bond return in time-series indeed. This relationship is attributed to that stock return and bond returns are highly correlated to inflation rate. From the U.S. data, high expectation of inflation will make higher uncertainty to economic growth and higher risk aversion, which will increase stock return. Chen (2009) examined effects of the macroeconomic variables on the recessionary stock market. And the research objective is S&P 500 index. Chen employed parameter and non-parameter analysis to find out the recession phase. The empirical evidences showed that the difference of yield curves and inflation rate have high relationship with stock market. These two factors can be used to forecast the recession phase of U.S. stock market.. . 9 .
(17) . (3) Industrial Production Srinivasan (2012) employed Johansen and Juselius multivariate cointegration test to examine the long-term relationship between India NSE index and macroeconomic variables like industrial production, money supply, interest rate, exchange rate and consumer price index. The empirical evidences showed that there are long-term positive relationships between India NSE index, money supply and industrial production. Ali, Rehman, Yilmaz, Khan and Afzal (2010) examined the relationship between Pakistan stock market and macroeconomic variables. The research period lasted from June 1990 to August 2008. Ali et al. used Granger Causality Test, which applied Karachi Stock Exchange index as the dependent variable and money supply, industrial production, exchange rate, inflation rate and current account as the independent variables. The empirical evidences showed that there are no Granger causality relationship between KSE index and industrial production. (4) Exchange Rate Gay Jr. (2008) employed Box-Jenkins ARIMA model to examine the relationship between stock market in developing countries and macroeconomic conditions. The research objectives are Brazil, Russia, India and China. The empirical evidences showed that there are no significant relationship between the exchange rate and the stock market in these four countries. Otherwise, Gay Jr. found that there are no relationship between the past returns and the future returns of these four countries. Thus, Gay Jr. inferred that the stock markets of these four. . 10 .
(18) . countries are weak form efficiency. Beer and Hebein (2008) used exponential general autoregressive conditional heteroskedasticity (EGARCH) to analyze the relationship between stock markets and exchange rates of two groups, developed countries and developing countries. The empirical evidences showed that the change of exchange market would spill to the stock market in Canada, Japan, U.S. and India; and the relationships are positive. (5) Interest Rate Alam and Uddin (2009) employed multiple regression models to examine the relationship between the interest rates and stock markets. The research objectives are divided into developed and developing countries including Australia, Bangladesh, Canada, Chile, Columbia, Germany, Italy, Jamaica, Japan, Malaysia, Philippine, South Africa, Spain and Venezuela. The period lasted from Janaury 1988 to March 2003. The evidences showed there are significantly negative relationships between interest rates and the stock markets of these countries. Birru and Figlewski (2010) studied the relationship between the stock price and the interest rates announced by the FED. The FED announced the target interest rates eight times a year. Based on the Efficient Market Hypothesis, the public will reflect the information quickly after receiving the information of interest rate. But in reality, the time required for each investor varies. Investors also anticipate the time needed by other. Thus, the information of interest rate cannot fully reflect on the stock price. The evidences showed that information of interest rate announcement is. . 11 .
(19) . very important. The stock price will change significantly after the information announced. (6) Money Supply Humpea and Macmillana (2009) studied the forty monthly data of U.S. and Japan. They used cointegration test to examine the relationship between the stock price and industrial production, consumer price index, long-term interest rate and money supply. The evidences showed that the relationship between U.S. stock price and money supply is positive but insignificant. However, the relationship between Japan stock price and money supply is significantly negative. This study inferred that the difference between U.S. and Japan is the possible reason of liquidity trap which Japan suffered after 1990. Chatziantoniou, Duffy and Filis (2013) used structural VAR model to examine the relationship between the stock market and the monetary and fiscal policies in Germany, United Kingdom and U.S. The evidences showed that there is significant relationship between stock market and monetary and fiscal policies directly or indirectly. This study suggested that it could receive better results by adding monetary and fiscal policies into model together.. . 12 .
(20) . 2.3 Research Direction and Expected Contributions In the past two decades, many countries worldwide devoted to applying for the hosting of mega events. Mega events can help these governments attract investment, conduct urban renewal, promote tourism and increase the international visibility. Thus, these governments claim that the benefits exceed costs by hosting mega events. Taiwan government is no exception. In these years, Taiwan applied for and hosted some mega events in addition to spending a lump sum of money. This study will examine the relationships between the Olympics and the stock markets between China and the United Kingdom to find out whether the mega events are beneficial to the economies of hosting countries. Because stock market is the leading indicator of business cycle, it can reflect the benefits or harms from hosting mega events. Therefore, this research will test whether the significant difference exists in stock market during Olympics. Li (2007) conducted similar research however his objective aims at the 2008 Beijing Olympics. This study takes into account of some differences between investors in China and United Kingdom. So, this study will do further analysis and comparison to these two stock markets. Furthermore, there are many factors will influence stock market. Thus, this study also takes other macroeconomic explanatory variables into account. These explanatory variables are unemployment rate, consumer price index, industrial production, exchange rate, interest rate and money supply. By adding these variables, the regression models will be more comprehensive.. . 13 .
(21) . Other than the Olympics, there are other important mega events. The FIFA World Cup is also a popular and vital mega event. Hsieh (2011) studied the effects of the FIFA World Cup on the demand of airlines and took Germany and U.S for examples. Hsieh employed multiple regression models and independent variables such as the FIFA World Cup, unemployment rate, population, consumer price index, gross domestic product, crude oil price, exchange rate and trade weighted value of U.S. The evidences showed that there is no significant effect of the 2006 World Cup on demand of airline for Germany and there is significant effect of the 1994 World Cup on demand of airline for U.S. Hsieh concluded that there are not entirely positive economic effects of mega events on the hosting countries. It depended on the macroeconomic condition and international politics at that time. This research studied the other mega event, the Olympics. The objectives and time periods also differ from those of Hsieh’s study. Hsieh studied the demand of airline while this research emphasized on the stock market. This research intended to yield the different conclusions through objectives. The following are the directions of this research. 1.. The monthly data from 2006/1 to 2009/3 of China and from 2010/1 to 2013/3 of the United Kingdom to construct two regression models for the analysis on the stock markets for China and the United Kingdom.. 2.. The effects of the Beijing Olympics 2008 on the stock market of China were analyzed.. . 14 .
(22) . 3.. The effects of the London Olympics 2012 on the stock market of United Kingdom were analyzed.. 4.. The effects of the macroeconomic variables on the stock markets of China and United Kingdom were analyzed.. 5.. Some suggestions to governments were delivered which will make plans for the hosting of mega events in the future.. 6.. Delivering some suggestions to further research about the effect of mega events on the stock markets of host countries.. . 15 .
(23) . Chapter 3 Research Design This research applies multiple regression models to discuss the relationship between the Olympics and the stock market. There are three sections in this chapter to describe the process of the analysis of the multiple regression models. The first section illustrates the methodologies and process. The second section explains the variables, definition and sources. And the third section sets up the two empirical models.. 3.1 Research method and Research process This research applies multiple regression models to conduct empirical analysis. And the statistic tool is Eview 5.0. This research will discuss the relationship between the Olympics and the stock markets of China and the United Kingdom. Therefore, this study will set up two regression models of China and the United Kingdom separately. The dependent variables are Shanghai Stock Exchange Composite Index from China and Financial Times Stock Exchange 100 index from the United Kingdom. The independent variables are the Olympics and other macroeconomics variables including unemployment rate, consumer price index, industrial production, exchange rate, interest rate and money supply. After setting up primitive regression models, this research will conduct multicollinearity test, heteroskedasticity test and autocorrelation test to cancel some inappropriate variables. Finally, this study will receive modified regression models under the requirement of Best Linear Unbiased Estimator (BLUE) and Ordinary. . 16 .
(24) . Least Squares (OLS). To achieve the requirement of BLUE and OLS, the regression model needs to follow some criteria. Gujarati and Porter (2010) documented five attributes of a good model: 1.. Parsimony: As we know that there is some gap between reality and theoretical model. Therefore, a model never captures the reality completely. The parsimony means that a model needs to keep as simple as possible.. 2.. Identifiability: The meaning of identifiability is that the estimated parameter must have unique values.. 3.. Goodness of Fit: There is adjusted R-square in the regression analysis. The adjusted R-square stands for the explanatory ability of the independent variables to dependent variable. Therefore, this study want adjusted R-square as higher as possible.. 4.. Theoretical Consistency: If one or more coefficients show the wrong sign, a model may not be seen as good one. So, this study should use some economic concepts to set up models and expect the signs of coefficients.. 5.. Predictive Power: If there are many regression model can be chosen, this study should choose the one whose theoretical predictions are verified by actual experience.. . 17 .
(25) . 3.1.1 Research Methods (1)Multicollinearity test In statistics, the multicollinearity is a phenomenon where one or more independent variables in a multiple regression model are highly correlated. If there are multicollinearity problems, the standard errors of the problem variables tend to be large. In this case, the test of the hypothesis leads to a failure in that the null hypothesis is not rejected. Besides, there will be some unreasonable results such as biased estimator. Therefore, this research will use Klein’s method to examine it. Klein says, “Intercorrelation of variables is not a necessarily problem unless it’s high relative to overall degree of multiple correlations.” The Klein’s rule: First, conducting the OLS regression model to find out the !!! of ! = !! + !! + !! + !! + ⋯ + !! Second, conducting the OLS regression model to find out the !!! of !! = !! + !! + !! + ⋯ + !! !! = !! + !! + !! + ⋯ + !! !! = !! + !! + !! + ⋯ + !! Third, if !!! < !!! , it means the dependent variable !! is highly multicollinear to other variables. The Klein’s method shows which independent variable with multicollinearity and may be omitted possibly. Nevertheless, this study must also take the. . 18 .
(26) . significance of the variables into consideration. (2) Heteroskedasticity Test As mentioned before, using ordinary least square (OLS) method to attain a regression model implies some assumptions to be obeyed. One is that the error term is with a constant variance. Under this assumption, the OLS estimator will be Best Linear Unbiased Estimator (BLUE). If there is a heteroskedasticity problem, the OLS estimator is still unbiased, but not with minimum variance anymore. That is, the OLS estimator is Linear Unbiased Estimator (LUE) but not Best Linear Unbiased Estimator (BLUE). If this study still uses this OLS estimator with heteroskedasticity problem, it may not draw good inferences and conclusions. Hence, this study should use White Heteroskedasticity Test from Eview 5.0 to examine and prevent heteroskedasticity in this research. In White Heteroskedasticity Test, this study define the null hypothesis is that there is no heteroskedasticity. If the test shows that P-value is larger than the significance level set before (suppose 0.05), then the null hypothesis will not be rejected. In this case, the evidence shows that there is no heteroskedasticity. (3)Autocorrelation Test When using multiple regression model to analyze data, there are some assumptions should be satisfied. One of these is that the error terms of dependent variables should be independent from each other independent variables. If autocorrelation problems exist, the assumption will no longer be fulfilled and the estimator will not become Best Linear Unbiased Estimator (BLUE). Therefore, the t. . 19 .
(27) . test and F test will not work properly. This study used the Durbin-Watson statistics to check whether the autocorrelation problems exist or not. And the criterion is !! < ! < 4 − !! . If the ! is not in the interval, there is a first-order autocorrelation problem. Under this circumstance, this study will add a correction term AR(1) into this multiple regression model.. . 20 .
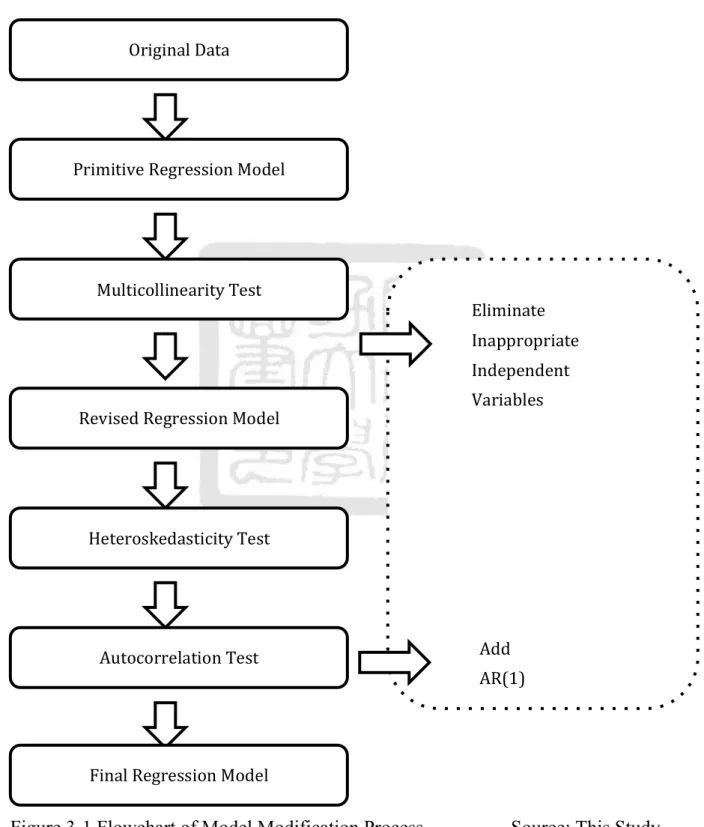
(28) . 3.1.2 Flowchart of Model Modification Process Based on the research methods, the following is the flowchart of model modification process. Original Data . Primitive Regression Model . Multicollinearity Test . Eliminate Inappropriate Independent Variables . Revised Regression Model . Heteroskedasticity Test . Add . Autocorrelation Test . AR(1) . Final Regression Model . Figure 3-1 Flowchart of Model Modification Process. . 21 . Source: This Study.
(29) . 3.2 Research Variables and Data In this section, this study will explain the definitions, time periods and sources of the variables. This research use monthly data collected from databases. The time periods lasted from January 2006 to March 2009 for China and from January 2010 to March 2013 for the United Kingdom. At the end, these variables are summarized into Table 3-1, Table 3-2 and Table 3-3. 3.2.1 Dependent Variables The main purpose of this research is to discuss the relationship between the Olympics and the stock market of hosting countries. Thus, the research applies Shanghai Stock Exchange Composite Index (SSE) for China and Financial Times Stock Exchange 100 Index (FTSE) for the United Kingdom as dependent variables, to reflect on the stock market conditions. Both were collected from EconStats database and labeled as “close of month”. 3.2.2 Independent Variables In addition to the dummy variable, the Olympics, there are many macroeconomic variables that may affect the stock market. The following are six quantitative variables including unemployment rate, consumer price index, industrial production, exchange rate, interest rate and money supply. And the Olympics is qualitative (or dummy) variable. (1)Unemployment Rate The definition of unemployment rate is that unemployed workers are divided by labor force. It is an important indicator to reflect business cycles. If the. . 22 .
(30) . unemployment rate is high, more workers are likely to be unemployed. Therefore, they may depend on their savings for living and invest less on the stock market. On the contrary, when the unemployment rate is low, workers with a stable income will invest more on the stock market. Hence, the unemployment rate has a negative effect on the stock market. (Birz et al., 2011; Bestelmeyer et al., 2010) (2)Consumer Price Index The consumer price index (CPI) is a key indicator to measure the inflation of one country. Most governments in the world are dedicated to maintain a stable CPI. When inflation increases, all prices of goods and service will increase. It will affect the stock price and drive the stock market index rise. In the meantime, inflation increase will make real interest rate decrease since real interest rate is equal to the value of nominal interest rate minus inflation rate. Therefore, investors may transfer their assets from low risk position to high risk and high return position. It also drives the stock price and stock market up. For this reason, this study supposes that CPI is positively related to stock market. (Bekaert et al., 2010) (3)Industrial Production The industrial production is an indicator that reflects the change of industrial output level within one country. It also can be used to reflect the economic condition at a particular time. If the industrial production is high, we can infer that the demand is high and industrial sector needs to manufacture more goods. Likewise, if the industrial production is low, we can infer that the demand shrinks. . 23 .
(31) . and the capacity utilization of industrial decreases. Thus, this research assumes that the industrial production has a positive effect on stock market. (Srinivasan, 2012) (4)Exchange Rate Exchange rate refers to the rate which one currency will be exchanged into another. The study applies US Dollars (USD) as currency exchange into the amount of Chinese Yen and Pound Sterling. The exchange rate will affect the amount of net export directly. For instance, if Chinese Yen depreciates, the exporters of China will gain some benefits and be stimulated to export more goods to other countries. When currency depreciates, the price of domestic products will decrease and these products become more competitive in the global market. Thus, net export increase will help domestic companies make more profits and increase the market price. Due to the above reasons, this study supposes that the exchange rate is positively related to stock market. (Beer et al., 2008) (5)Interest Rate There are two meanings of the interest rate. First, interest rate is the cost of direct investment. When the interest rate rises, the cost of direct investment will increase, which causes private sectors to level down their future investment. Thus, the private corporations may lose their abilities to create revenue in the future, which consequently affect stock price and stock market. Second, interest rate is the key factor of bond interest income for financial investment. If the interest rate rises, the yield to bond will increase. It is one important incentive to make investors. . 24 .
(32) . substitute holding bonds to purchasing stocks. According the above discussion, this study supposes that the interest rate is negatively related to stock market (Alam et al., 2009). Moreover, the data of China were collected from People’s Bank of China and we use the one-month London Interbank Offered Rate as the interest rate of the United Kingdom. (6)Money Supply Money supply is decided by the central bank, it is a vital policy tool to control the economy in one country. If money supply increases, massive money will flow into capital market. The stock market will boom and the stock price rises. Therefore, we assume there is a positive relationship between money supply and the stock market. (Humpea et al., 2009; Chatziantoniou et al., 2013) Moreover, there are different ways to calculate money supply. This study uses the definition of M2 and collected data from the central banks, People’s Bank of China and Bank of England. (7)The Olympics The Olympics is held every four years and regarded as the most important mega event in the world, whereas many countries strive to win the hosting. According the literature review in Chapter two, the effect of mega events on the stock markets in host countries is still an enigma. Some empirical evidences showed that there is some positive effect on the stock market (Veraros et al., 2004; Nishio et al., 2009). Other evidences showed that the mega events have negative effect on the stock market. (Li, 2007; Liu, 2011; Samitas et al., 2012). . 25 .
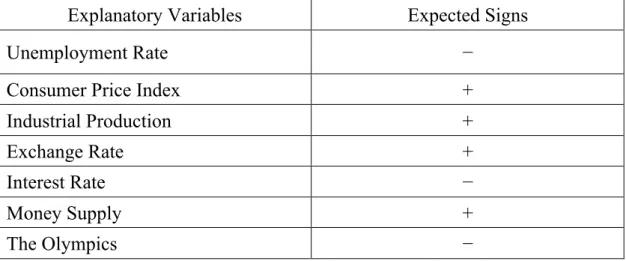
(33) . However, this study supposes that the Olympics have negative effects on the stock markets of hosting countries. That is, this study proposes that holding Olympics is disadvantageous in economy of hosting countries. On the other hand, it may draw positive effects on the mental state of the people in hosting countries. (Kavetsos et al., 2008 Kaplanski et al., 2011) In this study, the Olympics game is the only qualitative variable. The Beijing Olympics 2008 was held in August of 2008, and the London Olympics was held in July of 2012. This research takes anticipation effect and time lag effect into consideration, and sets up a more open interval of these dummy variables. The Beijing Olympics 2008 dummy variables consist of 1, time between May 2008 and November 2008, and all other time as 0. The London Olympics 2012 dummy variables consist of 1, time between May 2012 and November 2012, and all other time as 0. 3.2.3 Tables of Data Table 3-1 Summaries of Expected Signs of Explanatory Variables on Dependent Variables Explanatory Variables. Expected Signs. Unemployment Rate. −. Consumer Price Index. +. Industrial Production. +. Exchange Rate. +. Interest Rate. −. Money Supply. +. The Olympics. −. Source: This Study. . 26 .
(34) . Table 3-2 Summaries of Variables for China Symbols. Variables. Units. Shanghai Stock !!". Exchange. Time Periods. Frequencies. 2006/1~. Monthly. Index. Sources. EconStats 2009/3. Composite Index. Data Ministry. !"!. Unemployment Rate. of. 2006/1~. Monthly. Human Resources. 2009/3. Data. and. Percentage Social. Security, CN !"#!. !"!. Consumer Price Index Industrial Production. Exchange Rate. to. Interest Rate. Money Supply. 2009/3. Data. of Statistics, CN. 2006/1~. Monthly. National. 2009/3. Data. of Statistics, CN. 2006/1~. Monthly. 2009/3. Data. 2006/1~. Monthly. International. 2009/3. Data. Monetary Fund. 2006/1~. Monthly. People’s Bank of. 2009/3. Data. China. 2008/5~ The Olympics. 2008/11=1 Otherwise =0. . Bureau. Federal Reserve. Yen Billions. !!. Bureau. Percentage Chinese. !"!. National. Chinese Yen. !"!. Monthly. Index Dollar. !"!. 2006/1~ Index. 27 .
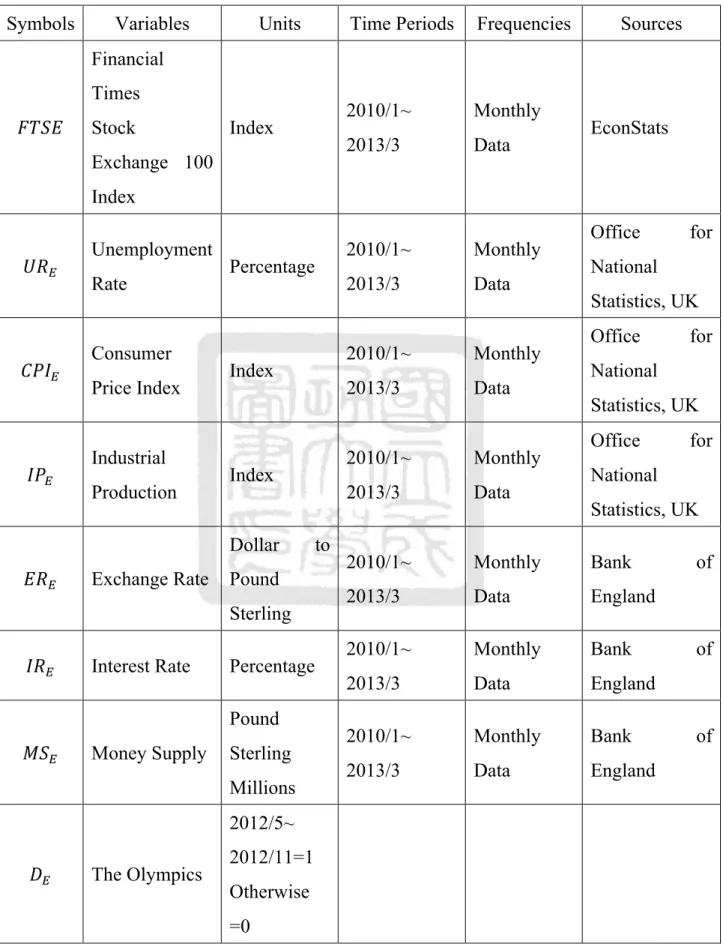
(35) . Table 3-3 Summaries of Variables for the United Kingdom Symbols. Variables. Units. Time Periods. Frequencies. Sources. 2010/1~. Monthly. 2013/3. Data. 2010/1~. Monthly. 2013/3. Data. 2010/1~. Monthly. 2013/3. Data. 2010/1~. Monthly. 2013/3. Data. 2010/1~. Monthly. Bank. 2013/3. Data. England. 2010/1~. Monthly. Bank. 2013/3. Data. England. 2010/1~. Monthly. Bank. 2013/3. Data. England. Financial Times !"#$. Stock. Index. Exchange 100. EconStats. Index !"!. !"#!. !"!. Unemployment Rate Consumer Price Index Industrial Production. Percentage. Index. Index Dollar. !"!. Exchange Rate. Pound Sterling. !"!. Interest Rate. Percentage Pound. !"!. Money Supply. Sterling Millions. to. 2012/5~ !!. The Olympics. 2012/11=1 Otherwise =0. . 28 . Office. for. National Statistics, UK Office. for. National Statistics, UK Office. for. National Statistics, UK of. of. of.
(36) . 3.3 Empirical Model According the previous discussion, this research will establish two multiple regression equations to analyze the impact of the Olympics on the stock market for host countries, China and the United Kingdom. 3.3.1 The Regression Model for China !!"! = ! + !! !"!. !. + !! !"#!. +!! !"!. !. !. + !! !"!. + !! !"!. !. !. + !! !"!. !. + !! (!! )! + !! Equation (3.1). Where, !!"! : Shanghai Stock Exchange Composite Index !: Period t !: Constant Term !! : Coefficient of independent variables !! : Residual term !"! : Unemployment Rate of China !"#! : Consumer Price Index of China !"! : Industrial Production of China !"! : Exchange Rate of China !"! : Interest Rate of China !"! : Money Supply of China !! =1, 2008/5~2008/11 =0, otherwise. . 29 .
(37) . 3.3.2 The Regression Model for the United Kingdom !"#$! = ! + !! !"!. !. + !! !"#!. !. + !! !"!. +!! (!"! )! + !! !"!. !. !. + !! !"!. !. + !! (!! )! + !! Equation (3.2). Where, !"#$! : Financial Times Stock Exchange 100 Index !: Period t !: Constant Term !! : Coefficient of independent variables !! : Residual term !"! : Unemployment Rate of the United Kingdom !"#! : Consumer Price Index of the United Kingdom !"! : Industrial Production of the United Kingdom !"! : Exchange Rate of the United Kingdom !"! : Interest Rate of the United Kingdom !"! : Money Supply of the United Kingdom !! =1, 2012/5~2012/11 =0, otherwise. . 30 .
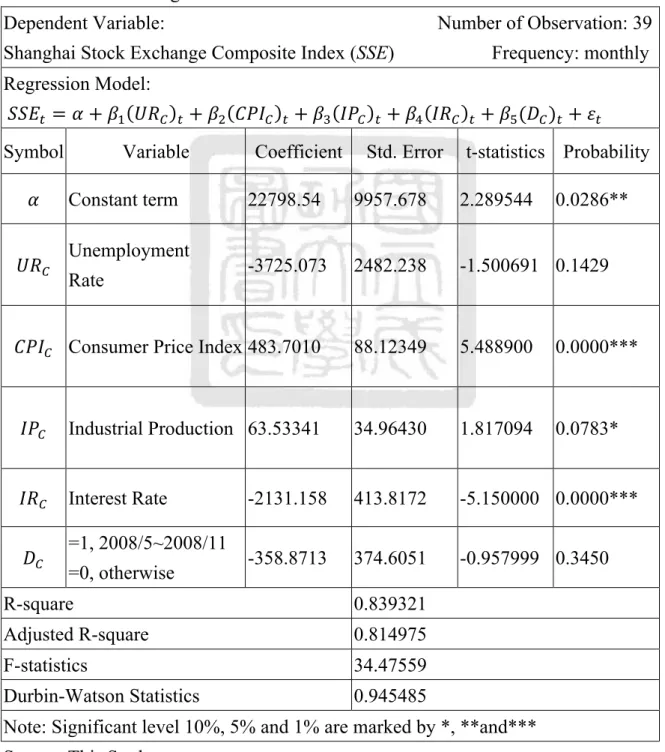
(38) . Chapter 4 Empirical Results After the establishment of two multiple regression models, this study will show the empirical results of China and the United Kingdom separately. First, this research shows the primitive regression model before the modification process. Second, this research will conduct the multicollinearity test using the Klein’s method. Then, taking significance and multicollinearity into consideration, some improper independent variables will be omitted to generate a revised regression model. Third, this study will carry out the heteroskedasticity test using White Heteroskedasticity Test and autocorrelation test by Durbin-Watson Test. Fourth, after completing all modifications, a final regression model will be established. Finally, this research will use the empirical results from the two final regression models for analysis.. 4.1 Empirical Results and Analyses of China The table 4-1 shows the primitive regression model of China. It shows that unemployment rate (UR) is under 10% significance and consumer price index (CPI), industrial production (IP) and interest rate (IR) are under 1% level. In this primitive model, the dummy variable, the Olympics are not significant. However, this model is not revised through the modification process. There might be some multicollinearity, heteroskedasticity or autocorrelation problems which do not fit the requirement of BLUE. Therefore, this study is required to make a number of modifications.. . 31 .
(39) . 4.1.1 Primitive Regression Model of China Table 4-1 Primitive Regression Model of China Dependent Variable:. Number of Observation: 39. Shanghai Stock Exchange Composite Index (SSE) Regression Model: !!"! = ! + !! !"! +!! !"! Symbol ! !"!. !"#!. !"!. Variable. + !! !"#!. + !! !"!. !. 21491.11. Unemployment Rate Price. Index Industrial Production. !. + !! !"!. !. + !! !"!. 12543.00. t-statistics. Probability. 1.713394. 0.0966*. -4130.299 2335.770. -1.768282. 0.0869*. 405.4441. 91.82625. 4.415340. 0.0001***. 141.8304. 47.55777. 2.982277. 0.0055***. !"!. Exchange Rate. -57.42305 951.5984. -0.060344. 0.9523. !"!. Interest Rate. -2054.066 388.9524. -5.281022. 0.0000***. !"!. Money Supply. 0.059125. 0.974469. 0.3374. -1.570815. 0.1264. 0.060674. =1, !!. 2008/5~2008/11. -617.1159 392.8636. =0, otherwise R-square. 0.867925. Adjusted R-square. 0.838101. F-statistics. 29.10206. Durbin-Watson Statistics. 1.328252. Note: Significant level 10%, 5% and 1% are marked by *, **and*** Source: This Study. . !. + !! (!! )! + !!. Coefficient Std. Error. Constant term. Consumer. !. !. Frequency: monthly. 32 .
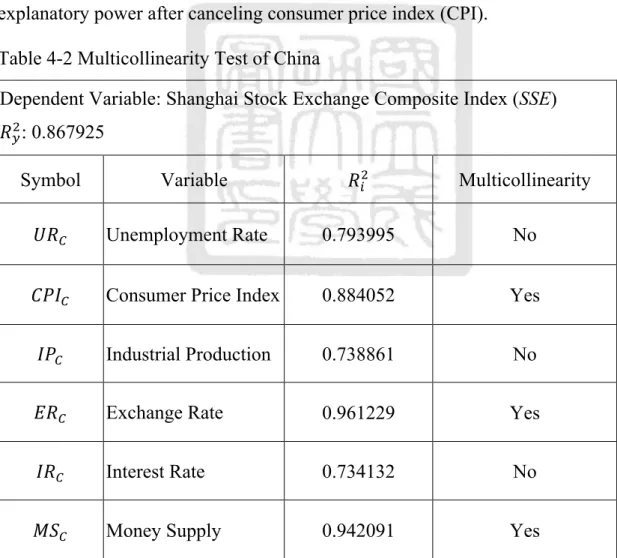
(40) . 4.1.2 Multicollinearity Test We recall the Klein’s rule, whereas if R!! of independent variable is larger than !!! of dependent variable, there is multicollinearity. The test results are shown in Table 4-2, indicating the multicollinearity problems in consumer price index (CPI), exchange rate (ER) and money supply (MS). Then, this study takes the significance and multicollinaerity into consideration and eliminates exchange rate (ER) and money supply (MS). The research sustains the consumer price index (CPI) because it could lose substantial amount of explanatory power after canceling consumer price index (CPI). Table 4-2 Multicollinearity Test of China Dependent Variable: Shanghai Stock Exchange Composite Index (SSE) !!! : 0.867925 Symbol. Variable. Multicollinearity. !"!. Unemployment Rate. 0.793995. No. !"#!. Consumer Price Index. 0.884052. Yes. !"!. Industrial Production. 0.738861. No. !"!. Exchange Rate. 0.961229. Yes. !"!. Interest Rate. 0.734132. No. !"!. Money Supply. 0.942091. Yes. Source: This Study. . !!!. 33 .
(41) . 4.1.3 Revised Regression Model of China After eliminating exchange rate (ER) and money supply (MS), this study uses the remaining five independent variables to establish the revised model, followed by conducting the heteroskedasticity and autocorrelation test to produce the final model. Table 4-3 Revised Regression Model of China Dependent Variable:. Number of Observation: 39. Shanghai Stock Exchange Composite Index (SSE). Frequency: monthly. Regression Model: !!"! = ! + !! !"! Symbol ! !"!. !. + !! !"#!. Variable Constant term Unemployment Rate. !. + !! !"!. Coefficient. !. + !! !"!. Std. Error. !. + !! (!! )! + !!. t-statistics Probability. 22798.54. 9957.678. 2.289544. -3725.073. 2482.238. -1.500691 0.1429. 88.12349. 5.488900. 0.0000***. 0.0783*. !"#! Consumer Price Index 483.7010. !"!. Industrial Production 63.53341. 34.96430. 1.817094. !"!. Interest Rate. -2131.158. 413.8172. -5.150000 0.0000***. -358.8713. 374.6051. -0.957999 0.3450. !!. =1, 2008/5~2008/11 =0, otherwise. R-square. 0.839321. Adjusted R-square. 0.814975. F-statistics. 34.47559. Durbin-Watson Statistics. 0.945485. Note: Significant level 10%, 5% and 1% are marked by *, **and*** Source: This Study. . 0.0286**. 34 .
(42) . 4.1.4 Heteroskedasticity Test This research use White Heteroskedasticity Test with Eview 5.0 to diagnose whether if there is heteroskedasticity problem associated with the revised regression model. This study assumes a null hypothesis without heteroskedasticity in the 5% significant level and the result is displayed in Table 4-4. The null hypothesis is therefore not rejected due to the likelihood of larger than 5%. That is, there is no heteroskedasticity problem in this revised model. Table 4-4 Heteroskedasticity Test for Revised Regression Model of China White Heteroskedasticity Test F-statistics. 3.107224. Probability. 0.111700. Obs*R-square 36.35782. Probability. 0.233179. Source: This Study 4.1.5 Autocorrelation Test This study uses the Durbin-Watson Test to diagnose autocorrelation problem in the revised regression model. Note the criterion of without autocorrelation is !! < ! < 4 − !! . In this case, !! = 1.218 and 4 − !! = 2.782. Table 4-5 shows that the D-W statistics in the revised regression model is 0.945485 and there is autocorrelation in this model. To solve this problem, this study adds a correction term, AR(1). After adding AR(1), the D-W statistics is 1.989166 and within the interval. Therefore, there is no long autocorrelation. Table 4-5 Autocorrelation Test for Revised Regression Model of China Criterion: 1.218 < ! < 2.782 Durbin-Watson Statistics. Autocorrelation. Revised Regression Model. 0.945485. Yes. Add AR(1). 1.989166. No. Source: This Study. . 35 .
(43) . 4.1.6 Final Regression Model of China Table 4-6 Final Regression Model of China Dependent Variable:. Number of Observation: 38 (adjusted). Shanghai Stock Exchange Composite Index (SSE) Regression Model: !!"! = ! + !! !"! +!! !"! Symbol ! !"!. !"#!. !"! !"!. Variable Constant term. !. !. + !! !"#!. Frequency: monthly !. + !! !"!. !. + !! (!! )! + !! !"(1) + !!. Coefficient. Std. Error. t-statistics. Probability. 7416.442. 6993.163. 1.060528. 0.2971. -705.0147. 1710.370. -0.412200. 0.6830. 181.0842. 90.01192. 2.011780. 0.0530*. 55.47580. 31.40433. 1.766502. 0.0872*. -794.6149. 323.6378. -2.455260. 0.0199**. 2008/5~2008/11 -80.80179. 289.8978. -0.278725. 0.7823. 0.079783. 11.16811. 0.0000***. Unemployment Rate Consumer Price Index Industrial Production Interest Rate =1,. !!. =0, otherwise AR(1). Correction Term 0.891030. R-square. 0.928117. Adjusted R-square. 0.914204. F-statistics. 66.70890. Durbin-Watson Statistics. 1.989166. Note: Significant level 10%, 5% and 1% are marked by *, **and*** Source: This Study. . 36 .
(44) . After the modification process, this study eliminated the independent variables, exchange rate (ER) and money supply (MS). This research also conducted heteroskedasticity test and autocorrelation test with addition of a correction term, AR(1). The final regression model is shown in Table 4-6. It shows that R-square is 0.928117 and adjusted R-square is 0.914204, which means 93% and 91% explanatory power of this final regression model to the stock market of China. Then, this study will analyze the impacts of the independent variables of this model. This study determines whether one variable significant or not through the t test. The analyses are shown in the follow: 1.. Unemployment Rate: The coefficient of unemployment rate is -705.0147 and it is negatively related to SSE index. The coefficient meets our prior expectation, however the probability is 0.683 and is not significant.. 2.. Consumer Price Index: The coefficient of consumer price index is 181.0842 and it is positively related to SSE index. The coefficient meets our prior expectation. Furthermore, the probability of consumer price index is 0.053 and under the 10% significance level.. 3.. Industrial Production: Table 4-6 shows the coefficient of industrial production is 55.4758. There is a positive relationship between industrial production and SSE index. The coefficient meets our prior expectation. Besides, the probability is. . 37 .
(45) . 0.0872 and under the 10% significance. 4.. Interest Rate: Table 4-6 shows that the coefficient of interest rate is -794.6149. There is a negative relationship between interest rate and SSE index, which meets our prior expectation. The probability is 0.0119 and under the 5% significance.. 5.. The Olympics: In previous discussion, this study supposes that the Olympics is negatively related to stock market. Table 4-6 shows the coefficient is -80.80179 and it is the same as our discussion. However, the probability is 0.7823 and it cannot reject the null hypothesis of the coefficient is zero. Hence, the Beijing Olympics 2008 is insignificant to SSE index when the dummy variable D! is setting at !! = 1 from 2008/5 to 2008/11.. . 38 .
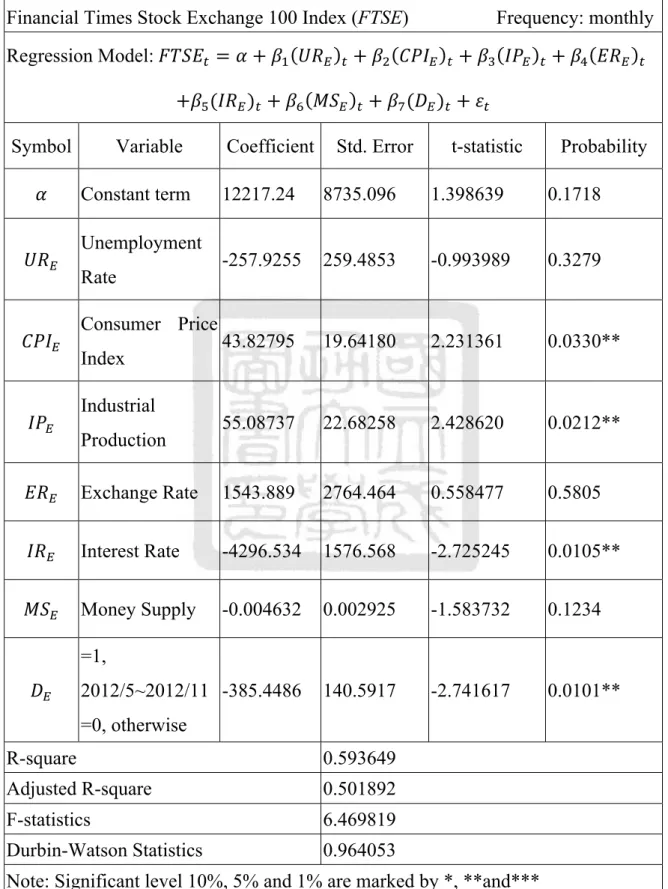
(46) . 4.2 Empirical Results and Analyses of the United Kingdom After the results and analyses of China, this study will carry out the regression model and analyses of the United Kingdom. It applies the same modification process as those of China. 4.2.1 Primitive Regression Model of the United Kingdom In Table 4-7, the primitive regression model of the United Kingdom is displayed. It shows that consumer price index (CPI), industrial production (IP), interest rate (IR) and the Olympics are under the 5% significance level. Similarly, this primitive regression model does not fit the requirement of BLUE. This study will conduct some modification to revise the model.. . 39 .
(47) . Table 4-7 Primitive Regression Model of the United Kingdom Dependent Variable:. Number of Observation: 39. Financial Times Stock Exchange 100 Index (FTSE) Regression Model: !"#$! = ! + !! !"!. !. +!! (!"! )! + !! !"! Symbol ! !"!. !"#!. !"!. Variable Constant term Unemployment Rate Consumer Price Index Industrial Production. Coefficient. Frequency: monthly. + !! !"#! !. !. + !! !"!. !. + !! !"!. + !! (!! )! + !!. Std. Error. t-statistic. Probability. 12217.24. 8735.096. 1.398639. 0.1718. -257.9255. 259.4853. -0.993989. 0.3279. 43.82795. 19.64180. 2.231361. 0.0330**. 55.08737. 22.68258. 2.428620. 0.0212**. !"!. Exchange Rate. 1543.889. 2764.464. 0.558477. 0.5805. !"!. Interest Rate. -4296.534. 1576.568. -2.725245. 0.0105**. !"!. Money Supply. -0.004632. 0.002925. -1.583732. 0.1234. 2012/5~2012/11 -385.4486. 140.5917. -2.741617. 0.0101**. =1, !!. =0, otherwise R-square. 0.593649. Adjusted R-square. 0.501892. F-statistics. 6.469819. Durbin-Watson Statistics. 0.964053. Note: Significant level 10%, 5% and 1% are marked by *, **and*** Source: This Study. . 40 . !.
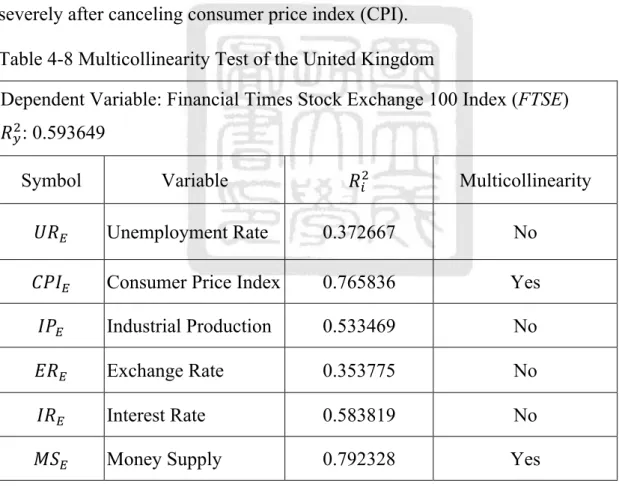
(48) . 4.2.2 Multicollinearity Test Klein’s rule told us, there will be a multicollinearity problem when R!! of independent variable is larger than R!! of dependent variable. Table 4-8 shows the results of the test. Obviously, consumer price index (CPI) and money supply (MS) are related to muticollinearity problems. This study takes significance and multicollinearity into consideration and decides to delete exchange rate (ER) and money supply (MS). The reason for keeping consumer price index (CPI) is that the explanatory power may drop severely after canceling consumer price index (CPI). Table 4-8 Multicollinearity Test of the United Kingdom Dependent Variable: Financial Times Stock Exchange 100 Index (FTSE) !!! : 0.593649 Symbol. Variable. Multicollinearity. !"!. Unemployment Rate. 0.372667. No. !"#!. Consumer Price Index. 0.765836. Yes. !"!. Industrial Production. 0.533469. No. !"!. Exchange Rate. 0.353775. No. !"!. Interest Rate. 0.583819. No. !"!. Money Supply. 0.792328. Yes. Source: This Study. . !!!. 41 .
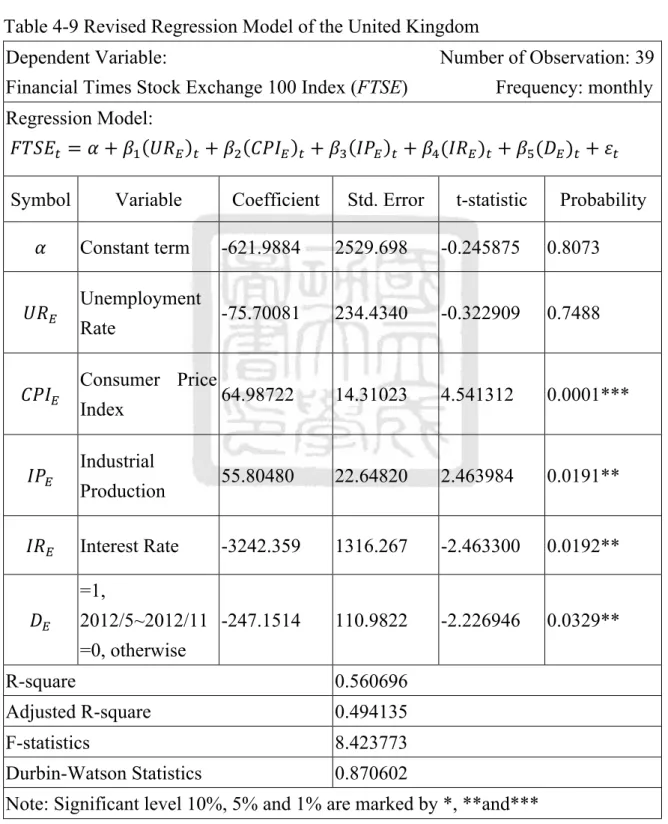
(49) . 4.2.3 Revised Regression Model of the United Kingdom After eliminating exchange rate (ER) and money supply (MS), this study uses the remaining five independent variables to establish the revised model. This study will conduct heteroskedasticity and autocorrelation test to produce the final model. Table 4-9 Revised Regression Model of the United Kingdom Dependent Variable:. Number of Observation: 39. Financial Times Stock Exchange 100 Index (FTSE). Frequency: monthly. Regression Model: !"#$! = ! + !! !"! Symbol ! !"!. !"#!. !"! !"!. !. + !! !"#!. Variable Constant term. !. + !! !"!. Coefficient. !. + !! (!"! )! + !! (!! )! + !!. Std. Error. t-statistic. Probability. -621.9884. 2529.698. -0.245875. 0.8073. -75.70081. 234.4340. -0.322909. 0.7488. 64.98722. 14.31023. 4.541312. 0.0001***. 55.80480. 22.64820. 2.463984. 0.0191**. -3242.359. 1316.267. -2.463300. 0.0192**. 2012/5~2012/11 -247.1514. 110.9822. -2.226946. 0.0329**. Unemployment Rate Consumer Price Index Industrial Production Interest Rate =1,. !!. =0, otherwise R-square. 0.560696. Adjusted R-square. 0.494135. F-statistics. 8.423773. Durbin-Watson Statistics. 0.870602. Note: Significant level 10%, 5% and 1% are marked by *, **and*** Source: This Study. . 42 .
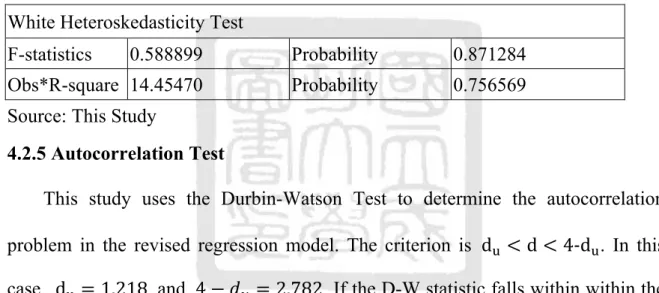
(50) . 4.2.4 Heteroskedasticity Test We recall the White Heteroskedasticity Test and the study assume the null hypothesis with no heteroskedasticity in the 5% significance level. Table 4-10 showed the result of this test. Due to the probability is larger than 0.05, the null hypothesis could not be rejected. Thus, there is no heteroskedasticity problem in this revised model. Table 4-10 Heteroskedasticity Test for Revised Regression Model of the United Kingdom White Heteroskedasticity Test F-statistics. 0.588899. Probability. 0.871284. Obs*R-square 14.45470. Probability. 0.756569. Source: This Study 4.2.5 Autocorrelation Test This study uses the Durbin-Watson Test to determine the autocorrelation problem in the revised regression model. The criterion is d! < d < 4-‐d! . In this case, d! = 1.218 and 4 − !! = 2.782. If the D-W statistic falls within within the interval, there is no autocorrelation. The D-W statistics in the revised regression model is 0.870602 with autocorrelation. To solve this problem, this research adds a correction term, AR(1). After adding AR(1), the D-W statistics is 1.929240 and within the interval and this model is without autocorrelation. Table 4-11 Autocorrelation Test for Revised Regression Model of United Kingdom Criterion: 1.218 < ! < 2.782 Durbin-Watson Statistics. Autocorrelation. Revised Regression Model. 0.870602. Yes. Add AR(1). 1.929240. No. Source: This Study. . 43 .
(51) . 4.2.6 Final Regression Model of the United Kingdom Table 4-12 Final Regression Model of the United Kingdom Dependent Variable:. Number of Observation: 38 (adjusted). Financial Times Stock Exchange 100 Index (FTSE) Regression Model: !"#$! = ! + !! !"!. !. + !! !"#!. Frequency: monthly !. + !! !"!. !. +!! (!"! )! + !! (!! )! + !! !"(1) + !! Symbol ! !"!. !"#!. !"! !"!. Variable Constant term. Coefficient. Std. Error. t-statistic. Probability. -1284.150. 5743.734. -0.223574. 0.8246. 431.3393. 327.5173. 1.316997. 0.1975. 37.55926. 39.75640. 0.944735. 0.3521. 6.537515. 29.13410. 0.224394. 0.8239. -3622.076. 1746.310. -2.074131. 0.0465**. 2012/5~2012/11 -259.7046. 142.1069. -1.827531. 0.0773*. 0.154182. 4.928655. 0.0000***. Unemployment Rate Consumer Price Index Industrial Production Interest Rate =1,. !!. =0, otherwise AR(1) Correction Term 0.759908 R-square. 0.712362. Adjusted R-square. 0.656690. F-statistics. 12.79574. Durbin-Watson Statistics. 1.929240. Note: Significant level 10%, 5% and 1% are marked by *, **and*** Source: This Study. . 44 .
(52) . After these tests and modifications, this study deletes the independent variables, exchange rate (ER) and money supply (MS). The study conducts heteroskedasticity test and autocorrelation test and adds a correction term, AR(1). Table 4-12 shows the final regression model. In this model, R-square is 0.712362 and adjusted R-square is 0.65669, which means 71% and 66% explanatory ability of this final regression model to stock market of United Kingdom. Then, this research will analyze the impacts of the independent variables of this model. This study applies t test to determine whether these variables are significant. The following are the analyses. 1.. Unemployment Rate: The probability is 0.1975. That is, the unemployment rate is insignificant to FTSE index. But surprisingly, the coefficient of unemployment rate is 431.3393, which is contrary to our prior expectation.. 2.. Consumer Price Index: The P-value is 0.3521 and insignificant to FTSE index. But the sign meets our expectation.. 3.. Industrial Production: The probability is 0.8239. The value does not reject the null hypothesis of t test, so the industrial production is insignificant to FTSE index. Moreover, the expected sign meets as our expectation.. . 45 .
(53) . 4.. Interest Rate: The P-value is 0.0465 and under the 5% significance level. And the coefficient is -3622.076. Therefore, there is a negative relationship between interest rate and FTSE index. Furthermore, the sign meets our prior expectation.. 5.. The Olympics: The P-vale is 0.0773 and under 10% significance level. The coefficient is -259.7046. Note that this study assumed the Olympics to come with some economic disadvantages which will be reflected on the stock market. The evidence shows that there is a negative relationship between the Olympics and stock market of United Kingdom when D! = 1 from 2012/5 to 2012/11. The results support our earlier assumption.. . 46 .
(54) . Chapter 5 Conclusion and Suggestion Based on the empirical results in Chapter 4, the study infers and concludes the impacts of the Olympics and macroeconomic variables on the stock markets in hosting countries. The Chapter comprises four sections, whereas Section 1 explains the effects of macroeconomic variables on the stock markets in Olympics hosting countries, Section 2 discusses the impacts of Beijing and London Olympics on the stock markets of China and the United Kingdom, Section 3 explains the limitation of this study, and finally Section 4 proposes some suggestions to governments and future researchers as reference.. 5.1 The Impacts of Macroeconomic Variables on Stock Markets (1) Unemployment Rate We recall the literatures discussed in Chapter 2, the unemployment rate is significantly related to stock market (Birz et al., 2011; Bestelmeyer et al., 2010) but insignificant in relation to the stock markets of China and the United Kingdom in this study. Furthermore, the coefficient of unemployment rate of final model of United Kingdom is negative and does not support our assumption. This research infers the possible reason being that some firms lay off improper workers in attempt to increase future profits. (2) Consumer Price Index Bekaert and Engstrom (2010) discovered the significantly positive relationship between CPI and stock market. The results of China in Chapter 4 also supported. . 47 .
(55) . this relationship. However, there is no significant relationship between CPI and stock market in the United Kingdom. This study inferred that there is difference between developing country and developed country. The economic growth of China from 2006 to 2009 was impressively high and caused the bloom of the stock market. At the meantime, the inflation is more dynamic during that time period, resulting in a positive relationship between stock market and CPI in China. On the other hand, the economic growth of United Kingdom was stable while CPI was regulated during these years. The stock market will fluctuate by information available although the CPI has remained stable. Thus, the CPI is not significantly related to stock market in United Kingdom. (3) Industrial Production Based on the literature of Srinivasan (2012), this study anticipates for positive effect of industrial production in stock market. The results of China supported our expectation, but the results of the United Kingdom did not. The industrial production has more impacts on China than on the U.K. Therefore, this study infers that industrial sector plays a more important role in China than in the U.K. (4) Exchange Rate Beer and Hebein (2008) discovered that the depreciation of domestic currency would cause the stock market index to increase. This study found out that CPI, exchange rate and money supply are highly correlated and there exist multicollinearity problems. Furthermore, exchange rate is not significant in the preliminary models of China and U.K. Thus, this study eliminated exchange rate. . 48 .
(56) . and money supply, and kept CPI in our models. (5) Interest Rate The empirical results showed that interest rate has significantly negative relationship with the stock market while the results meet our expectation and studies conducted by Alam and Uddin (2009). Higher interest rate tends to decrease the investment of firms and urge investors to transfer their assets from stocks to bonds. Thus, the relationship between interest rate and the stock market is negative. (6) Money Supply Previous literature mentioned that there is positive relationship between money supply and the stock markets (Humpea et al., 2009; Chatziantoniou et al., 2013). The results showed that there is no significant relationship. Furthermore, the study deleted money supply in regression model due to multicollinearity.. . 49 .
(57) . 5.2 The Effects of the Olympics on Stock Markets The empirical results showed that there are no significant differences between the Beijing Olympics 2008 period (from 2008/5 to 2008/11) and other without the Beijing Olympics 2008 period (from 2006/1 to 2008/4 and from 2008/12 to 2009/3). That is, the Beijing Olympics was not significantly related to stock market of China when !! = 1 between 2008/5 and 2008/11. On the other hand, the empirical results showed that there are 10% significant differences between the London Olympics 2012 period (from 2012/5 to 2012/11) and other non-London Olympics 2012 period (from 2010/1 to 2012/4 to 2012/12 to 2013/3). Namely, the London Olympics was negatively related to stock market of U.K., and under the 10% significance when D! = 1 between 2012/5 and 2012/11. In Chapter 3, the study assumes the hosting of Olympics to be harmful to the economy. The coefficients of the Olympics in final models are negative, and the evidences supported our expectation. Several possible reasons are provided below: First, the cost of hosting mega events has increased over the years, whereas governments are required to spend a large amount of money on event planning, employment, constructing new buildings, and renewing infrastructure. These measures could benefit specific firms, however from the perspective of entities, the price to pay outweighs the substantial amount of budget. In the short run, governments will face fiscal deficits and reduce other public expenditure. Therefore, investors will expect Olympics to benefit only specific firms but may jeopardize the overall economy, in addition to holding pessimism again the stock market in the. . 50 .
(58) . short run. Secondly, some investment on mega event requires possibly a long period of time to realize the benefits. For example, renewing infrastructure or planning additional mass transit systems is considered good investment to city development. The host city will attract more residents and firms in the future. However, the drawback is the time lag because investment and housing decisions are very important to firms and residents. They have to consider many perspectives and spend substantial amount of time to decide. The study sets up the dummies only in 3 months before and after the Olympics. During this time interval, many benefits may not be reflected just yet. Finally, the stock markets are constituted by firms in one nation; nonetheless, the Olympics is only held in one city. Firms located outside of the hosting city will not attain the benefits, and therefore the Olympics will not benefit the stock market. However, the evidence showed that the Beijing Olympics was insignificant and the London Olympics was significant. There are some differences between China and the U.K., and so the study infers two possible reasons. The first one is that it is because of the difference between developed country and developing country. China is a developing country and the economic growth is very robust. The effects of Olympics will be mixed with other macroeconomic variables. The final regression of China displayed that stock market of China was almost affected by CPI, industrial production and interest rate. For this reason, the effects of mega event are limited. On the other hand, the United Kingdom is. . 51 .
(59) . developed country while the economic growth and other macroeconomic variables are more stable. Mega events hosting will result in stronger influence on the stock market. And another reason is the difference of the government expenditures of these two Olympics. The information of the differences of expenditure of China of the United Kingdom is very chaos. But the most conservative information is that the expenditure of the London Olympics 2012 is less than 50% of the expenditure of the Beijing Olympics 2008. Obviously, it is a significant difference. In this case, the positive benefits accompanied by the London Olympics 2012 will be less than the benefits of the Beijing Olympics 2008. This study inferred that the Beijing Olympics 2008 attracted lots of foreign tourists and investments and stimulated lots of consumption and leveled up the national image of China. Furthermore, almost people of China thought that the host of Olympics is vey honor and they felt pride of their motherland. Therefore, the results showed there are no significantly negative relationship between the Beijing Olympics 2008 and the stock market of China. In other hand, the London Olympics 2012 was seen as “Green Olympics”. The U.K. government did not spend lots of money to host the event. So, the real economic benefit will be less than the Beijing Olympics. Moreover, London is a city that hosted the Olympics three times (1908, 1948, 2012). The people of the U.K. may feel honor and pride, but the degree may less than the people of China. Hence, the empirical evidences showed that the Olympics have negative effects on stock market of hosting countries over the short run.. . 52 .
數據
+6
相關文件
飛馬座的這匹會飛的白馬名叫「皮葛色斯 ( Pegasus )」,在希臘神話中有不少的 傳說。相傳希臘神話的大英雄「伯修斯 ( Perseus )」(
• Adds variables to the model and subtracts variables from the model, on the basis of the F statistic. •
法國「坎城競標」拍賣公司於 27 日表示,現代奧運之父古柏坦設計的奧運 5 環標 誌手繪原稿,在拍賣會上以 18 萬 5000 歐元(約新台幣
東京將於明年 2020 年舉辦東京奧運,根據日本新聞報導,奧運主場館「國立競技 場」已在 11 月 30
加強教師在 奧福音樂教 學上的掌握 及運用樂器 的技巧.
This study aimed to establish the strength models of High-Performance Concrete (HPC) using Nonlinear Regression Analysis (NLRA), Back-Propagation Networks (BPN) and
This research uses 28 ITHs as the DMUs of DEA to assessment relative operating efficiency of model 1 (input variables are full time employees, cost of labor,
Through the enforcement of information security management, policies, and regulations, this study uses RBAC (Role-Based Access Control) as the model to focus on different
