行政院國家科學委員會專題研究計畫 成果報告
全口植牙膺復治療的力學分析 研究成果報告(精簡版)
計 畫 類 別 : 個別型
計 畫 編 號 : NSC 97-2221-E-011-137-
執 行 期 間 : 97 年 08 月 01 日至 98 年 07 月 31 日 執 行 單 位 : 國立臺灣科技大學機械工程系
計 畫 主 持 人 : 曾垂拱 共 同 主 持 人 : 石淦生
計畫參與人員: 碩士班研究生-兼任助理人員:余柏翰 碩士班研究生-兼任助理人員:莊緯民 博士班研究生-兼任助理人員:廖清勳
處 理 方 式 : 本計畫可公開查詢
中 華 民 國 98 年 08 月 20 日
附件一
行政院國家科學委員會補助專題研究計畫
V
成 果 報 告□期中進度報告 (全口植牙膺復治療的力學分析)
計畫類別:v 個別型計畫 □ 整合型計畫 計畫編號:NSC 97-2221-E -011-137-
執行期間: 97 年 8 月 1 日至 98 年 7 月 31 日
計畫主持人:曾垂拱 共同主持人:石淦生
計畫參與人員:廖清勳 余柏翰 莊緯民
成果報告類型(依經費核定清單規定繳交):V 精簡報告 □完整報告
本成果報告包括以下應繳交之附件:
□赴國外出差或研習心得報告一份
□赴大陸地區出差或研習心得報告一份
□出席國際學術會議心得報告及發表之論文各一份
□國際合作研究計畫國外研究報告書一份
處理方式:除產學合作研究計畫、提升產業技術及人才培育研究計畫、列管計畫及 下列情形者外,得立即公開查詢
□涉及專利或其他智慧財產權,□一年□二年後可公開查詢
執行單位:台灣科技大學
中 華 民 國 98 年 8 月 21 日
1
Mechanics Comparison of Various Designs of Implant-supported Mandibular Restoration
Chwei-Goong TSENG *, and Kan-Shan SHIH **
* Department of Mechanical Engineering, National Taiwan University of Science and Technology No. 43, Section 4, Keelung Road, Taipei 106, Taiwan, ROC
** Department of Dentistry, School of Dentistry, National Defense Medical Center No. 161, Section 6, Min-Chuan East Road, Taipei 114, Taiwan, ROC
Abstract
The purpose of this study was to compare the effects of various designs of implants’ placement on stress distribution in bone around the implants supporting one-unit fixed complete dentures. A computer tomography image was redrawn to reconstruct a digital
three-dimensional solid model of a mandible including the cortical bone and cancellous bone. Moreover, the reverse engineering method and computer-aided design were employed to construct a digital three-dimensional solid model of fixed complete dentures as well as implant and abutment. All of the digital three-dimensional solid models were combined and transformed to the FE models, and they were classified into 7 configurations according to the number and location of the implants. The MSC/Patran software was used to develop the FE mesh comprising of 1101954 elements with 252693 nodes. The MSC/Nastran software was utilized as pre and
post-processor for all mathematical calculations necessary to evaluate dental and mandibular biomechanics. One set of multiple vertical loads was used to simulate the possibility of occlusion status. And the von Mises stress values in the cortical bone, cancellous bone and implants were evaluated. The simulated results indicated that the stress distributions for FE models were largely affected by the number and location of implants. In the bone, similar to the
single-tooth case, the von Mises stresses were all concentrated toward the cortical bone around the collar of the implants for FE models. By increasing the thickness of each connector of complete dentures, the stress distribution for cortical bone around implants could be
decreased.
Key words: Implant-supported, Reverse Engineering, Computer-aided Design, Finite Element Analysis, Computer Tomography, Fixed Complete Dentures, Von Mises Stress, Cortical Bone, Cancellous Bone, Mandibular Restoration
1. Introduction
Since osseo-integrated implants were introduced for the rehabilitation of the complete and partial
3
edentulous patients with either fixed or removable dentures in the late 1960s(1)(2), a tremendous awareness and subsequent demand have arisen in the field. Currently, implants are frequently used for the treatment of
partially edentulous mandibular or maxillary bone(3)(4). However, clinical observations often do not support the well-known theoretical approaches, particular the number of implants supports and the simplification of dental structure used for fixed partial dentures. Because the geometry shape of dental structure is relatively complex and unstable, the simulating solid models must be constructed by the suitable methods. In recent years, the reverse engineering (RE) method has been seen as a necessary yet time-consuming engineering process, invariably requiring highly skilled resources(5). In this study, RE and computer-aided design (CAD) methods were used to construct fourteen teeth, an implant and an abutment models respectively. In clinical surgery, the computer tomography (CT) is usually used to generate a three-dimensional image of the internals of an object from a large series of two-dimensional X-ray images taken around a single axis of rotation. In the field of dentistry, the CT images were often used to reconstruct the dental structures including cortical bone, cancellous bone and prostheses(6)-(9).
The three-dimensional (3-D) finite element (FE) analysis method has been widely used for the quantitative evaluation of stress distribution on the implant and its surrounding bone(10)-(13). A remarkable advantage of FE method is the chance to study areas that are difficult or impossible to access without any risks to a human sample(14)(15). The use of FE method allows studying a single tooth, a set of teeth, or even the relationship between maxillary and mandibular dental arches on a more solid and precise biomechanical basis than other methods. With this methodology, it is possible to have quantitative and qualitative representations of dental and mandibular biomechanics to evaluate tensions, deformations and displacements that may occur in these structures.
There is a consensus that, the location and magnitude of occlusal loads affect the quality and quantity of induced strains and stresses in all components of the bone-implant-prosthesis complex(16)(17). An
implant-supported prosthesis may be under the influence of external and/or internal loads. The qualification and quantification of these loads on implants and in bone are required to understand.
FE analysis method was used in this study to examine the biomechanical effects under occlusal load on the stress distribution for an implant-supported fixed complete dentures and supporting bone tissue. The purpose of this study was to compare and determine the optimal designs of implants’ placement, including the placements of four-implant, six-implant, eight-implant, and fourteen-implant systems with one set of multiple vertical occlusal loads on the full area of mandibular edentulous restoration.
2. Methods and Materials
2.1 Simplification of Dental structures
The dental structures for use in this study were divided into six components, including the complete dentures and connectors, which were made of ceramic; abutment and implant, which were made of titanium;
cancellous bone and cortical bone, whose material properties were derived from the literatures. All of the components were basically considered as linear and isotropic materials. Such procedures do not diminish the precision of the analytic data generated by these models(18).
2.2 Construction of the 3-D FE Models
The models’ size in this study was constructed in accordance with the natural oral tissues models,
including 14 pieces of teeth(19), an implant, an abutment, and mandible. The detailed constructive procedures of each model were described as follow:
The RE (ATOS SO system; GOM, Germany) and CAD (Rhinoceros 5.1.1-10 & Pro/Engineering 2000i;
Parametric Technology Corporation, USA) system were used to scan and construct the digital 3-D solid models of teeth on the mandible except for the third molars. The physical tooth model (borrowed from the dental clinic) whose surface was covered with white paint was fastened on the scanning platform for 3-D scanning to obtain the point data of tooth surface. After scanning procedures, the scanned point data were collected and assigned numbers and sliced serially equidistant (0.5 mm) to acquire the control points and expose tooth sections
parallel to the occlusal surface. After that, the spatial coordinates were transformed to the apex and the blended function of CAD software was performed to generate the surface model of tooth. After closing the top and bottom surfaces of tooth, the digital 3D solid model of tooth was finished. The same constructive procedures were suitable for any tooth. After construction, fourteen pieces of teeth model were cut along the cervical line to acquire the 14 crowns. All of the adjacent crowns were rearranged and modeled as connected together by the MSC/Patran software (MSC. Software Corporation, USA) and called complete dentures.
A 1-piece 3.4×13-mm (No.4 of FRIALIT®-2 SYNCHRO systems) tapered-screw body of fixture implant with a screw-retained abutment was used (with 15.4 mm of combined length, and 13 mm of which were buried into the bone) as the investigated implant system, and RE and CAD (Pro/Engineering 2000i) system were used to construct the digital solid models, respectively.
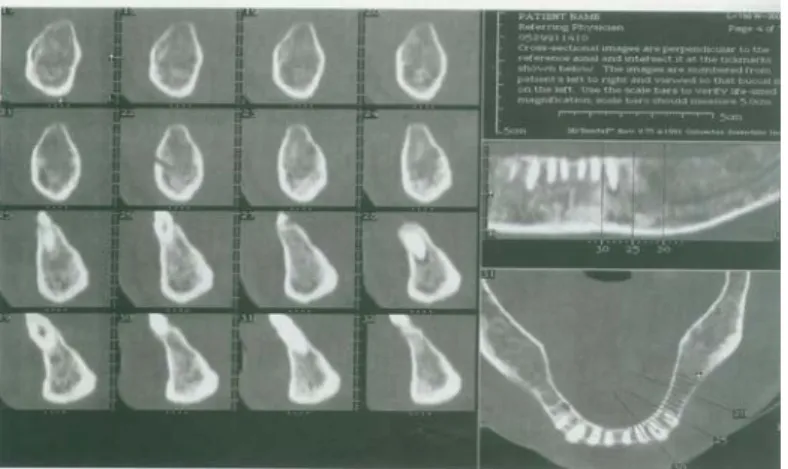
An image processing system (Adobe Photoshop 7.0.1) was used to obtain the frontal and vertical views of cross-sectional images from a patient’s CT images (Fig.1). And the scale bars (within the figure) were used to control and verify lift-sized magnification. A self-developed image-processing program was employed to delineate each cross-sectional image boundary. This program employed various thresholds of CT number and searched for the maximum gradient values of the CT number, which could be used to detect the boundary pixels between different materials. A depth-first search algorithm was then used to find the nearest boundary pixels to renumber the pixels and reconstruct the contour of each material. After stacking these boundary contours, they were then put into MSC/Patran software to generate digital 3D solid models of cortical bone and cancellous bone. The height of the mandible in the Y-direction was in the range of 31.3 mm (anterior regions)
~ 32.1 mm (distal ends); the maximum width in the X-direction was 87 mm; the maximum length in the Z-direction was 65.5 mm and the thickness of cortical bone was in the range of 0.91 ~ 1.79 mm.
Fig. 1 The frontal and vertical views of cross-sectional patterns of a patient’s CT images
The final 3-D graphic models were imported into the MSC/ Patran software using the format of parasolid files. This software adopted the self-adapting criterion to build superficial and internal structure meshes by using tetrahedral elements with three degrees of freedom per node. Before meshing, the convergence validation of element size via the displacement and strain on the top of lingual and labial side of mandible was tested in the study. From the results, when the element size was less than 0.55 mm, the displacement and strain would be converged. A variety of global edge lengths and element topologies were used to mesh the solid models.
Specifically, this study set the element size of the surface of complete dentures model to be 0.15 mm, and 0.25 mm for other regions; the implant model to be 0.15 mm; the abutment to be 0.5 mm; the mandible to be 0.15
mm in the bone around implants, and other regions far away the implants to be 0.5mm, 1mm and 2mm,
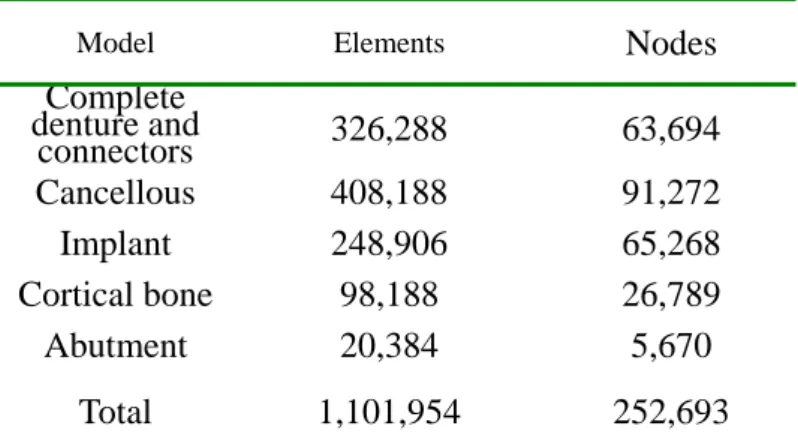
respectively. At the end of this process, all of the FE models presented a mesh comprising of 1101954 elements with 252693 nodes (Table 1), which were precise enough to support the work of analysis(20).
Table 1. Number of elements and nodes of the mesh models for linear tetrahedral element
Nodes
Model Elements
Complete denture and
connectors 326,288 63,694
Cancellous 408,188 91,272
Implant 248,906 65,268 Cortical bone 98,188 26,789
Abutment 20,384 5,670
Total 1,101,954 252,693
After mesh generation, the 3D meshed models were rearranged by the surgical allocation, and then integrated by an overlap process using a Boolean operation, which is a modeling technique mathematically joining two or more digital solid models into a single new object(s) by adding, subtracting or intersecting procedures. After the overlap process, the simulating FE models were finished (Fig. 2).
5
Fig. 2 The simulating FE model. Seven vertical loads of 200 N were applied at crowns of left mandible, and the bottom of mandible was served as fixed end. The distance from occlusal surfaces to the fixed end was about 40 mm
200 200 200 200200 200 200
A-A
2.3 Model Designs
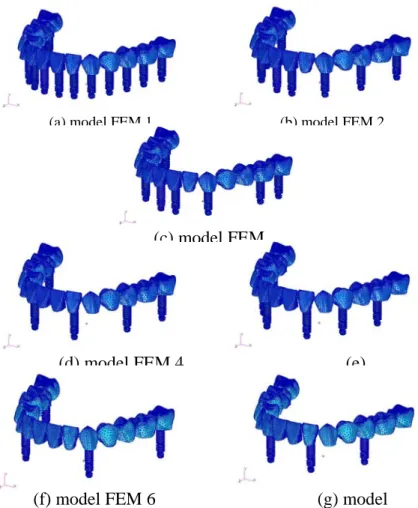
According to various designs of implants’ placement, the simulating FE models were classified into seven configurations (Table 2 and Fig. 3).
Table 2. Analysed configurations of implant supported FCDs
The locations of implant (right-to-left)
7 6 5 4 3 2 1 1 2 3 4 5 6 7 Configuration Model FEM 1
* * * * * * * * * * * * * *
Model FEM 2
* * * * * * * *
Fig.3 Seven configurations of FE models including (a) 14 implant system, (b)/(c) 8 implant systems, (d)/(e) 6 implant systems and (f)/(g) 4 implant systems. (The bones were not shown in the figures)
(a) model FEM 1 (b) model FEM 2
(c) model FEM
(d) model FEM 4 (e)
(f) model FEM 6 (g) model
2.4 Material Properties
Following the FE model constructions, the material properties of the anatomical structures should be decided, and their response to the occlusal simulation was performed with MSC/Nastran software. The material properties of cortical bone, cancellous bone, implant, abutment and complete dentures were all
presumed linear, elastic, homogeneous and isotropic. And the corresponding elastic properties such as Young’s modulus (E) and poisson’s ratio (ν) were determined from the literatures(13)(14)(21)
and listed in Table 3.
Table 3. Elastic properties of each material were assigned to the finite element model
Young's Modulus
(MPa)
Poisson's
Material
Ratio
Titanium
0.35
110,000 (Abutment, Implant)(13)(21)
2.5 Boundary and Loading Conditions
Cortical Bone(13)(21) 13,700 0.3
(13)(21)
1,370
Cancellous Bone 0.3
The boundary conditions were constrained at the inferior surface of the mandibular bone (away from the evaluation area at least 30 mm) in all directions and the interference caused by the boundary constraint did not exist, as shown in Fig.2(22). One set of multiple vertical loads (Y- direction) was performed to simulate the occlusal situation by FE analysis, which was simplified assumption and only simulated the possibility of occlusal loads and used to compare the stress distributions of various designs of implant placement. The magnitude of each load was set to be -200 N where four loads were loaded at buccal cusp of left first incisor, second incisor, canine and first premolar and three loads were loaded at buccal fossa of left second premolar, first molar and second molar. Each load carried out simultaneously. A fixed bond along the whole interface of bone/implants, implants/abutments and abutments/crowns was assumed. The von Mises stress (VMS), which is most commonly reported in FE analysis studies to summaries the overall stress state at a point, was evaluated in this study (11).
2.6 Finite Element Analysis
In 3D FE analysis, the element types in the MSC/Patran and MSC/Nastran software included TET4 and TET10. Although the formulation of the TET4 element makes it necessary to use a much larger number of elements to accurately model areas around stress concentrations, it is often used because of its ability to mesh almost any solid, regardless of complexity. Therefore, this study adopted the TET4 element type and used the h-method, which is a method for thinning the element, to enhance precision and reduce errors.
In this study, the unit of length was mm, the force in Newton, and the stress in MPa.
3. Results
For all models, the maximum VMS (MVMS) values observed in cortical bone were all located at its top surfaces around implants, in the cancellous bone at its bottom around implants, and on the implants at the cervical regions.
3.1 VMS results in cortical bone
In Table 4 and Fig. 4, in all models except model FEM 6 and FEM 7, large stresses were all generated at the positions where implants embedded. And small stresses were generated at the positions where no implant was in it. The VMS values of cortical bone for each position in model FEM 1 were lower and uniform (in the range of 11.7 ~ 25.2 MPa), and MVMS values were generated at left second premolar position (L5). In model FEM 2, the VMS values in the range of 17.3 ~ 48.9 MPa) were very similar to those in model FEM3 (in the range of 15.94 ~ 48.8 MPa), and the MVMS were generated at position L5 (Fig.5). In model FEM 4, the VMS values (in the range of 36.4 ~ 65.8 MPa) were larger than those in model FEM 5 (in the range of 33.2 ~ 53.4 MPa), and the MVMS were generated at position L5. In model FEM 6, the MVMS values (174 MPa) were generated at top surface of position L5 (Fig. 6) where no implant was in it. In model FEM 7, the MVMS values (161 MPa) were generated at top surface of left canine (L3) where no implant was in it.
Fig 4. The main stress distribution values of cortical bone for
0 50 100 150 200
1 2 3 4 5 6 7
Position of left mandible
VMS values (MPa)
FEM 1 FEM 2 FEM 3 FEM 4 FEM 5 FEM 6 FEM 7
Table 4. MVMS values for all FE models (unit: MPa)
7 Load
type Material FEM FEM 2 FEM FEM FEM FEM FEM 7
1 48.9 48.8 3 65.84 53.45 174 6 161 25.2
Cortical (L5) (L5) (L6) (L5) (L6) (L5) (L3)
9.6 9.6 9.3
5.64
(L3) 8.18 17.8 18.8
Cancellous (L3) (L3) (L2) (L5) (L5) (L3)
Fig. 5 The MVMS values (48.9 MPa) in the top of cortical bone around implant (at the buccal side of position L5) for model FEM 2 (for example).
C-C
Fig. 6 The VMS values of cortical bone in model FEM 6 (for example)
The MVMS values on the inferior surface of mandible for seven FE models were also presented in Table 4. Based on the results, all of the values (1.9 ~ 2.3 MPa) for ISM were much smaller than other regions. One of the examples for ISM is given in Fig. 7.
Since the reaction stresses on ISM are negligible, such a simple boundary condition could be used in this study.
Fig. 7 The VMS values of inferior surface of mandible for model FEM 2 (for e ample)
3.2 VMS results in cancellous bone
Whatever in any simulating FE model, the stress distributions of cancellous bone were all much lower than those in cortical bone as shown in Table 4, and the MVMS values of cortical bone were about 4.47 ~ 9.78 times to cancellous bone’s.
3.3 VMS results on implants
The VMS values of implants for all FE models were all generated on the cervical regions of implants (Fig. 8). The MVMS values were generated in the model FEM 5 (at position L6 about 320 MPa), which were about 1.33 ~ 3.4 times to other models.
Fig. 8 The VMS values of implants for model FEM 2 (for example). The MVMS values (173 MPa) were generated at position L5.
D-D
3.4 Maximum deformation of complete dentures
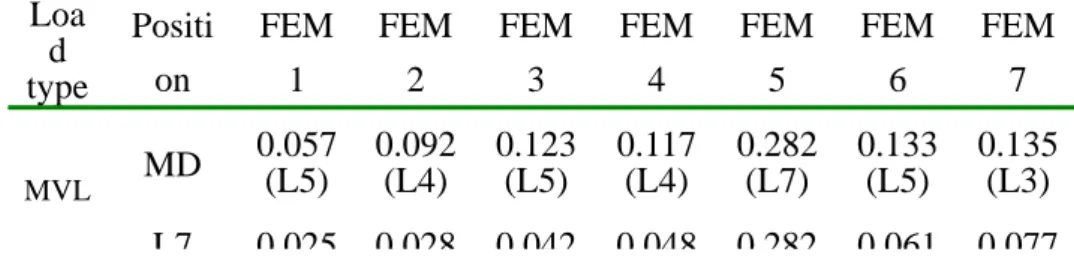
The maximum deformation (MD) and location on the complete dentures for all FE models were listed in Table 5. In Table 5, for example, the MD and location for model FEM 1 were generated at position L5, which were 0.057 mm. The maximum MD values was generated in the model FEM 5 (at position L5 about 0.282 mm), and they were about 2.08 ~ 4.95 times to others models.
Table 5. The maximum MD of complete denture for FE models
9
Loa d type
Positi on
FEM 1
FEM 2
FEM 3
FEM 4
FEM 5
FEM 6
FEM 7 0.057 0.092 0.123 0.117 0.282 0.133 0.135 MD (L5) (L4) (L5) (L4) (L7) (L5) (L3)
MVL
L7 0 025 0 028 0 042 0 048 0 282 0 061 0 077
3.5 The effects of various thicknesses of connectors on complete dentures
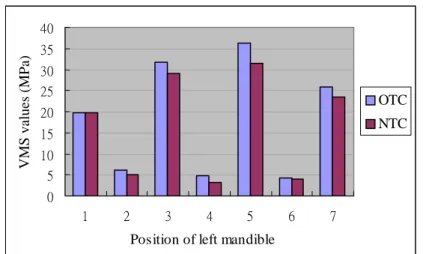
When the thickness of each connector among crowns of the Model FEM 2 (for example) was all increased about 1 mm in the Y-direction, the increased amount of each connector’s volumes was listed in Table 6. After loading, the VMS values of cortical bone around the implants were all decreased as shown in Fig. 9. The decrease rate of VMS values for the positions (except the incisors) where implants were embedded were 6 ~ 14.5 per cent.
Table 6. The increased amount of each connector’s volume for Model FEM 2
L1_L2 L2_L3 L3_L4 L4_L5 L5_L6 L6_L7
OTC 2.73 1.42 3.75 6.68 5.61 3.96
NTC 3.07 2.91 4.92 13.23 10.84 10.3
IAV 0.34 1.49 1.17 6.55 5.23 6.34 OTC: original thickness of connectors; NTC: new thickness of
connectors;
Fig. 9 Comparing the stress distributions (VMS) of cortical bone at each position between OTC and NTC for model FEM
0 5 10 15 20 25 30 35 40
1 2 3 4 5 6 7
Position of left mandible
VMS values (MPa)
OTC NTC
4. Discussions
In the present study, a precise 3-D model for mandibular bone and complete dentures were formed. A precise geometry reconstruction was essential for estimating the effects in the bone around implants, especially considering the magnitude of the defects assumed. Investigations and reports on 3-D complete mandibular bone model are few. It had been reported that more successful conclusions could be reached with FE analysis with ideal modeling of the anatomic structure(5,23).
Based on the results, in the eight-implant systems, the stress distributions of cortical bone for model FEM 2 and FEM 3 at each position were all less than 50 MPa (about 2 times to those in model FEM 1). Such VMS values might be acceptable in the normal occlusal situations.
In the six-implant systems, due to no implant in the second molar (L7) position, the MD of model FEM 5 was much larger (bending moment effects) than those in model FEM 4 and about 2.4 times (Table 5). So, if performing the surgery of implant-supported treatment, one of implants was recommended to embed in the position of distal end of mandible.
In the four-implant systems, the MVMS values of cortical bone for model FEM 6 and FEM 7 were all generated at the position where no implant was in it. When loading at such positions, the loads were transmitted from crowns’ bottom to the top surface of cortical bone directly, which shared the loads and generated higher stresses. In model FEM 6, in the position L5, σ1 (the maximum principal stress) = 67.2 MPa, and σ3 (the minimum principal stress) = –156 MPa. Such values were near the ultimate strength of cortical bone (ultimate tensile strength,σt = 100MPa; ultimate compressive strength,σ = 173MPa)c (11), and hence the occlusal loads should be limited.
In Table 4, the VMS values generated on the implants were about 2.25 ~ 3.21 times to cortical bone’s and 13.6 ~ 19.6 times to cancellous bone’s. In general, when loads were applied and transmitted from the implants to bones, the stresses would be shared by the implants, cortical bone and cancellous bone in order; nevertheless, Young’s modulus of implant (Table 3) was larger than those of cortical and cancellous bones, which was about 8 and 80 times respectively. So, the implant was not easy to loss. If overload occurred, the main stresses would be shared by the cortical bone, which might generate much higher stresses.
For improving the stress distributions, the increase of the thickness of connectors was tested. In Table 6 and Fig.9, the increased amount of connectors’ volumes at position L4_L5, L5_L6, and L6_L7 was all more than 5 mm3. And the decrease rates of stress distributions of cortical bone at position L5 and L7 were higher (above 13 %) than those at position L1 and L3. Based on the results, it could be predicted that the more the amount of connectors’ thickness increases, the more the stress distributions decrease.
5. Conclusion
The results suggested the following conclusions:
1. Natural anatomic structures were taken into consideration, and the size of elements was 0.15 mm (150μm) in the evaluation area, which allowed more accurate stress prediction and provided more convincing results(22).
2. The elastic limit of bone around implants might be surpassed, thus produce much larger stress distribution. Since the Young’s modulus of cortical bone is higher than cancellous bone, if overload occurred, the cortical bone would generate bone lost first.
3. With more supporting implants, the treatment may be safer (16). Comparisons among the results of all FE models, the stress distributions for FE models were closely related to the number and location of implants. Although the stress distributions of bone
11 for model FEM 1 are the lowest and more uniform than other FE models, the use of 14 implant is clinically unrealistic. In present study, four-, six- or eight-implant systems might be used to instead to perform the masticatory function. Nevertheless, when using the four-implant system, the magnitude of occlusal loads must be limited to protect the cortical bone.
4. By increasing the thickness of each connector of complete dentures, the stress distribution for bone around implants at each position could be decreased.
5. The mechanical responses obtained from all simulations are a first approximation and need to be validated with other experimental method such as stain gauge analysis (SGA) method.
Acknowledgement
The authors thank for the research subsidies provided by the National Science Council NSC-97-2221-E-011-137.
References
1. Branemark, P. I., Zarb, G. A., Albrektsson, T., Tissue-Integrated Prosthetic: Osseointegration in Clinical Dentistry, Chicago:
Quintessence, (1985), pp.175-186.
2. Rieger, M. R., Mayberry, M., Brose, M. O., Finite Element Analysis of Six Endosseous Implants, J. Prosthet. Dent., Vol.63, No.6 (1990), pp.671-676.
3. Huang, H. L., Huang, J. S., Ko, C. C., Hsu, J. T., Chang, C. H., Chen, M. Y. C., Effects of splinted prosthesis supported a wide implant or two implants: a three-dimensional finite element analysis, Clin. Oral Impl. Res., Vol.16, (2005), pp.466-472.
4. Lin, C. L., Chen, J. J., Numerical Investigation of Span Lengths Affecting Mechanical Responses in Anterior Resin-bonded Fixed Partial Denture, Biomed. Eng. Appl. Basis Comm., Vol.17, (2005), pp.121-125.
5. Lin, C. L., Chang, C. H., Cheng, C. S., Wang, C. H., Lee, H. E., Automatic Finite Element Mesh Generation for Maxillary Second Premolar, Comput. Meth. Prog. Bio., Vol.59, (1999), pp.187-195.
6. Mutlu-Sagesen, L., Toroslu, R., Parnas, L., Suca, S., A Three-dimensional Model of the Mandible Using Two-dimensional CT Images, Proc. EMBS 2001 Annual Int. Cong., (2001), pp.2778-2781.
7. Lin, C. L., Lee, H. E., Wang, C. H., Chang, K. H., Integration of CT, CAD System and Finite Element Method to Investigate Interfacial Stresses of Resin-bonded Prosthesis, Comput. Meth. Prog. Bio., Vol. 72, (2003), pp.55-64.
8. Nakatsuchi, H., Tadano, S., Todoh, M., Nakatsuchi, Y., Mori, S., Endo, M., Finite Element Modeling of the Cortical Bone Region Using Clinical CT Images, JSME, Int. J. Biomech. Science Eng., Vol. 1, No. 2 (2006), pp.316-326.
9. Chun, K. J., Yoo, O. S., Won, Y. Y., Lee, J. Y., A Study of Standardization of Korean Mandibular Second Premolar, JSME 2007 Third Asian Pacific Conf. on Biomech., (2007), pp.S220.
10. Papavasiliou, G., Kamposiora, P., Bayne, S. C., Felton, D. A., Three-dimensional finite element analysis of stress-distribution around single tooth implants as a function of bony support, prosthesis type, and loading during function, J. Prosthet. Dent., Vol.76, No.6 (1996), pp.633-640.
11. Iplikcioglu, H., Akca, K., Comparative Evaluation of the Effect of Diameter, Length, and Number of Implants Supporting Three-unit Fixed Partial Prostheses on Stress Distribution in the Bone, J. Dent, Vol. 30, (2002), pp.41-46.
12. Clement, R., Schneider, J., Brambs, H. J., Wunderlich, A., Geiger, M., Sander, F. G., Quasi-automatic 3D finite element model generation for individual single-rooted teeth and periodontal ligament. Comput. Meth. Prog. Bio., Vol.73, (2004), pp.135-144.
13. Eskitascioglu, G., Usumez, A., Sevimay, M., Soykan, E., Unsal, E., The influence of occlusal loading location on stresses transferred to implant-supported prostheses and supporting bone: A three-dimensional finite element study. J. Prosthet. Dent., Vol.91, No.2 (2004), pp.144-150.
14. Stegaroiu, R., Kusakari, H., Nishiyama, S., Miyakawa, O., Influence of prosthesis material on stresses distribution in bone and implant: a 3-dimensional finite element analysis. Int. J. Oral Max. Impl., Vol.13, No.6 (1998), pp.781-790.
15. Tanaka, M., Naito, T., Yokota, M., Kohno, M., Finite Element Analysis of the Possible Mechanism of Cervical Lesion Formation by Occlusal Force, J. Oral Rehabil., Vol. 30, (2003), pp.60-67.
16. Sahin, S., Cehreli, M. C., Yalcin, E., The Influence of Functional Forces on the Biomechanics of Implant-supported Prostheses─
A Review, J. Dent., Vol. 30, (2002), pp.271-282.
17. Palamara, D., Palamara, J. E. A., Tyas, M. J., Messer, H. H., Strain Patterns in Cervical Enamel of Teeth Subjected to Occlusal Loading, Dent. Mater., Vol. 16, (2000), pp.412-419.
18. Gomes De Oliveira, S., Seraidarian, P. I., Landre Jr, J., Oliveira, D. D., Cavalcanti, B. N., Tooth displacement due to occlusal contacts: a Three-dimensional Finite Element Study, J. Oral Rehabil., Vol. 33, (2006), pp.874-880.
19. Ash MM. Wheeler’s Atlas of Tooth Form. 4th ed. Canada: W. B. Saunders Company, (1969), pp.57-66.
計畫成果自評部份,請就研究內容與原計畫相符程度、達成預期目標情況、研究成果之學術或應用價值、
是否適合在學術期刊發表或申請專利、主要發現或其他有關價值等,作一綜合評估。
本計畫中預計要完成的工作都已完成, 與預期目標相符, 已經撰稿投國際期刊.