行政院國家科學委員會專題研究計畫 成果報告
透過腦事件相關電位(ERP)建構熟年世代對商業包裝設計之 情緒類目與購買意圖關係研究
研究成果報告(精簡版)
計 畫 類 別 : 個別型
計 畫 編 號 : NSC 98-2410-H-011-015-
執 行 期 間 : 98 年 08 月 01 日至 99 年 07 月 31 日 執 行 單 位 : 國立臺灣科技大學工商業設計系
計 畫 主 持 人 : 王韋堯 共 同 主 持 人 : 李佳穎
報 告 附 件 : 出席國際會議研究心得報告及發表論文
處 理 方 式 : 本計畫涉及專利或其他智慧財產權,2 年後可公開查詢
中 華 民 國 99 年 10 月 22 日
1
行政院國家科學委員會補助專題研究計畫成果報告
※※※※※※※※※※※※※※※※※※※※※※※※
※ ※
※ ※
※ 透過腦事件相關電位〈ERP〉建構熟年世代 ※
※ 對商業包裝設計之情緒類目與 ※
※ 購買意圖關係研究 ※
※ ※
※ ※
※※※※※※※※※※※※※※※※※※※※※※※※
計畫類別:□個別型計畫 □整合型計畫 計畫編號:NSC 98-2410-H-011-015-
執行期間:98 年 08 月 01 日至 99 年 07 月 31 日
計畫主持人:王韋堯
計畫參與人員:
邱珮華本成果報告包括以下應繳交之附件:
□赴國外出差或研習心得報告一份
□赴大陸地區出差或研習心得報告一份
□出席國際學術會議心得報告及發表之論文各一份
□國際合作研究計畫國外研究報告書一份
執行單位:
國立台灣科技大學 工商業設計系
中 華 民 國 99 年 07 月 23 日
2
行政院國家科學委員會專題研究計畫成果報告
透過腦事件相關電位(ERP)建構熟年世代對商業包裝設計之 情緒類目與購買意圖關係研究
Establishing Relations of the Mature Generation's Emotion Dimensions and Purchase Intention with Commercial Packaging
Design Through Event-Related Potential
計畫編號:NSC 98-2410-H-011-015- 執行期限:98 年 8 月 1 日至 99 年 7 月 31 日
主持人:王韋堯 國立台灣科技大學工商設計系
計畫參與人員:邱珮華 國立台灣科技大學工商設計系
一、 中文摘要
本研究以「商業包裝擬真設計」為主題,探 究範圍為「集合包裝酒精飲料」,提出包裝「造 形擬真性」與「圖形聯想性」」進行熟年世代「事 件相關電位」、「情緒類目」與「購買意圖」之 探討。並將生心理情緒結果與「購買意圖」結果 進行比較與討論。研究結果發現:(1)商業包裝
擬真設計之「造形擬真性」可分為3 種程度:造
形描繪、造形象徵、造形抽象;「圖形聯想性」
可分為3 種程度:個包裝、產品內容、產品屬性。
(2)ERP 實驗結果發現:在「圖形聯想性」時,
愈高聯想性的圖形設計(個包裝),引起 P300
波段振幅愈大;兩自變項(造形擬真性與圖形聯 想性)在大腦位置活化情形皆為額葉漸進轉移到 頂葉。(3)情緒類目結果發現:在「圖形聯想性」
時,愈高聯想性,愈正效價,高喚醒度。(4)購 買意圖結果發現:在「圖形聯想性」時,愈高聯 想性,愈高購買意圖。(5)綜合比較生心理情緒 與購買意圖結果:在「圖形聯想性」時,愈高聯 想性,愈正效價,ERP 振幅愈大。在「造形擬真 性」時,ERP 振幅、情緒類目結果及購買意圖沒 有關係。本論文期許設計認知研究可以運用直接 探測思考的工具來進行,提出熟年世代設計思考 與大腦活動的關係,有助設計研究跨領域的發展。
關鍵詞:熟年世代、擬真、聯想、事件相關電位、
情緒類目、購買意圖 Abstract
In this study, we advance “packaging-shape simulation” and “figure association” for discussion.
We also center on “simulation-based design for commercial packaging” in the range of “alcoholic beverages in multi-packs” and explore
“event-related potential (ERP)”, “emotion dimensions” and “purchase intention” for the mature generation. In besides, physiological and psychological emotions are compared with purchase intention. We have the following findings based on
the research results: (1) “Packaging-shape simulation” can be divided into three types:
rendering graphic, graphic symbology, and abstract symbology; “picture association” can be divided into three categories: product physicality, product contents, and product property. (2) ERP experiment result shows that in terms of “picture association”, the higher association a picture design has, the larger amplitude at P300 component will be evoked;
activation of the two independent variables
“packaging-shape simulation” and “picture association” in the brain goes gradually from frontal lobe to parietal lobe. (3) The result of emotion dimensions shows that in terms of “picture association”, the higher association, the higher arousal and the more positive valence. (4) The result of purchase intention shows that in terms of “picture association”, the higher association, the stronger purchase intention. (5) A comparison of physiological and psychological emotions and purchase intention shows that in terms of “picture association”, the higher association, the more positive valence and the larger ERP amplitude. In terms of “packaging-shape simulation”, there is no connection among ERP amplitude, emotion dimensions, and purchase intention. To stimulate the cross-discipline development of design studies, we wish to conduct research on design cognition using a tool for exploring thought, and bring up the relation between design idea and cerebral activity of the mature generation.
Keywords: mature generation, packaging-shape simulation, association, event-related potential (ERP), emotion dimension, purchase intention
二、動機與目的
熟年世代泛指45-64 歲(Australian Bureau of Statistics, 2008;莊明達,2004)。此世代人生閱 歷豐富、具有健康、活力、能體驗人生的族群,
並且樂於嘗試消費各式商品、追求個人極致品
3 味,具備一定的消費能力(邱高生,2006)。而 該世代的身、心理開始出現相關老化徵狀,對於 商業包裝的功能、美感與價值等特性產生特別的 視覺需求。此外,許多專家學者觀察當代消費者 的購物型態時發現,有關情緒經驗類型的購買行 為佔了大多數,而消費者的情緒與購買意圖更是 息息相關;包裝設計能傳達產品內容、屬性、用 途、功能和品牌訊息給消費者(Thrasher et al., 2006;星野克美,1988),能使消費者對產品產 生認同感,並且提升產品的附加價值,刺激消費 者的購買意圖。
包裝本身就是一種傳達媒體(Etzel et al., 2001; Shimp, 2000;金子修也,1996;許杏蓉,
2003;陳磊,2006)。在眾多產品競爭激烈的市 場中,沒有包裝的產品已無法生存(許杏蓉,
2003)。本計劃旨在探究「包裝擬真設計」的視 覺特質研究,設計涵括立體造形(3D)與平面圖 形(2D)的表現。造形特徵的變化左右著包裝型 態,圖形能傳達主要產品訊息之影像或圖案設 計,也就是吸引消費者注意、快速辨識與容易記 憶包裝內容物或產品欲帶給消費者聯想之圖形意 象(Underwood & Klein, 2002;林演慶,2002)。
包裝造形與圖像的呈現,能使消費者產生正面的 感受,引發購買行為(Assael, 2006)
依 Meyer 與 Laveson(1981)提出之式樣化 程度與為包裝擬真設計之立體造形分類基礎,定 義為:包裝造形經由簡化的手段,抽離具體意象 之程度。依現況與聯想文獻進行分類,提出自變
數「造形擬真性」可分為3 個程度:「造形描繪
(rendering graphic)」是用較為平滑的線條代替 原來的形狀與輪廓,但仍保留該物體的重要特 徵 , 抽 象 化 程 度 低 。 「 造 形 象 徵 (graphic symbology)」是省略描繪物體部分的形狀與輪 廓,仍保留該物體的局部特徵,以簡化的造形呈 現物體的樣貌,抽象化程度中等。「造形抽象
(abstract symbology)」是破壞描繪物體原有的 形狀與輪廓,以幾何形或自由的線條來表現設計
者欲表達的型態概念,抽象化程度高。將包裝擬
真設計之平面圖形中,所傳達圖形之意涵依現況 與聯想文獻進行分類,提出自變數「圖形聯想性」
可分為3 個程度:「個包裝」是最能清楚、直接、
快速地聯想圖形所傳達的訊息;隱喻圖形聯想性 最高。「產品內容」雖然無法直接了解視覺圖形 所傳達的訊息,但仍能透過聯想理解訊息所傳達 的意涵;隱喻圖形聯想性為中。「產品屬性」是 最不容易聯想圖形所傳達的訊息,有時須經由解 釋才可以理解;隱喻圖形聯想性最低。
本研究之情緒測量方式,是採用腦電波探測 搭配心理認知問卷進行研究。其中,事件相關電
位(event-related potentials, 簡稱 ERP)的腦波探 測技術,是以最不侵入人體之方式,客觀的紀錄
大腦生理活動反應,實驗受測者人數多為6 人以
上。觀察腦波的振幅及活動位置,能了解包裝擬 真設計在大腦思考與決策判斷在大腦認知活動的 思考行為;且不同「情緒類目」之圖片在大腦位
置平均振幅有不同影響。目前國外已廣泛將ERP
運用於廣告媒體與消費者生理反應的市場調查 中。本研究所紀錄之腦電位平均振幅觀測波段為 P300 波段。P300 是一個發生在 300-1000 毫秒的 正向波段(positive potential),提供了精神活動 基礎認知,尤其是對於更新記憶和確立反應(Ma, Wang, Shu, & Dai, 2008)。大量的研究均顯示,
P300 的產生是人腦多個部位共同活動的結果,受 主觀概率、相關任務、刺激的重要性、決策、刺 激的不肯定性、注意、記憶、情感等多因素的影 響(趙侖,2005)。在圖形呈現的實驗任務過程 中,無論是被動觀看或主動的影響,P300 皆會產 生較強的振幅反應(Delplanque et al., 2004; Keil et al., 2002; Langeslag, Franken, & Strien, 2008)。
情緒類目論是將個體自身的感覺和知覺所引 發的情緒,透過效價(valence)與喚醒度(arousal)
兩個維度予以討論,包含了水平軸的正面或負 面,垂直軸的激發或不激發。Russell(2003)的 核心情緒(core affect)概念,更描述了情緒類目 中各種情緒類型;故情緒類目可作為消費者情緒 類型與程度的參考。由於生理腦波探測為一種客 觀紀錄腦電波變化的實驗方式,其缺點是不能瞭 解受測者情緒狀態的認知內容;因此,生理腦波 探測應搭配心理情緒認知維度量表,進行受測者 的自我陳述測量,這樣才能有較完整的測量效果
(Olofsson et al., 2008; Rozenkrants & Polich, 2007;馮觀富,2005)。
購買意圖(purchase intention)是由消費者接 收外部的刺激開始,一直到真正的購買行為產生 之前,其內心產生的一連串的評估過程(王典宸,
2006;葉乃綺,2003)。消費者在接受外在的訊 息後,內心產生預期利益,在被利益的吸引下會 有較高的購買意圖,因而導致購買非計畫性的產 品(王典宸,2006);這種非計畫性的購買稱為
「衝動性購買(impulse buying)」(Stern, 1962;
林建煌,2002)。消費者於購物時產生的情緒能 左右消費者的衝動性購買意圖。消費者購買產品 不單是為了物質上的特性,也因為產品包裝的特 性引起消費者情感共鳴,喚起情緒的愉悅、滿足、
舒適(袁恩培,2004;黃鎣涓,2008)。本研究 操作商業包裝擬真設計之「造形擬真性」及「圖 形聯想性」為自變項,探究其引起的生心理情緒 反應與「購買意圖」之關係。研究目的敘述如下:
4
(1)釐清商業包裝擬真設計之「造形擬真性」及
「圖形聯想性」的重要性。
(2)探討熟年世代於包裝擬真設計對「事件相關 電位」的影響。
(3)調查熟年世代於包裝擬真設計對「情緒類目」
的影響。
(4)暸解熟年世代於包裝擬真設計對「購買意圖」
的影響。
(5)探討熟年世代於包裝擬真設計對「事件相關 電位」、「情緒類目」與「購買意圖」之關 係。
本研究所探究之「商業包裝設計」是以台灣
商業集合包裝酒精飲料作為包裝擬真設計之研究 範圍。現況樣本收集是以自然觀察法(naturalistic observation method ) 與 立 意 抽 樣 ( purposive sampling)之代表性年艦為範疇;其中自然觀察
地點為歐洲第 1、世界第 2 大零售集團家樂福
(Carrefour)之台北中和店為觀察地點,收集時 間自2009 年 7 月至 2009 年 10 月,並以數位相機 拍照存檔,將觀察結果與記錄,繪製成表格呈現,
如表1 所示。研究為增添現況樣本的創新、豐富
性,採用立意性抽樣於2009 年 8 月至 2009 年 12 月,進行國內、外包裝代表性年鑑之飲料集合包
裝樣本收集。兩階段合計收集現況樣本總計 60
個。研究依相關文獻探討及商業包裝擬真設計趨 勢為分類原則,藉由台灣最大之工業用紙與紙器 廠商─正隆紙業公司【註 1】之 5 名包裝設計師,
組成本研究初探之設計實務專家群(expert panel)
【註 2】,進行現況樣本分類;調查之分類樣本
為避免色彩、尺寸所造成的影響,將所有樣本影 印放大縮小為黑白13x13 公分紙卡。最後提出本 研究自變項為:「造形擬真性」與「圖形聯想性」;
在:「造形擬真性」的分類結果得知:擬真性高
的握把設計佔 26.65%,擬真性中的提孔設計佔
68.34%,擬真性低的裝飾設計佔 5.01%;在「圖 形聯想性」的分類結果得知:聯想性高的個包裝 佔 51.68%,聯想性中的產品內容佔 11.67%,聯 想性低的產品屬性佔36.65%。分類結果參照表 2。
表1 包裝樣本觀察記錄表格範例
樣本圖片 包裝樣本內容分析 品名 麒麟啤酒 個包裝容量 350m l 個包裝材質 鋁罐
集合數量 6 集合包裝材質 450 磅紙板
造型擬真性 造形描繪 圖形聯想性 個包裝
蒐集時間 2009/7/17
表2 「造形擬真性」及「圖形聯想性」包裝樣本 造形擬
真性 圖形 聯想性
造形描繪 造形象徵 造形抽象
個包裝
產品內容
產品屬性
三、研究方法與步驟
根據上述之探討動機與結果,提出研究假設
(hypotheses)(如圖 1)為:
H1:「包裝擬真設計(造形擬真性與圖形聯想性)」
對熟年世代「事件相關電位」有影響。(詳 見3.1 節、4.1 節、4.4 節)
H1_a:「造形擬真性」之愈高擬真性與「圖形聯 想性」之愈高聯想性,引起P300 波段振幅愈 大。
H1_b:「造形擬真性」之愈高擬真性與「圖形聯 想性」之愈高聯想性,引起振幅愈偏頂葉電 極位置愈大。
H1_c:「造形擬真性」之愈高擬真性與「圖形聯 想性」之愈高聯想性,引起振幅愈偏左腦電 極位置愈大。
H2:「包裝擬真設計」對熟年世代「情緒類目(效 價與喚醒度)」有影響。(詳見3.2 節、4.2 節、4.4 節)
H3:「包裝擬真設計」對熟年世代「購買意圖」
有影響。(詳見3.2 節、4.3 節、4.4 節)
H3_a:「造形擬真性」愈高擬真性,愈高購買意 圖。
H3_b:「圖形聯想性」愈高聯想性,愈高購買意 圖。
H3_c:情緒類目之「效價」與「喚醒度」對「購 買意圖」有影響。
H4:「包裝擬真設計」對熟年世代「情緒類目」
與「購買意圖」有關係。(詳見3.1 節、3.2 節、4.4 節)
H4_a:「造形擬真性」愈高擬真性,ERP 振幅愈 大,情緒愈正效價、高喚醒,。
H4_b:「圖形聯想性」愈高聯想性,ERP 振幅愈
5 大,情緒愈正效價、高喚醒。
圖1 研究假設
3.1. 包裝擬真設計之於腦事件相關電位
本研究利用ERP 進行包裝擬真設計之情緒電
位實驗,令每位熟年世代受測者觀看9 張不同「造
形擬真性」搭配「圖形聯想性」之設計樣本,並 同步收錄P300 之事件相關電位變化。
3.1.1. 樣本設計
本研究實驗樣本依照不同「造形擬真性」搭
配「圖形聯想性」,以3 乘 3 共 9 種類型之包裝 擬真設計組合;合計9 個實驗設計樣本(表 3)。
表3 「造形擬真性」及「圖形聯想性」包裝設計樣本 造形擬
真性 圖形 聯想性
造形描繪 造形象徵 造形抽象
個包裝
產品內容
產品屬性
註:本研究前測結果發現:男性與女性代言人圖形於商業包裝圖形連 想性中,對消費者 ERP 喚起沒有差異。
召集具實務經驗之台灣科技大學設計研究所 學生10 名組成焦點團體群(focus group)【註3】,
針對研究自變項(造形擬真性與圖形聯想性)進 行樣本設計。樣本中的研究自變項設計,是依據
研究者提供所定義之3 種提攜造形擬真的設計及
圖形聯想性之市場樣本前5 名統計最多的設計元
素(產品內容物、原料、代言人、個包裝及冰塊),
作為焦點團體設計之條件。除研究自變項外,其 餘設計因子(品名、材質、容量、集合數量、色 彩計畫、版面編排及呈現視角)皆控制在研究者 先前統計歸納出包裝擬真設計因子與條件下進 行。10 名焦點團體成員先依據研究者提供的規範
以手繪進行設計;歸納整理10 位焦點團體之設計
重點後;研究者再使用 Illustrator CS2 繪製平面 圖;最後使用Photoshop CS2 進行立體樣本合成 製作。
3.1.2.環境與設備
本研究實驗場地設置於台灣科技大學之腦波 觀察實驗室,實驗環境嚴格控制外在干擾因素(包 括噪音、光線、室溫等)。正式實驗時,研究人 員會退至布幕後觀察腦波接收情形,以降低外在 環 境 對 實 驗 之 影 響 。 實 驗 設 備 包 括 由 美 國 Neuroscan公司研發的兩個系統:生理訊號記錄系 統(Physiological Data Record System)與視覺影 像呈現系統(Visual Image Display System)。生 理訊號記錄系統包含:電極帽(Quik-Cap,依據 國際10-20系統放置)、放大器(NuAmps)及電 腦主機(需安裝SCAN 4.3.3 軟體)。視覺影像呈 現 系 統 包 含 :17 吋 液 晶 螢 幕 ( 呈 現 尺 寸 1024×768)、鍵盤及電腦主機(需安裝STIM2軟 體)。實驗螢幕放置於70公分高的桌面,調整螢 幕位置於受測者視線10-20∘之間,並距離受測者 60-70公分(行政院衛生署國民健康局,2009)。
3.1.3. 研究設計
正式實驗前,先以藥用磨砂膏清潔受測者欲
黏貼電極之臉部及耳骨位置,做去角質之動作。
再將9個欲探測腦波之電極位置,按照國際10-20 系統連接於受測者頭顱各部分,另外連結A1、A2 兩個分別位於受測者左、右耳後乳突 (mastoid) 位置之參考電極點,以及兩對記錄眼動相關肌肉 訊 號 (electrooculogram, EOG) 的 雙 極 式 電 極 HEOL、HEOR、VEOU及VEOL作為眼動參考電 極。並在各電極點施打凝膠,幫助電導體附著頭 皮以及促進電荷的傳送。
實驗施測的過程中,受測者會先進行實驗前
練習,藉以熟悉腦波實驗的測量方式;為確認受 測者於實驗進行中保持專注,12 名受測者需於反 應時間內進行按鍵指令之判斷。正式實驗期間,
每類刺激物隨機出現30 次,且同類刺激物不得連
續出現,共計270 次。實驗依序呈現為:注視點
500 毫秒,刺激物圖片 3000 毫秒,空白畫面 500 毫秒(可休息時段);刺激物圖片與空白畫時段 合計為可反應時間(3500 毫秒)。
3.1.4. 調查對象
因腦波是受測者對視覺刺激的直接生理反
應,故相關認知神經科學研究之受測者人數為10 人以上。本研究從國立台灣科技大學採非隨機抽 樣方式選取碩士班父母中,有飲酒行為,但無嗜 酒、長期服用藥物習慣之12人(男女各6人)作為 受測者;其年齡介於45歲至64歲之間,需無視覺
6 障礙且矯正後視力達0.8以上;並於實驗前48小時 停用具影響腦波之刺激物(如:咖啡因、麻黃素 等)。此12名受測者需於ERP實驗結束後,填寫 設計樣本之情緒認知維度問卷。
3.1.5. 資料分析方法
將腦波實驗之腦電波結果,經過分析軟體 Scan Edit 加以切割、基線較準、雜訊校正以及平 均處理;再使用SPSS12.0 統計軟體中,雙因子變 異數分析與杜凱氏事後考驗(Tukey’s HSD);進 一步將平均振幅之數據,進行統計檢定與事後比 較。研究結果詳見4.1、4.4 節。
3.2.包裝擬真設計之情緒類目與購買意圖 本研究之「情緒類目」與「購買意圖」的研 究採調查法搭配9 階數值尺度(numerical scales)
進行。
3.2.1. 樣本設計
情緒類目與購買意圖調查之刺激物與ERP 實
驗使用之樣本相同(詳見表 3),是以 10 名焦點 團體依照不同包裝擬真設計之「造形擬真性」及
「圖形聯想性」搭配3 乘 3 種組合;合計 9 張調 查圖片進行調查。
3.2.2.環境與設備
本研究問卷調查場地與腦波實驗場地相同,
設置於台灣科技大學之腦波觀察實驗室。問卷呈
現於17 吋液晶螢幕中,受測者透過滑鼠與鍵盤進
行「情緒類目」與「購買意圖」之評估。
3.2.3. 研究設計
本調查之問卷設計,是以設計樣本圖片搭配
量表的方式,令受測者進行「情緒類目」與「購 買意圖」的評估。情緒類目的評估使用「情緒尺 度量表(Russell, Weiss, & Mendelsohn, 1989)」:
十字軸水平方向代表不同「正負面」情緒;十字 軸垂直方向代表情緒「強弱」程度。調查情緒類 目(效價與喚醒度)及購買意圖的評估使用「9 階尺度量表(numerical scales)」:「1」代表效 價最負面、喚醒度最弱、購買意圖程度最低;「9」
代表效價最正面、喚醒度最高、購買意圖程度最 高。
3.2.4. 調查對象
受測者為台灣科技大研究所學生之父母親 12
人(男女各 6 人),採非隨機抽樣方式進行;年
齡介於 45 歲至 64 歲之間,因調查結果需與腦波 實驗結果進行探討,故受測者必須在腦波測試結 束後,進行情緒類目問與購買意圖卷調查。
3.2.5. 資料分析方法
將情緒認知問卷結果透過 SPSS12.0 統計軟 體中,描述統計分析(descriptive statistics)、雙因 子 變 異 數 分 析 (repeated -measures Two-Way ANOVA)以及杜凱氏事後考驗(Tukey’s HSD),
進行問卷數據的統計與分析。研究結果詳見4.2、
4.3、4.4 節。
四、結果與討論
4.1. 「大腦位置」與「事件相關電位」
本 研 究 腦 波 數 據 結 果 分 析 平 均 trail 數 為 22.14。商業包裝擬真設計對ERP誘發結果:P300 約發生在300 -450ms之間。進一步將所收錄之9個 電極點(F3、FZ、F4、C3、CZ、C4、P3、PZ、
P4)依不同大腦位置:在「左、中、右腦」部分,
將F3、C3、P3電極位置之數據合併為左腦;FZ、
CZ、PZ合併為中央;F4、C4、P4則合併為右腦。
在「額、中、頂葉」部分,將F3、FZ、F4電極位 置所得之數據合併為額葉;C3、CZ、C4合併為中 間;P3、PZ、P4合併為頂葉後,進行P300波段與 大腦位置結果統計分析。
此階段欲驗證「包裝擬真設計(造形擬真性 與圖形聯想性)」之「ERP 實驗」結果驗證假設
【H1:「包裝擬真設計(造形擬真性與圖形聯想 性)」對熟年世代「事件相關電位」有影響】。
針對兩自變項在P300 波段的影響進行討論;「圖 形聯想性」對大腦位置「左、中、右腦」電極平 均振幅達顯著時(F=7.835,P=0.000<0.001),其 結果為:個包裝>產品內容、產品屬性;在「額、
中、頂葉」電極平均振幅達顯著時(F=80.695,
P=0.000<0.001),其結果為:個包裝>產品內容>
產品屬性。觀察圖2 可知,受測者於 P300 波段以
聯想性愈高的圖形設計(個包裝),愈能引起ERP
振幅反應。「產品擬真性」則無顯著影響。此結 果使【H1_a:「造形擬真性」之愈高擬真性與「圖 形聯想性」之愈高聯想性,引起 P300 波段振幅 愈大】有條件的成立:圖形聯想性成立,造形擬 真性不成立。大量的研究均顯示,P300 是人腦多 個部位共同活動所誘發的結果,包含注意、辨認、
決策、記憶等認知功能,因此能清楚呈現不同刺 激物所誘發之振幅差異(Ma et al., 2007; 趙侖,
2005),證實 P300 確實為一可靠是測量的波段。
建議設計倘若想在圖形聯想性使熟年世代消費者 於情緒波段誘發較強的振幅,可以於包裝上呈現
「個包裝(高聯想性)」之圖形設計。
針對兩自變項在大腦位置的影響進行討論;
個包裝(高聯想性) 產品屬性(低聯想性)
圖2 在 300 -450ms 時,圖形聯想性之「個包裝」與「產品屬性」於 P300 波段反應
「造形擬真性」與「圖形聯想性」在大腦位置「額、
中、頂葉」電極於P300波段平均振幅達顯著時(造 型:F=102.699,P=0.000<0.001;圖形:F=334.088,
P=0.000<0.001)結果為:頂葉>中間>額葉。代表
「造形擬真性」與「圖形聯想性」所誘發之事件相 關電位中,頂葉已接收到不同圖片的訊息,並將軀 體的感覺與視覺接收結果進行銜接(趙侖,2005);
而頂葉會有明顯振幅增加情形且是由額葉往後漸 漸增加。其中,「圖形聯想性」與「額、中、頂葉」
電極之單項交互作用達顯著之P300波段,進行交互 作用之變異數分析與Tukey’s事後考驗;結果發現:
圖 形 聯 想 性 於 「 個 包 裝 」 ( F=94.124 , P=0.000<0.001 ) 、 「 產 品 內 容 」 ( F=134.546 , P=0.000<0.001 ) 與 「 產 品 屬 性 」 ( F=111.923 , P=0.000<0.001)情況下,大腦位置皆為頂葉>中間>
額葉之振幅呈現顯著差異。此結果使【H1_b:「造 形擬真性」之愈高擬真性與「圖形聯想性」之愈高 聯想性,引起振幅愈偏頂葉電極位置愈大】成立。
與相關研究中顯示典型的ERP都是在頂葉的部分
有最高的振幅結果相符(Delplanque et al., 2006;
Olofsson et al., 2008)。「造形擬真性」與「圖形聯 想性」在大腦位置「左、中、右腦」電極對ERP波 段則無顯著影響。此結果使【H1_c:「造形擬真性」
之愈高擬真性與「圖形聯想性」之愈高聯想性,引 起振幅愈偏左腦電極位置愈大】不成立。
4.2. 熟年世代「情緒類目」
「包裝擬真設計(造形擬真性與圖形聯想性)」
對「情緒類目(效價與喚醒度)」影響之調查結果 顯示,單一觀察包裝擬真設計之「造形擬真性」時,
擬真性愈高與情緒類目間無顯著差異。單一觀察
「圖形聯想性」時,不同「圖形聯想性」對情緒「效 價」的影響達顯著差異(F=41.913,P 值 0.000 <
0.001),經 Tukey’s 事後考驗可以發現:個包裝、
產品內容>產品屬性呈現顯著差異。不同「圖形聯 想 性 」 對 情 緒 「 喚 醒 度 」 影 響 亦 達 顯 著 差 異
(F=3.967,P 值 0.02 < 0.05),經 Tukey’s 事後考 驗後發現:個包裝>產品屬性呈現顯著差異。即聯 想性愈高,愈能引起情緒正效價及高喚醒度。此結 果使假設【H2:「包裝擬真設計」對熟年世代「情 緒類目」有影響】有條件的成立:圖形聯想性成立,
造形擬真性不成立。與相關研究結果,聯想性愈 高,所誘發之情緒類目愈高之結果一致(吳佳穎,
2008)。代表包裝擬真設計之「圖形聯想性」,若 能清楚地讓熟年世代消費者知道所販售之產品,比 呈現內容物、原料、成分或情境塑造的方式,更能 引起消費者情緒感受。
4.3. 熟年世代「購買意圖」
「包裝擬真設計(造形擬真性與圖形聯想性)」
對「購買意圖」影響之調查結果顯示,單一觀察包 裝擬真設計之「造形擬真性」時,擬真性愈高與購 買意圖間無顯著差異,此結果使假設【H3_a:「造 形擬真性」愈高擬真性,愈高購買意圖】不成立。
單一觀察「圖形聯想性」時,不同「圖形聯想性」
對「購買意圖」的影響達顯著差異(F=41.913,P 值 0.000 < 0.001);經Tukey’s事後考驗可以發現:
個包裝、產品內容>產品屬性。即聯想性愈高,愈 能引起消費者購買意圖。使假設【H3_b:「圖形 聯想性」愈高聯想性,愈高購買意圖】成立。與相 關研究結果,聯想性與購買意圖有顯著差異關係存 在一致(楊友棣,2006)。
情緒類目之「效價」與「喚醒度」對「購買意 圖」影響之迴歸分析結果達顯著性(F=472.486,P 值 0.000 < 0.001),且 R² 值為 0.768,代表情緒 效 價 與 喚 醒 度 可 以 解 釋 影 響 購 買 意 圖 之 差 異 有 76.8% 的正確性,其餘不能解釋的部分為 23.2%。
「效價」與「喚醒度」對購買意圖影響皆呈「正相 關」。主要影響購買意圖高低之順序為:「效價
(0.847)」>「喚醒度(0.072)」。標準化迴歸公 式為:購買意圖=效價X 0.847+喚醒度 X 0.072。
此結果表示,熟年世代愈正效價或愈高喚醒度則購
8 買意圖愈高,驗證假設【H3_c:情緒類目之「效價」
與「喚醒度」對「購買意圖」有影響】成立。與相 關研究中,情緒會影響消費者購買意圖呈正向關係 結果一致(Bagozzi et al., 2003; Machleit & Eroglu, 2000;盧殿華,2008)
4.4. 綜合討論
綜合比較「包裝擬真設計(造形擬真性與圖形 聯想性)」對「情緒類目」與「購買意圖」影響結 果顯示:單一觀察包裝擬真設計之「圖形擬真性」
時:「個包裝」設計是熟年世代消費者情緒效價、
喚醒度與購買意圖排名第一之設計。相關文獻指出 消 費 者 在 正 面 情 緒 下 , 會 加 強 正 面 感 受 的 解 讀
(Westbrook, 1987;林建煌,2002);而清楚看見 產品的設計方式(個包裝),使產品的價值更易於 理解,並留下深刻的印象(金子修也,1996),使 消費者產生安全與信賴感,尤其在大眾化的食品與 日常用品,更具有此種現象,消費者常以心理因素 來左右是否購買(吳佳穎,2008;許杏蓉,2003)。
這可能是造成「個包裝」設計引起熟年世代消費者 情緒類目與購買意圖較高之原因。商業包裝仍以商 業利益為首要,應以促進銷售為目的。建議設計師 若想造成「設計差異化」的目標,並引起熟年世代 消費者正面情緒、高喚醒度,進而提高購買意圖,
可以使用市佔率低(5.01%)的「造形描繪」搭配
「個包裝」進行設計。若不希望引起熟年世代消費 者負面情緒,以至降低購買意圖應避免使用「造形 抽象」搭配「產品屬性」進行設計。
綜合比較「包裝擬真設計」對「ERP 實驗」與
「情緒類目」結果;單一觀察包裝擬真設計之「圖 形聯想性」在 P300 反應與情緒類目結果發現:聯 想性愈高的圖形設計(個包裝、產品內容),愈能
引起 ERP 振幅愈強,情緒愈正效價,高喚醒。由
此說明,具聯想性的圖形設計與以往研究情緒的圖 形設計(Olofsson et al., 2008; Spreckelmeyer et al., 2006)有正相關。並且「圖形聯想性」在 P300 反 應約發生在300ms 至 450ms 之間,Olofsson et al.
(2008)指出,從受到情感刺激物開始的 100ms
到數秒鐘之內,情緒的 ERP 振幅與效價有關係,
尤其是在 200ms 至 400ms 之間。具聯想性的圖形
設計與情緒的圖形設計,在 ERP 反應時間也有正
相關。此結果使假設【H4_b:「圖形聯想性」愈 高聯想性,ERP 振幅愈大,情緒愈正效價、高喚醒】
成立。
觀察「造形擬真性」在 P300 反應與情緒類目 結果發現:P300 應與情緒維度結果無相關。此結 果使假設【H4_a:「造形擬真性」愈高擬真性,
ERP 振幅愈大,情緒愈正效價、高喚醒】不成立。
綜合上述結果得知:視覺設計在情緒的研究,若以 腦波探測搭配認知問卷調查,可以有更深入的分析 結果。
五、計畫成果自評
本研究是以「商業包裝設計」中集合包裝酒精
飲料對熟年世代消費者「ERP」、「情緒類目」與、
「購買意圖」之關係進行探討。提出包裝「造形擬 真性」與「圖形聯想性」為自變項;其中造形擬真 性包可分為3個程度︰造形描繪、造形象徵、造形 抽象;圖形聯想性可分為3個程度︰個胞裝、產品 內容、產品屬性。透過ERP實驗收集設計樣本的腦 波振幅在P300波段發現:聯想性愈高的圖形設計
(個包裝),引起ERP振幅愈大;且「造形擬真性」
與「圖形聯想性」在大腦各位置活化的情形皆為由 額葉漸進轉移到頂葉。使假設【H1:「包裝擬真 設計」對熟年世代「ERP」有影響】有條件的成立:
在圖形聯想性條件下,P300及大腦位置「額、中、
頂葉」電極成立。包裝擬真設計於情緒類目結果發 現:假設【H2:「包裝擬真設計」對熟年世代「情 緒類目」有影響】有條件的成立:在圖形聯想性條 件下,愈高聯想性,愈正效價,高喚醒度。包裝擬 真設計於購買意圖結果發現:假設【H3:「包裝 擬真設計」對熟年世代「購買意圖」有影響】有條 件的成立:在圖形聯想性條件下,愈高聯想性,愈 高購買意圖。綜合比較包裝擬真設計、情緒類目與 購買意圖結果發現:假設【H4:「包裝擬真設計」
對熟年世代「情緒類目」與「購買意圖」有關係】
有條件的成立:在圖形聯想性條件下,愈高聯想 性,ERP振幅愈大,愈正效價,高喚醒。且與以往 相關研究結果比較發現:聯想性愈高的圖形設計與 以往研究情緒的圖形設計及ERP反應時間呈正相 關。
針對本研究之成果,提出後續相關研究之建議
與方向:(1)於設計教育中,探究能使設計師在 P300波段產生聯想性的誘發因子,以協助創意的激 發與進行。(2)可針對「注意力」與「辨識」的 ERP波段與認知問卷進行探究,提供商業領域更精 準的熟年世代消費者認知歷程結果。(3)發展研 究其他商業視覺設計,如:廣告設計、文字設計與 色彩,在大腦認知活動的思考行為;以建構更完善 的跨領域合作資料庫。
本計畫成果達到計畫研究目標,透過了設計、
生理與心理之三個層面的聯合分析,使設計者在主 觀 的 包 裝 造 型 與 圖 像 設 計 上 輔 以 科 學 客 觀 的 方 式,建構影響熟年世代消費者生心理情緒之商業包 裝設計準則。研究成果適合作學術期刊發表與協助 設計者進行商業包裝設計時之參考與依據。
註釋
1. 正隆紙業公司為台灣最大之工業用紙與紙器之 領導廠商,產銷據點跨足中國、泰國、越南、
日本、美國、歐洲、澳洲等地,同時是全球前 百大紙業公司之一。樣本分類於正隆紙業公司 會客室進行。分類時間為 2010 年 1 月 23、30 日,每次進行約1 小時的現況 60 個酒精飲料集 合包裝擬真設計之分類。
2. 現況樣本內容分析之實務設計專家群是由正隆
紙業公司成員所組成,背景為具4 年以上資歷
9 之專業包裝設計師,專家團體成員年齡區間整 理如表4,設計資歷參照表 5。
表4 現況樣本分類之實務專家成員年齡區間
年齡(歲) 21~30 31~40 41~50
人數(人) 2 2 1
表5 現況樣本分類之實務專家成員設計資歷
資歷年資 4~6年 7~9年 10年以上
設計主管 0 0 1
資深設計師 0 1 1
設計師 2 0 0
3. 為增加設計樣本的信度與效度,本研究召集 10 名具備商業設計背景與相關實務經驗者,平均 實務經驗5.5 年,平均年齡 24.8 歲,作為研究
樣本設計之焦點團體,其成員資料整理如表6
及表7。
表6 樣本設計之焦點團體成員年齡區間
年齡(歲) 21~25 26~30
人數(人) 7 3
表7 樣本之焦點團體成員設計資歷
資歷年資 2~4年 5~7年 8~10年
資深設計師 0 4 3
設計師 3 0 0
六、參考文獻
1. Assael, H. 著,黃明蕙譯(2006)。消費者行 為:策略性觀點。台北市:雙葉,52–56、
90–93。
2. Bagozzi, R. P., Dholakia, U. M., & Basuroy, S.
(2003). How effortful decisions get enacted:
The motivating role of decision processes, desires, and anticipated emotions. Journal of Behavioral Decision Marking, 16, 273–295.
3. Delplanque, S., Lavoie, M. E., Hot, P., Silvert, L., & Sequeira, H.(2004). Modulation of cognitive processing by emotional valence studied through event related potentials in humans. Neuroscience Letters, 356, 1–4.
4. Delplanque, S., Silvert, L., Hot, P., Rigoulot, S.,
&,Sequeira, H.(2006). Arousal and valence effects on event-related P3a and P3b during emotional categorization. International Journal of Psychophysiology, 60, 315–322.
5. Etzel, M. J., Walker B. J., & Stanton, W. J.
( 2001 ) , Marketing teieth12th Edition, McGraw-Hall Inc., New York.
6. Keil, A., Bradley, M. M., Hauk, O., Rockstroh, B., Elbert, T., & Lang, P. J.(2002). Large-scale neural correlates of affective picture processing.
Psychophysiology, 39, 641–649.
7. Langeslag, S. J..E., Franken, I. H. A., & Strien, J. W. V.(2008). Dissociating love-related attention from task-related attention: An event-related potential oddball study.
Neuroscience Letters, 431, 236–240.
8. Ma, Q., Wang, X., Shu, L., & Dai, S.
(2008 ) .P300 and categorization in brand extension. Neuroscience Letters, 431, 57–61.
9. Machleit, K. A., & Eroglu, S. A.(2000).
Decribing and Measuring Emotional Response to Shopping Experience. Journal of Business Research, 49, 101–111.
10. Meyer, R. P., & Laveson, J. I. (1981). An Experience-Judgement Approach to Tactical Flight Training. Proceedings of the Human Factors Society-25th Annual Meeting, 657-660.
11. Olofsson J. K., Nordin S., Sequeira H., & Polich J.(2008). Affective picture processing: An integrative review of ERP findings. Biological Psychology, 77, 247–265.
12. Rozenkrants, B., & Polich,J.(2007). Affective ERP processing in a visual odd ball task: arousal, valence, and gender, submitted for publication.
Clinical Neurophysiology, 119, 2260–2265.
13. Russell, J. A.(2003). Core Affect and the Psychological Construction of Emotion.
Psychological Review, 110(1), 145–172.
14. Shimp, T. A. ( 2000 ) , Advertising Promotion-Supplemental Aspects of Integrated Marketing Communication-fifth edition, Harcourt Inc., U.S.A.
15. Spreckelmeyer, K. N., Kutas, M., Urbach, T. P., Altenmuller, E., Munte, T. F.(2006). Combined perception of emotion in pictures and musical sounds.Brain Research, 1070, 160–170.
16. Stern, H.(1962). The Significance of Impulse Buying today. Journal of Marketing, 26(2), 59-62.
17. Thrasher, J. F., Niederdeppe, J. D., Jackson, C.,
& Farrelly, M. C.(2006). Using anti-tobacco industry messages to prevent smoking among high-risk adolescents. HEALTH EDUCATION RESEARCH, 21(3), 325–337.
18. Underwood, Robert L. and Klein, Noreen M (2002)packaging as brand Communication:
effects of Product pictures on consumer responses to the package and brand, Journal of Marketing Theory & Practice, Vol. 10(4), 58-69.
19. Westbrook, R. A. ( 1987 ) , “ Product/
Consumption-Based Affective Responses and Postpurchase Processes, " Journal of Marketing Research, 124, August, pp. 258-270.
20. 王典宸(2006)。便利商店「第 n 件商品促 銷」促銷方式對人為購買慾望之影響。國立 中山大學企業管理學系研究所碩士論文。
21. 吳佳穎(2008)。包裝圖像文字之情緒維度 與腦事件相關電位研究。國立台灣科技大學 設計研究所碩士論文。
22. 林建煌,(2002),消費者行為,台北:智 勝文化。
23. 林演慶、王韋堯(2002)。圖形式樣化在零 售產品包裝插圖設計之應用。設計學報,7
(2),77–93。
24. 邱高生(2006)。<熟年世代-16>三叔公與九 嬸婆。擷取日期:2009 年 12 月 9 日。擷取自:
10 東方線上E-ICP。
http://www.isurvey.com.tw/cgi-bin/big5/file/pu 50?&q1=v2&q22=3636&q7=20&q8=20081209 -140.118.10.965:01&q9=64&q2=1&q33=熟年 世代&q34=&q35=&q36=&q37=&q99=。
25. 金子修也著,廖志忠譯(1996)。包裝設計- 夜晚和地球都是包裝。台北:博遠,19、39–
43、68。
26. 星野克美著,黃恆正譯(1988)。符號社會 的消費初版。台北:遠流出版社。
27. 袁恩培(2004)。消費心理在包裝設計中的 應用與研究。包裝工程 Packaging Engineering, 25(1),105–123。
28. 莊明達、蔡宗昱、鄭婉怡、王麗楨、賴宜琳
(2004)。熟年風華。台南:統一夢公園。
29. 許杏蓉(2003)。現代商業包裝學:理念、
觀念、實務。台北:視傳文化,186。
30. 陳磊(2006)。包裝設計。北京:中國青年 出版社,10–11。
31. 馮觀富(2005)。情緒心理學。台北:心理,
17。
32. 黃鎣涓(2008)。在感性消費時代中的創意 包裝設計。包裝工程,29(6),3。
33. 楊友棣(2006)。兩岸筆記型電腦市場品牌 聯想、知覺風險與顧客滿意對購買慾望影響 之研究。大葉大學國際企業管理學系碩士論 文。
34. 葉乃綺(2003)。滿額現金回饋促銷型態對 非計劃性購買行為之影響。國立成功大學國 際企業研究所碩士論文。
35. 趙侖(2005)。ERP 實驗教程。天津:社會 科學院出版社。36、39。
36. 操作電腦終端機視力保健須知(2009)。2009 年5 月 13 日,取材自:行政院衛生署國民健 康局。
http://health99.doh.gov.tw/media/public/pdf/s11 122.pdf。
37. 澳大利亞統計局(Australian Bureau of Statistics)。Health of Mature Age Workers in Australia。擷取日期:2009 年 12 月 9 日。擷 取自:
http://www.abs.gov.au/ausstats/[email protected]/mf/48 37.0.55.001
38. 盧殿華(2008)。電視購物誘發消費者衝動 性購買行為之探討。國立東華大學企業管理 學系碩士論文。
KEER2010, PARIS | MARCH 2-4 2010
INTERNATIONAL CONFERENCE ON KANSEI ENGINEERING AND EMOTION RESEARCH 2010
RESEARCH INTO THE EMOTION DIMENSIONS REVEALED BY THE
COLORS OF BEVERAGE PACKAGING
Anonymous for reviewing
ABSTRACT
In this study, “color temperature of white light” and “color scheme of packaging” were proposed as important factors in affecting the displayed colors on beverage packaging. We also made a survey on what the recipients’ emotional cognition categories would be under alternate influence of the two design properties mentioned above. After observing and analyzing the existing design samples, we had three findings: (a) For the trend of displayed colors on beverage packaging in “color temperature of white light”, “high color temperature” (55.33%) is in the majority; in “color scheme of packaging”, “multicolor hue” (67.4%) is in the majority. (b) For the emotion dimensions of displayed colors on beverage packaging in “color temperature of white light”, “medium color temperature” can better create positive valence (medium color temperature > low color temperature > high color temperature). For those in “color scheme of packaging”, “similar hue” can best create positive valence (similar hue > multicolor hue >
contrast hue). (c) The comparison of current quantity and emotion survey shows that the existing color display of beverage packaging is negatively correlated to consumer emotions.
“Color temperature of white light” and “color scheme of packaging”, proposed in this study as criteria for categorization of displayed colors on beverage packaging, will be able to clearly present design trend in the market. We hope this paper will make a contribution to the studies of displayed colors on beverage packaging and consumer emotions.
Keywords: color scheme of packaging, hue, white-light LED, color temperature, emotion
1. INTRODUCTION
This study aims to explore the actual applications of both “color temperature of white light”
and “color scheme of packaging” in displayed colors on beverage packaging and consumer emotions toward them. The purpose of this study is threefold: 1. by reference to related literature, to present “color temperature of white light” and “color scheme of packaging” as important factors in affecting the displayed colors on beverage packaging, 2. to observe the color temperature of white light and color scheme of beverage packaging in some physical stores in Wanhua District of Taipei, Taiwan, and accordingly analyze and conclude the actual applications of “color temperature of white light” and “color scheme of packaging”, and 3. to survey the relations of the two above-mentioned factors to arousal of consumer emotions.
1.1. Definitions
1.1.1. Emotion dimensions
Emotion, also named “affect”, refers to an internal feeling state [1] and represents a general term used to refer to the collection of moods (low intensity, diffuse affective states) and emotions (differentiated, intense affective states with clear causes) [2]. This physical state involves all physiological constructions, and an obvious or slight behavior that occurs in a specific situation [3]. However, the emotions aroused by sensation and perception of the individual self are closely related to the nature and strength of objective matters, and subjective consciousness of the person concerned. The emotions may be pleasant or unpleasant; the strength of stimulus may be mild or strong; the target pointed may be active and positive or passive and negative [4]. The “positive to negative side” and “strong to weak in degree” are the polarities of emotions. Emotional intensity, continuity and stressfulness are divided into different states by emotion dimensions, according to multidimensional depiction. Emotion dimensions are commonly composed of two dimensions: (1) valence (or “pleasure”) ; (2) arousal (or “activation”) [5]. In the Circumplex Model of Affect presented by Russell [6], emotion category - valence (pleasure) is vertically crossed with emotional intensity - arousal.
Distributed in circle around this crossing structure are 28 types of emotions, all of which represent the degrees of pleasure and arousal. Russell [7] categorized the types of emotions on the Circumplex Model of Affect into 8 major emotions, called “Core Affect”. On the other hand, International Affective Picture System (IAPS), developed by Lang et al. [8], is generally used in the present studies on emotion. Valence levels in this system go from “repulsive (-)” at low valence to “attractive (+)” at high valence; for arousal levels, from relaxing (R) at low arousal to activating (A) at high arousal, with neutral (N) in the middle; for the degrees of “valence” and
“arousal”: A+ (positive valence, high arousal), A- (negative valence, high arousal), N (neutral ), R+ (positive valence, low arousal), and R- (negative valence, low arousal).
1.1.2. Displayed colors on beverage packaging
An atmosphere has played an important role in the sensory strategy for a retail environment.
The main focus is set on purchase experience, such as sales promotion, architecture and lighting effect [9]. As 70% of purchase decisions are made in the store, the colors and styles of packaging determine whether a deal will be made once a consumer intends to buy something [10]. Under changing illumination, consumers tend to remember the reference color as more saturated [11], while changing background colors may influence product quality ratings [12].
Therefore, illumination in a retailer and consumers' color perception will affect their emotions
(like pleasure & arousal), and then prompt them to either get closer to buying desire or conduct avoidance behavior like leaving the retailer [12,13].
1.1.3. Color temperature of white-light LED
White-light LED has such advantages as energy-saving, long life, mercury-free, weatherproof, fit for mass production, quick response, etc. With improvement in brightness, technology, and yield rate of mass production, white-light LED with high luminance was introduced into the lighting market [14].
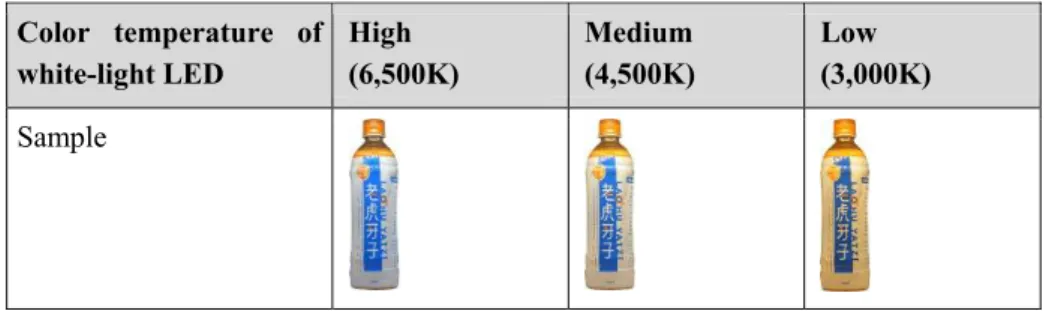
Take Wal-Mart for example, the application of white-light LED in refrigerators has been approved to be able to boost product visibility and consumer satisfaction [15]. CIE divided the color temperature in indoor illumination into three classes: (1) light source with warm hue and color temperature at 3,300K. The light is yellowish and feels warmer; (2) light source with middle hue and color temperature at 3,300K-5,000K; (3) light source with cold hue and color temperature at 5,000K and over. The light is pale green and gives colder feel [16]. According to Chang, Shie, Fong, Chang, & Lai’s research results [17], people prefer color temperature at 3,000K as it suits indoor illumination for all kinds of psychological states. Whitish color (4,000K & 6,500K) is influential to the functions of human organs like the heart, tongue, eyes, spleen, pancreas, stomach, brain, and blood vessel [18]. In this study, the connections between displayed colors on beverage packaging and color temperature of white-light LED are explored in three classes: 6,500K, 4,500K, and 3,000K, as shown in Table 1.
Table 1: Samples for color temperature of white light Color temperature of
white-light LED
High (6,500K)
Medium (4,500K)
Low (3,000K) Sample
1.1.4. Color scheme of beverage packaging
Colors applied to packaging are able to evoke a free association by impression. When two or more colors are adjacent, the resulted effect is called “color harmony”, which is essential for design proper, and which is mainly affected by chroma, value, and hue [19]. A color scheme featuring hues is easy to recognize and catch attention. This way of design is the easiest one to make difference [20]. The color scheme featuring hues takes the larger-area color as its major hue, and the rest as minor hues [20,21]. Judging by the included angle between major hue and minor hues on Itten's 12-hue color circle, we found a single hue for 30 degrees below, a similar hue for 30-90 degrees, a contrast hue for 120-150 degrees, and a complementary hue for 180 degrees. In this study, the color scheme of packaging is divided into three categories:
“multicolor hue”, “contrast hue”, and “similar hue”, as shown in Table 2.
Table 2: Definition of color scheme of packaging and its samples Multicolor
hue
More than 3 hues on the PET bottle
Included angle between major hue and minor hues is 0-180 degrees
Including similar, contrast, and complementary hue
Contrast hue
2 hues on the PET bottle
Included angle between major hue and minor hues is 120-180 degrees
Including contrast and
complementary hue
Similar hue
1~2 hues on the PET bottle
Included angle between major hue and minor hues is 0-90 degrees
Including single and similar hue
2. METHOD 2.1. Questionnaire
The questionnaire in this study includes pictures of the samples, combining with emotion category - valence (pleasure) and emotion intensity - arousal in emotion dimensions. The most widely used a 9-pt numerical scale in emotion measurement is also offered for test recipients to make assessment. After viewing the samples representative of the displayed colors on beverage packaging, they have to mark on the degrees of “valence” and “arousal”, as shown in Table 3.
Table 3: Scales in the questionnaire for emotion dimensions Emotion category
(negative←→positive)
N ←─────────M──────────→ P
□ □ □ □ □ □ □ □ □ 1 2 3 4 5 6 7 8 9 Emotion intensity
(weak←→strong)
W ←─────────M──────────→ S
□ □ □ □ □ □ □ □ □ 1 2 3 4 5 6 7 8 9 2.2. Collecting beverage samples
In this study, we observed 9 stores, categorized as convenience store, supermarket, and hypermarket, located in Dali, Longshan, and Xiyuan areas of Wanhua District, by means of purposive sampling, from May to August in 2009, and beverages sold in the stores. The beverages were packaged in PET bottles with a volume of 300~900 ml, amounting to 312 samples. We recorded the refrigerators in the 9 stores, bought their beverages, and took photos of them with a digital camera for a file.
2.2.1. Categorization of samples
After collecting samples, “color temperature of white light” and “color scheme of packaging”
of the displayed colors on beverage packaging defined in the related literature were used both as criteria for categorization and for analysis of white light color temperature in the 9 stores and the 312 bottle samples. In this study, samples with similar model and proportion, representative of multicolor hue, contrast hue, and similar hue, were selected in Latin squares, and a total of 9