行政院國家科學委員會專題研究計畫 成果報告
運動價值信念與運動行為-概念與測量
計畫類別: 個別型計畫 計畫編號: NSC93-2413-H-028-002- 執行期間: 93 年 08 月 01 日至 94 年 10 月 31 日 執行單位: 國立臺灣體育學院競技運動系 計畫主持人: 廖主民 報告類型: 精簡報告 報告附件: 出席國際會議研究心得報告及發表論文 處理方式: 本計畫可公開查詢中 華 民 國 95 年 1 月 23 日
Introduction
According to Eccles’s Expectancy-value Model (Eccles et al., 1983), an individual’sexpectationsofsuccess(expectancy beliefs)and subjectivevalue(value beliefs)ofagiven task oractivity aresalientpredictorsofindividual’smotivation. Eccles’swork on adolescentshasgiven primary validity to thestructure ofexpectancy and value beliefs in academic domain (Eccles & Wigfield, 2002; Fredricks & Eccles, 2004). However, the structure of expectancy and value has not been thoroughly examined in sport domain. It is also arguable that structures of these beliefs (especially value beliefs) can be highly culture dependant.
Study 1
In this study, we extended Eccles’s work on examining the structure of expectancy and value beliefs in sport domain with three major changes. First, our sample is from a Taiwanese/Chinese cultural background whose value beliefs may be different in nature from that of those from North America. Second, our sample comprised individuals in various developmental stages, including Grade 4, 8, 11 students and college sophomores. Third,theconceptof“cost”wasincluded.Costis one of the components of value, according to Eccles et al (1983), but it has seldom been examined.
Method
Participants
N=954 (1087 questionnaires administered, return rate = 87.76%). Grade 4: n = 227; 125 males, 102 females; age = 9.25 (SD = 0.43). Grade 8, Grade 11, and College sophomore: n = 727; 362 males, 365 females, age = 9.25 (SD = 0.43); age = 16.59 (SD = 2.61).
The Formation of Items and Procedure
Items from The Self- and Task-Perception Questionnaire (Eccles and Wigfield, 1995) were translated to Chinese with a back-translation procedure. The original items were to measure perceptions of mathematics; necessary modifications were made for sport. Ten items were added to measure the negative aspect of value: cost. According to Eccles, cost consists of three components: loss of value alternatives, significant other’s expectations, and psychological cost of failure.7-point Likert scales were used. A pilot study (n = 10) was conducted with participants from 4 age groups. The main data collection was administered by the researchers with standardized procedures.
Data Analysis
Data collected from young children (Grade 4) and Adyoung adults (Grade 8, 11, and college sophomores) were analyzed separated due to possible developmental differences. Item analyses (item-total correlations, coefficient alpha) were conducted to identify the most reliable dimensions and individual items.
A principal-axis factor analysis with orthogonal rotation was conducted to further examine the structure of the measurement. Only factors that exceeded an eigenvalue of 1.0 in the initial extraction were retained for the final solution and only items with loadings of .50 or higher were considered to load on a factor.
Results
Young Children
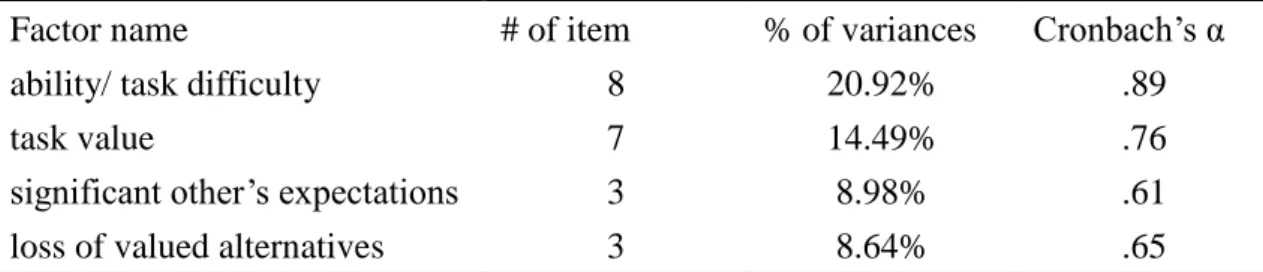
A 4-factor solution was found, including (a) ability/ task difficulty, (b) task value, (c)significantother’sexpectations(cost),and (d)lossofvalued alternatives(cost).A total of 21items for an explanation of 53.03% total variances. See Table 1.
Table 1. Number of item, % of variances, and Cronbach’s α coefficients of each factor for young children
Factor name # of item % of variances Cronbach’sα
ability/ task difficulty 8 20.92% .89
task value 7 14.49% .76
significantother’sexpectations 3 8.98% .61
loss of valued alternatives 3 8.64% .65
Adolescents and young Adults
Factor analysis showed a 4-factor solution, including (a) ability/expectancy, (b) task value, (c) required effort (cost), and (d) fear of failure (cost). A total of 15 items for an explanation of 67.67% total variances. See table 2.
Table 2. Number of item, % of variances, and Cronbach’s α coefficients of each factor for adolescents and young adults
Factor name # of item % of variances Cronbach’sα
ability/expectancy 5 22.13% .88
task value 4 17.79% .80
required effort 3 15.19% .82
Discussion
These findings are consistent with Eccles’s notion that expectancy and value beliefs are two separate concepts. For Taiwanese, however, the positive aspect of value seems to be a global rather than a three dimensional concept (attainment, intrinsic, and utility) found in North American samples. Cost, the negative aspect of value, appears to be a multidimensional concept. Young children worry about loss of valued alternatives and expectations of others, while adolescents and young adults are concerned about required effort and failure. Further studies using confirmatory factor analyses to examine the structures found in this sample are needed. It also warrants further works in examining predictive validity(e.g., prediction of sport participation) of this measurement.
Study 2
This study was a follow-up of our previous work (Liao et al., 2004). We used a new sample to assess the structure of the Sport Expectancy-value Scale by using confirmatory factor analysis with structural equation modeling.
Method
Participants
Participants consisted of 563 Grade 4, 8, and 11 students (34.8%, 34.1%, 31.1%, respectively). Age ranged from 9 to 19 (M=13.85,SD=3.09), 268 were male (47.6%) and 288 were female (51.2﹪). Consent forms were completed by participants and their parents prior to data collecting.
Instrument and procedure
The Sport Expectancy-value Scale was administered to the participants by the researchers in classroom settings. The scale comprises 25 items for five dimensions: ability/task difficulty (8 items), required effort (4 items), fear of failure (4 items), significantother’sexpectations(3 items), and task value (6 items).
Results
Reliability
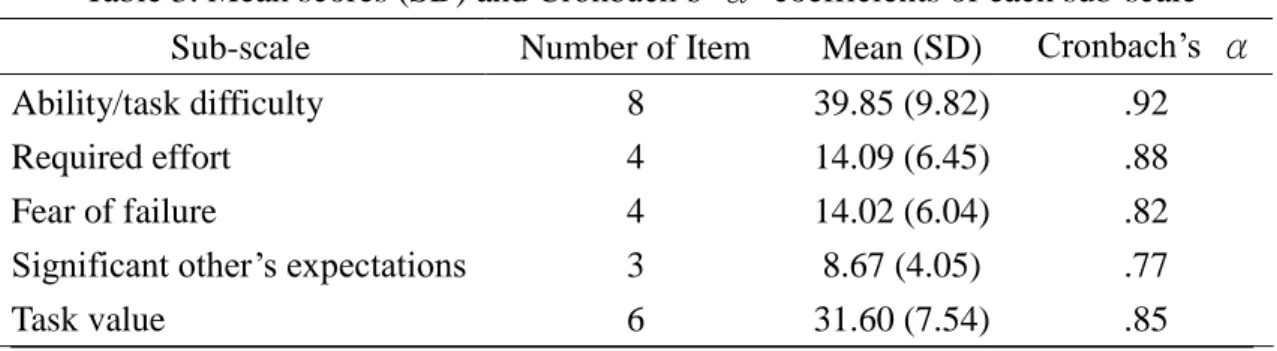
Examination of internal consistency showed ideal reliabilities of each sub-scale of the questionnaire (see table 3).
Table 3. Mean scores (SD) and Cronbach’s α coefficients of each sub-scale Sub-scale Number of Item Mean (SD) Cronbach’s α
Ability/task difficulty 8 39.85 (9.82) .92
Required effort 4 14.09 (6.45) .88
Fear of failure 4 14.02 (6.04) .82
Significantother’sexpectations 3 8.67 (4.05) .77
Task value 6 31.60 (7.54) .85
N=563
Factor analysis
A principal-axis factor analysis with oblique rotation and specified number of 5 factors was conducted to examine the factor structure of the measurement on this sample. Results showed a complete identical structure to that of the sample of Liao et al. (2004), providing a reasonable ground for a further confirmatory factor analysis.
Confirmatory factor analysis
Confirmatory factor analysis using maximum likelihood estimation was conducted using the LISREL program. A standard first-order measurement model was tested, with the five factors represented by the 25 items. The analysis showed an acceptable goodness-to-fit (see Table 4). Therefore, no modification of the model was made and no items were removed from the scale.
Table 4. Goodness-to-fit indexes of confirmatory factor analysis
χ2 χ2
/df GFI RMR NFI NNFI CFI RFI IFI RMSEA CN
834.35* 3.14 .89 .05 .95 .96 .97 .95 .97 .06* 217
*p<.05.
Discussion
The purpose of this study was to confirm the factor structure of expectancy-value beliefs of young Taiwanese in the sport domain measuring by the Sport Expectancy-value Scale. Results of confirmatory factor analysis and internal consistency tests revealed good factor validity and reliability characteristics of the scale. The use of this scale in future research of expectancy and value should be promising.
There are several implications of the findings of this study and our previous work (Liao et al., 2004). First, Eccles’snotion thatexpectancy and valuebeliefsareseparate concepts was supported. Second, for Taiwanese, the positive aspect of value seems to
Cost, the negative aspect of value, appears to be multidimensional.
Future studies examining construct validity(e.g., predictive validity to sport participation and gender)of the Expectancy-value Scale is of course warranted.
Reference
Eccles, J., Adler, T., Futterman, R., Goff, S., Kaczala, C., Meece, J., et al. (1983). Expectancies, values, and academic behaviors. In J. Spence (Ed.),
Achievement and achievement motives (pp. 75-146). San Francisco, CA: W.
H. Freeman.
Eccles, J., & Wigfield, A. (1995). In the mind of the actor: The structure of adolescents’ achievement task values and expectance—related beliefs.
Personality and Social Psychology Bulletin, 21(3), 215-225.
Eccles, J., & Wigfield, A. (2002). Motivation beliefs, values and goals. Annual Review
of Psychology, 53, 109-132.
Fredricks, J., & Eccles, J.S. (2004). Parental influences on youth involvement in sport. In M. Weiss(Ed), Developmental sport and exercise psychology: A
lifespan perspective (pp.145-164). Morgantown, WV: Fitness Information
Technology.
Liao, C., Lin, C., Liu, Y., & Lee, Y. (2004, June). Expectancy and value beliefs in sport: The perspective of young Taiwanese. Poster session presented at the annual conference of The North American Society for the Psychology of Sport and Physical Activity, Vancouver, Canada.