國立交通大學
材料科學與工程學系
博士論文
一維暨三維奈米結構對於電化學特性及
產氫應用的研究
Study on One- and Three-Dimensional
Nanostructures for Electrochemical
Characteristics and Hydrogen Production
Applications
研究生:林彥谷
指導教授:陳三元 博士
陳貴賢 博士
林麗瓊 博士
一維暨三維奈米結構對於電化學特性及產氫應用的研究
Study on One- and Three-Dimensional Nanostructures for
Electrochemical Characteristics and Hydrogen Production
Applications
研 究 生 : 林彥谷 Student : Yan-Gu Lin
指導教授 : 陳三元 博士 Advisor : Dr. San-Yuan Chen
陳貴賢 博士 Dr. Kuei-Hsien Chen
林麗瓊 博士 Dr. Li-Chyong Chen
國 立 交 通 大 學
材 料 科 學 與 工 程 研 究 所
博 士 論 文
A Dissertation
Submitted to Department of Materials Science and Engineering
College of Engineering
National Chiao Tung University
In Partial Fulfillment of the Requirements
For the Degree of
Doctor of Philosophy
in Materials Science and Engineering
November 2010
中文摘要
由於對石化燃料的依賴噵致近來發生的能源危機,從事發展新穎奈米結構材料 在乾淨能源方面之應用變成非常重要的研究。本論文首先利用化學氣相沉積法所 製備出垂直陣列之掺氮奈米碳管擁有獨特的微結構和電化學特性,藉由微結構、 鍵結、電子轉移行為以及後續白金觸媒的電化學沉積等探討掺氮對於奈米碳管之 影響。發現掺氮奈米碳管所形成的表面缺陷,導致近乎逆的電子轉移,並提供白 金粒子於奈米碳管表面的成核點以應用於燃料電池。接著研發三種不同的奈米結 構,即銅奈米粒子/氧化鋅奈米棒之奈米複合材料、微波活化氧化銅奈米針尖/氧 化鋅奈米棒之奈米複合材料以及氧電漿活化氧化銅-氧化鋅之反蛋白石複合結 構,以作為微型重組器的觸媒。首先使用銅奈米粒子/氧化鋅奈米棒之奈米複合 材料為觸媒可於低重組溫度下(250 ℃)達到高甲醇轉換率(93%)、高氫產率(183 mmol gcat-1 h-1)、低一氧化碳濃度(170-210 ppm)。這可歸因於銅奈米粒子之高表面 積和分散性、銅物種的電子結構被修飾以及金屬-承載體間存在強烈的交互作 用。接著以微波處理對於氧化銅奈米針尖/氧化鋅奈米棒之奈米複合材料,證明 可明顯改善甲醇重組反應之催化性能,此可歸因於氧化銅/氧化鋅界面處有缺陷 形成與強交互作用力產生。然後利用氧電漿處理製備出含有高濃度氧空缺之氧化 銅-氧化鋅反蛋白石複合結構,以提升甲醇重組反應的催化性能,即可於更低重 組溫度下(230 ℃)達到接近完全甲醇轉換率、高氫產率、低一氧化碳濃度與出色 的穩定性。最後,利用碳改質之氧化鋅反蛋白石結構以作為光電化學分解水產氫 的光電極。藉由加熱氧化鋅和聚苯乙烯蛋白石模板,可以直接在 ITO 基板上合 成出碳嵌入氧化鋅基材的反蛋白石結構。於光子轉換成電流的量測中,相較於純 氧化鋅結構在可見光波段,碳改質之氧化鋅反蛋白石結構其光反應表現出顯著的 增加。於照明功率密度為100 mW/cm2下,碳改質之氧化鋅反蛋白石結構表現出 高光電流密度(1 mA/cm2)與高光子轉換成氫的效率(0.75%)。這些結果顯示出碳改Abstract
There has become of interest in the development of novel and nanostructured materials for the application of clean energy. Part I is focused on “Effects of in-situ Nnitrogen-doping on the microstructure and electrochemical activity of carbon nanotubes”. In this work, the CNx NTs doped with an optimal N concentration
resulted in a nearly reversible ET behavior due to uniform and high density of surface defects which are desirable for further nucleation of Pt particles on the surface of CNx
NTs to form a composited electrode for electrochemical energy device applications such as fuel cells and capacitors. In Part II, we have developed three kinds of different nanostructures, i.e. Cu nanoparticle (NP)/ZnO nanorod (NR) nanocomposites, microwave-activated CuO nanotip/ZnO NR nanocomposites, and O2 plasma-activated
CuO-ZnO inverse opals, for high efficiency of microreformer applications. The fist one, high conversion of methanol (93%), high hydrogen production rate (183 mmol gcat-1 h-1), low CO formation (170-210 ppm), and good stability at a low-reformation
temperature of 250 ℃ have been achieved for Cu NP/ZnO NR nanocomposites. The superb catalytic performance of the Cu NP -decorated ZnO NR nanostructures can be attributed to the larger surface area and enhanced dispersion of fine Cu NPs, formation of microstrain, the modification of electronic structure of Cu species, and the existence of strong metal-support interaction (SMSI) effect. The second one, microwave treatment to CuO nanotip/ZnO NR nanocomposites has been demonstrated to remarkably improve the catalytic performance in methanol reforming reaction. Comparative to conventional thermal annealing, microwave treatment significantly enhances the catalytic activity of the catalysts, which might be attributed to defect formation, i.e. microstrain, and strong interaction in CuO/ZnO interface. The
reaction at a low-reaction temperature of only 230 ℃, yielding nearly complete conversion of methanol, ultrahigh hydrogen production rate, ultralow CO formation, and outstanding stability.
For the last Part III, we reported the simple synthesis of carbon-modified ZnO inverse opals, and their implementation as photoelectrodes in photoelectrochemical (PEC) cells for hydrogen generation from water splitting. The in-situ incorporating carbon into the ZnO matrix was synthesized directly on the ITO substrate through annealing of the blends of ZnO and polystyrene-opal template. Incident-photon-to-current-efficiency measurements carried out on PEC cell with carbon-modified ZnO inverse-opal photoanodes demonstrate a significant increase of photoresponse in the visible region compared to pure ZnO structures. Upon illumination at a power density of 100 mW/cm2, carbon-modified ZnO inverse-opals show high photocurrent density of 1 mA/cm2 with photon-to-hydrogen conversion efficiency of 0.75%. These results suggest substantial potential of carbon-modified ZnO inverse opals in PEC water splitting applications.
Keywords: carbon nanotube, zinc oxide, copper, methanol reforming, hydrogen, water splitting
Acknowledgments
在結束博士班生崖之際,首先要感謝指導教授陳三元博士與工研院鄭世裕博 士,當初是你們的鼓勵並帶領我走向博士班的研究之路,使我有機會在博士班生 崖裡繼續砌築知識之磚;同時,衷心感謝另外兩位指導教授台大凝態中心林麗瓊 博士與中研院原分所陳貴賢博士,給我無限的機會和支持,讓我在研究的道路上 可以盡情的發揮。除了感謝老師們讓我學習到正確作研究的方法與態度外,我也 從老師們身上學習到很多做人處事的道理,這些都是書本上沒有教的!如果沒有 你們的提攜與支持,我是不可能拿到博士學位的,謝謝你們! 此外,感謝台大AML 實驗室的夥伴:徐裕奎博士、韓謝忱博士、裕凱、盈竹、 逸帆、文勳、宜蓁、創年、昀紘和茹蘭,共享研究瓶頸之苦與休閒郊遊之樂;另 外,也感謝交大實驗室的學長姐與學弟妹在過去給予的幫忙和協助在此一併致 謝! 最後,我要感謝我的父母親,感謝他們多年來的茹苦養育與默默的支持付出, 謝謝!!Contents
中文摘要... I Abstract... II Acknowledgments ...IV Contents ...V Figure Captions... VII Table Captions... XII
Chapter 1 introduction ...1
Chapter 2 Literature Review ...7
2.1 Direct methanol fuel cell...7
2.1.1 Catalyst supported on carbon nanotube ...10
2.2 Methanol reforming ...11
2.3 Photoelectrochemical water splitting...15
2.3.1 PEC hydrogen generation based on nanomaterial photoelectrodes....18
Chapter 3 Experiment Methods ...28
3.1 Flowchart of experiment process ...28
3.2 Preparation of nanomaterials ...29
3.2.1 Synthesis of CNx NTs and Pt NPs deposition...29
3.2.2 Fabrication of ZnO NRs and metallic Cu NPs deposition...29
3.2.3 Synthesis of microwave-activated CuO NT/ZnO NR nanocomposites ...30
3.2.4 Preparation of O2 plasma-activated CuO-ZnO inverse opals ...31
3.2.5 Preparation of carbon-modified ZnO inverse opals...32
3.3 Experimental measurements and characteristics analysis...33
Chapter 4 Effects of Nitrogen-Doping on the Microstructure, Bonding and Electrochemical Activity of Carbon Nanotubes ...38
4.1 Introduction...38
4.2 Microstructure and Bonding of Nitrogen-Doped Carbon Nanotubes...39
4.3 Nitrogen-Doping Effect on Electrochemical Activity ...43
4.4 Summary...47
Chapter 5 Nanostructured ZnO Nanorod@Cu Nanoparticle as Catalyst for Microreformers ...56
5.1 Introduction...56
5.2 Structural Characterization of Cu Nanoparticle/ZnO Nanorod Nanocomposites...57
6.1 Introduction...75
6.2 Structural Characterization of CuO Nanotip/ZnO nanorod Nanocomposites76 6.3 Test of Methanol Reforming Reaction...79
6.4 Summary...82
Chapter 7 O2 Plasma-activated CuO-ZnO Inverse Opals as High-performance Methanol Microreformer ...89
7.1 Introduction...89
7.2 Structural Characterization of O2 Plasma-treated CuO-ZnO Inverse Opals..92
7.3 Test of Methanol Reforming Reaction...96
7.4 Summary...98
Chapter 8 Enhance Photocatalytic Activity with Carbon-Modified ZnO Inverse Opals for Solar Water-Splitting ...108
8.1 Introduction...108
8.2 Structural Characterization of Carbon-modified ZnO Inverse Opals ... 111
8.3 Test of Photoelectrochemical Reaction...113
8.4 Summary...115
Chapter 9 Conclusions...123
9.1 Effects of Nitrogen-Doping on the Microstructure, Bonding and Electrochemical Activity of Carbon Nanotubes ...123
9.2 Novel Copper-Zinc Oxide Nanoarchitectures as Microreformation Catalysts for Hydrogen Production ...123
9.3 Enhanced Photocatalytic Activity with Carbon-Modified ZnO Inverse Opals for Solar Water-Splitting ...124
References...126
Curriculum Vitae ...134
Figure Captions
Figure 2.1 Schematic operating principles of DMFC...21
Figure 2.2 Breakdown of anode, cathode, and electrolyte-related performance losses in a DMFC ...21
Figure 2.3 Schematic illustration of the synthesis procedure of the composite...22
Figure 2.4 TEM images of Pt/CNT (inset: enlarged image)...22
Figure 2.5 TEM images of 20 wt% PtRu/C nanocatalyst prepared with different molar ratios of Pt:Ru (a) LRTEM of 1:1, (b) HRTEM of 1:1 ...23
Figure 2.6 Typical TEM image of the CNT/PyPBI/Pt. Pt nanoparticles are loaded homogeneously on the PyPBI wrapped CNTs...23
Figure 2.7 Schematic diagram of the integrated methanol steam reformer system...24
Figure 2.8 Schematic of a typical PEC device and its basic operation mechanism for hydrogen generation from water splitting...25
Figure 2.9 Energy diagram of a PEC cell consisting of an n-type SC photoanode and a metal cathode for water splitting...25
Figure 2.10 Type of photoelectrode for PEC water splitting (SC-semiconductor; M-metal) ...26
Figure 2.11 (a) Schematic representation of the electron transport through spherical particles and nanorods. (b) A schematic of a Fe2O3 photoanode for water splitting. The small dismeter of the nanowires ensures a short hole diffusion length ...27
Figure 3.1 Schematic diagram of microwave-plasma enhanced chemical-vapor deposition (MPECVD) facility ...35
Figure 3.2 Schematic diagram of electrochemical deposition facility...35
Figure 3.3 ZnO array preparation ...36
Figure 3.4 Cu NP/ZnO NR nanocomposites preparation ...36
Figure 3.5 Cu NT/ZnO NR nanocomposites preparation ...37
Figure 3.6 Procedure for the preparation of CuO-ZnO inverse opals using polystyrene colloidal crystal templates...37
Figure 4.1 Cross-sectional SEM images of the vertically aligned CNTs synthesized at different flow rate of N2: (a) 0, (b) 80, and (c) 120 sccm ...49
Figure 4.2 (a) Comparison of the peak intensities and the full width at half maximum (FWHM) of the first-order Raman spectra for the vertically aligned CNx NTs prepared with different N2 flow rate during growth. (b) D-band
of the vertically aligned CNTs prepared with different N2 flow rate. (c) The
IP and IG as a function of the N2 flow rate for the N1s peak. (d) The
N-doping concentration as a function of the N2 flow rate ...51
Figure 4.4 (a) Cyclic voltammetry of the vertically well-aligned CNTs modified with different N-doping level in 1 M KCl and 5 mM K4Fe(CN)6. (b) The
ferricyanide peak current versus the scan rate (v)1/2 plot for CNTs using various flow rate of N2 for both anode and cathode. (★: 0 sccm, ■: 40
sccm, ●: 80 sccm, ◆: 120 sccm, ▲: 160 sccm) The inset shows the roughness factor as a function of the N2 flow rate. (c) The potential
separation as a function of the N2 flow rate...52
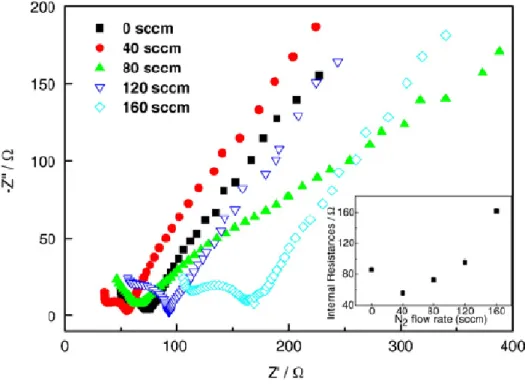
Figure 4.5 AC impedance analysis of the vertically aligned CNTs with different N-doping level in 1 M KCl and 5 mM K4Fe(CN)6. The inset shows the
internal resistance as a function of the N2 flow rate ...53
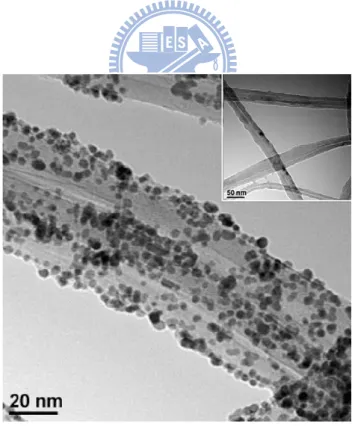
Figure 4.6 TEM images of the Pt NP-CNx NT hybrid nanostructures synthesized at different flow rate of N2: a) 0, b) 40, and c) 120 sccm ...54
Figure 4.7 Typical CV curve of the arryed Pt NP-CNx NT nanocomposites with different N2 flow rate at a scan rate of 50 mV/s in 1 M CH3OH + 1 M
H2SO4 solution...55
Figure 5.1 Schematic diagram of the novel catalyst ZnO NR@Cu NP arrays grown on the inner surface of microchannel reactor...66 Figure 5.2 Photographs of the microchannels a) before and b) after homogeneously
depositing the ZnO NR@Cu NP nanocomposites ...66 Figure 5.3 a) Cross-sectional SEM image of vertically well-aligned ZnO NRs. b)
Typical TEM image of a single ZnO NR showing the presence of stacking faults as marked with arrows. c) HRTEM image of the ZnO NR. d) Typical TEM image of the ZnO NR@Cu NP nanocomposites. e) HRTEM image of Cu NPs on the surface of one single ZnO NR. f) The size histogram of Cu NPs analyzed from the HRTEM image ...67 Figure 5.4 a) TEM image and corresponding EDX elemental mapping of b) Cu and c)
Zn ...68 Figure 5.5 HRTEM image of ZnO NR@Cu NP heterostructures ...69 Figure 5.6 a) XRD patterns of Cu NPs on the surface of ZnO NRs prepared with
different decoration concentrations from 1 to 3 mM. b) Cu 2p XPS core level spectra of arrayed ZnO NR@Cu NP nanocomposites prepared with different Cu decoration concentrations from 0.5 to 3 mM. c) Cu K-edge XANES spectra of arrayed ZnO NR@Cu NP nanocomposites and bulk
marked with ▲ are due to ZnO, the other marked with ■ is due to Cu ...71 Figure 5.8 First derivative of the Cu K-edge XANES spectra of arrayed ZnO NR@Cu
NP nanocomposites and bulk reference sample Cu foil ...72 Figure 5.9 a) Methanol reforming reaction profiles for 2 mM arrayed Cu NPs/ZnO
NRs nanocomposites (□) and commercial catalysts (●). b) Hydrogen production rate as a function of reaction temperature for 2 mM arrayed Cu NPs/ZnO NRs nanocomposites (□) and commercial catalysts (●). c) Kinetic constants as a function of reaction temperature for 2 mM arrayed Cu NPs/ZnO NRs nanocomposites (□) and commercial catalysts (●). d) Arrhenius plots for methanol reforming reaction for 2 mM arrayed Cu NPs/ZnO NRs nanocomposites (□) and commercial catalysts (●). Reaction conditions: H2O/O2/MeOH = 1/0.125/1, W/F = 21 kgcat s
mol-1methanol...73
Figure 5.10 Stability tests in methanol reforming reaction over 2 mM arrayed Cu NPs/ZnO NRs nanocomposites (□) and commercial catalysts (○). Reaction conditions: H2O/O2/MeOH = 1/0.125/1, Temperature = 250 oC,
W/F = 21 kgcat s mol-1methanol...74
Figure 6.1 (a) SEM images of CuO nanostructures (inset: high magnification). (b) SEM images of CuO NT/ZnO NR catalyst precusors (inset: high
magnification) ...83 Figure 6.2 HRTEM image of CuO nanodandelions, showing specific structural
information about an individual nanosheet grown along the [111] direction ...83 Figure 6.3 (a) TEM and (b) HRTEM images of CuO NT/ZnO NR catalyst precursors,
showing that NTs not only adhere to NR but also directly conjoin with the NR ...84 Figure 6.4 (a) X-ray diffraction, (b) micro-Raman, (c) X-ray photo-electron
spectroscopy, and (d) TPR spectra of the as-prepared, after thermal
treatment, and after MW treatment CuO NT/ZnO NR catalyst precursors85 Figure 6.5 HRTEM image of one single CuO NT, clearly showing a highly distorted
lattice (indicated by the circle) as a result of MW irradiation ...86 Figure 6.6 Methanol reforming reaction profiles : (a) Methanol conversion rate and (b)
hydrogen production rate for Cu NTs/ZnO NRs working catalysts : as-prepared (■), after thermal treatment (◆), and after MW treatment (▲). Reaction conditions: H2O/O2/MeOH = 1/0.125/1, W/F = 21 kgcat s
catalyst precursors with MW irradiation, MW-treated Cu NT/ZnO NR working catalysts, and MW-treated Cu NT/ZnO NR working catalysts after continuously operating 60 hours for MRR ...88 Figure 7.1 Schematic diagram of the novel catalyst CuO-ZnO inverse opals fabricated
on the inner surface of microchannel reactor...100 Figure 7.2 Procedure for the preparation of CuO-ZnO inverse opals using polystyrene
colloidal crystal templates...100 Figure 7.3 (a) SEM image and (b) HRTEM image of CuO-ZnO 3DOM
nanoarchitectures. (c) Micro- Raman spectra of CuO-ZnO inverse opals with different O2-plasma exposure durations ...101
Figure 7.4 N2 adsorption-desorption isotherm and pore-size distribution (inset) of
CuO-ZnO inverse opals without O2-plasma treatment ...102
Figure 7.5 (a) TEM image of CuO-ZnO inverse opals. Corresponding energy-filtered TEM (b) copper and (c) zinc mapping images of CuO-ZnO inverse opals ...103 Figure 7.6 Relative ratio of the integrated 575 cm-1 peak intensity to the sum of the
438 and 575 cm-1 peaks as a function of O2-plasma exposure time for
CuO-ZnO inverse opals ...104 Figure 7.7 XPS spectra of (A) O 1s, (B) Cu 2p, and (C) Zn 2p3/2 transitions for
CuO-ZnO 3DOM nanoarchitectures after O2-plasma treatment for (a) 0, (b)
3, (c) 5, (d) 10, and (e) 15 min, respectively...105 Figure 7.8 (a) Rates of Methanol conversion and H2 production for Cu-ZnO catalysts
with dense film, inverse opal, and O2-plasma treated inverse opal
nanostructure, respectively. (b) Stability tests of MRR with O2-plasma
treated Cu-ZnO inverse opal for plasma exposure time of 10 min (◇) and commercial catalysts (○). Reaction conditions: H2O/O2/MeOH =
1/0.125/1, Reaction temperature = 230 oC, W/F = 21 kgcat s mol-1methanol.
...106 Figure 7.9 Cu K-edge X-ray absorption near-edge spectroscopy (XANES) of
O2-plasma treated CuO-ZnO inverse opals and O2-plasma treated
CuO-ZnO inverse opals after H2 reduction. From XANES analysis, after
H2 reduction of O2-plasma treated CuO-ZnO inverse opals, all the CuO
will turn to metallic Cu ...106 Figure 7.10 SEM image of Cu-ZnO catalysts with non-inverse opal nanostructure .107 Figure 8.1 (a) SEM image and (b) HRTEM image of carbon-modified ZnO inverse
carbon-modified ZnO inverse opals. (d) Zn K-edge EXAFS spectra of carbon-modified ZnO inverse opals and pure ZnO structures...118 Figure 8.3 O K-edge XAS spectra of carbon-modified ZnO inverse opals and pure
ZnO structures...119 Figure 8.4 (a) Measured IPCE spectra of carbon-modified ZnO inverse opals in the
region of 300 to 800 nm at a potential of +0.25 V (vs. Pt) in two-electrode system. (b) Linear sweep voltammagrams, collected at a scan rate of 10 mV/s at applied potentials from -0.19 to +1.0 V (vs. Ag/AgCl) for carbon-modified ZnO inverse opals in the dark, ZnO noninverse-opal structures, and carbon-modified ZnO inverse opals at 100 mW/cm2. (c) Photoconversion efficiency of the PEC cell with carbon-modified ZnO inverse opal photoelectrode as a fuction of applied potential. (d) Amperometric I-t curves of the carbon-modified ZnO inverse opals
collected at a potential of +1.0 V (vs. Ag/AgCl) for 5 h...120 Figure 8.5 UV-vis spectra of carbon-modified ZnO inverse opals showing a slight red
shift of absorption wavelength to the visible region...121 Figure 8.6 Schematic diagram representing the charge-transfer process of the
Table Captions
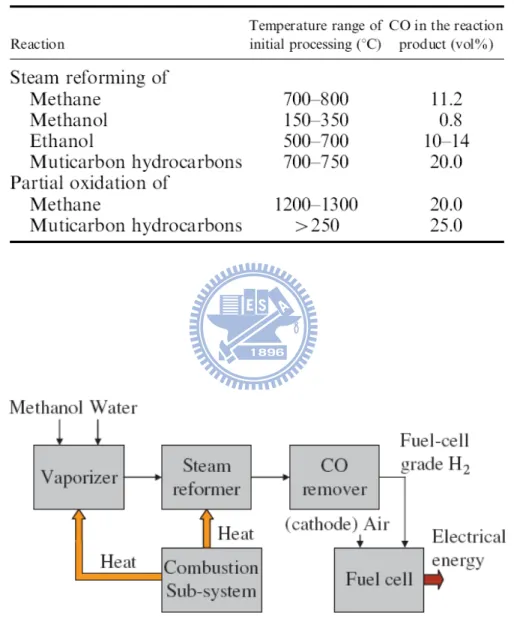
Table 2.1 Reactor temperature ranges for initial processing of different fuels and CO content of different process streams after the initial reaction ...24 Table 5.1 Microstructure properties of Cu NPs on the surface of ZnO NRs prepared
Chapter 1
Introduction
Global climate warming and environment pollution have stimulated scientists to develop new high-efficient and environmental-friendly energy technologies.[1] In recent years, fuel cell (FC) research and development have received much attention due to their higher energy conversion efficiency and lower or zero greenhouse gas emissions than thermal engines in the process of converting fuel into usable energies.[2] There are many different types of FCs, with the principle differences between them being the type of electrolyte and/or fuel that they use.[3] For instance, a proton exchange or polymer electrolyte membrane FC (PEMFC) and a direct methanol FC (DMFC) may have the same solid polymer electrolyte, but the DMFC uses liquid methanol for fuel whereas the PEMFC uses gaseous hydrogen. Among the various types of FCs, DMFC and PEMFC are being in the forefront stage, and have drawn a great deal of attention in both fundamental and application.
The use of methanol as energy carrier and its direct electrochemical (EC) oxidation in DMFCs represents an important challenge for the FC technology, since
side through the proton-exchange membrane, the poor kinetics of the anode reaction is one of the major issues in the development of DMFC. In order to achieve a sufficient reaction rate at low working temperature, the DMFC electrodes typically contain expensive noble metal catalysts, such as Pt. Quite a lot of promising approaches and results have been reported for the reduction of Pt loading through supporting tactics, such as high surface area carbon materials.[5] However, it is very difficult to maintain or improve catalyst layer performance when the loading of Pt catalyst is reduced. In order to achieve high catalytic performance of FCs with the low loading of Pt, great effort must be put on Pt utilization and the enhancement of catalyst activity. Of the several factors which influence electrocatalytic activity of carbon-supported Pt catalysts, particle size, dispersion, and structural effects, are of crucial importance.[4] The Pt-carbon support interaction has recently been paid more and more attention, e.g. the growth, the structure, and the dispersion of Pt particles on the carbon supports, thus providing the potential benefits to the improvement of catalytic properties and stability of the electrocatalyst.[5] In the past we have introduced heteroatom dopant such as nitrogen (N) in-situ during the carbon nanotube (CNT) growth and found it effective not only to change the atomic structure of the CNTs into bamboo like, but also to improve their EC performance
functionality is still not clearly understood.[8-10] Therefore, we first aims to understand the effect of N incorporation in CNTs on the morphology, microstructure, electronic states, and EC properties, which will be discussed in Chapter 4 in this thesis. Subsequent loading of Pt nanoparticles (NPs) on the CNx NTs to study the correlation of N doping with surface defect density and distribution has also been carried out.
On the other hand, PEMFCs are a suitable power generation device for small scale and transport applications.[11] Hydrogen is an ideal fuel for PEMFCs, because it is lightweight, has high chemical energy, and forms water upon oxidation that is environmentally benign. However, direct-hydrogen FC is almost impossible to develop, because storage and transportation of hydrogen remains a severe problem.[11] Therefore, it is of significance to develop onsite hydrogen-generation methods for portable applications. One of the promising ways to generate hydrogen onsite for practical use is reforming of hydrocarbon fuels, e.g. reforming of methanol with the aid of special catalysts.[11,12] Even though the purpose of the methanol reforming reaction is the production of hydrogen, there are another products formed that must be taken into consideration, e.g. CO2, and CO.
temperature FCs.[11] This highlights the importance of the catalyst performance in the reaction. Ideally, the catalyst should be highly active in order to achieve large amounts of hydrogen, highly selective CO2 so that the CO produced is negligible
and finally it should present long-term stability. Cu/ZnO-based catalysts are of great importance for industrial scale catalytic production of reformate hydrogen.[13] Owing to their wide commercial relevance, Cu/ZnO-based catalysts, prepared via several preparation routes, are being extensively investigated; and substantial improvements in their efficiency of catalytic activity brought about by addition of suitable promoter/support, combination with effective component, and implementation of new preparation techniques have been reported.[14-19] Unfortunately, use of nanostructured Cu/ZnO-based hybrids as reforming catalysts is still lacking to date. This thesis in Chapter 5, 6, and 7 will focus on the rational design of different nanoarchitectures, i.e. Cu NP/ZnO nanorod nanocomposites,
microwave-activated CuO nanotip/ZnO nanorod nanocomposites, and O2
plasma-activated CuO-ZnO inverse opals, with integrating direct synthesis of catalyst and its immobilization for achieving high efficiency of microreformer applications. In each section the strategies proposed to enhance the performance of the nanostructured catalysts are described.
as a side product. Hydrogen has to be produced from renewable and carbon-free resources using nature energies such as sunlight if one thinks of clean energy and environmental issues. Therefore, achievement of solar-hydrogen production from water has been urged.[20] Motivated by the idea of photosynthesis, hydrogen generation from water splitting (artificial photosynthesis) has attracted a lot of attention.[21] In this regard, a photoelectrochemical (PEC) cell consisting of semiconductor photoelectrodes that can harvest light and use this energy directly for splitting water is a more promising and cost-effective way for hydrogen generation. Among the various candidates for the photoelectrode, metal oxides are relatively inexpensive and have a better photochemical stability. [22-25] The efficiency of PEC devices has been limited by several key factors, such as the limited light absorption efficiency in the desired visible region and the recombination of photoexcited electrons and holes. The recent development of nanostructures opens up new opportunities in addressing these fundamental scientific issues. The primary reason is their unique physical and chemical properties compared to bulk materials as well as their potential applications in various technologies including energy conversion.[26] However, to the best of our knowledge, there has been no study to date regarding such inverse-opal nanostructure applied into PEC water splitting.
inverse opals modified by carbon in a non-sacrificial electrolyte. This development can potentially contribute to the application of PEC devices having good efficiency, visible-light harvesting, and long lifetimes. Finally, conclusions and future researches will be summarized.
Chapter 2
Literature Review
2.1 Direct methanol fuel cell
During operation, a direct methanol fuel cell (DMFC) oxidizes an aqueous methanol solution, forming CO2 gas and protons. It then releases the CO2 into the
anode structure. The protons that are generated at the anode pass through the solid polymer electrolyte membrane where they simultaneously combine with electrons and the oxidant (air or oxygen), which is reduce to water finally. The overall cell reaction in a DMFC leads to the production of CO2 and water, as shown in Figure
2.1. Normally, with high concentration of methanol it will provide higher power density. However, it also causes severe methanol crossover to the electrolyte membrane and results in mix potential at the cathode. Therefore, it will present low cell performance. By this reaction mechanism, methanol molecules will diffuse through the membrane and directly oxidized by oxygen on the cathode.
According to the literature, the goal of a maximum cell voltage or power density should be reached through employing methanol feed concentrations slightly below
anode compartment. Potential-lowering methanol crossover is already present at low concentrations and an increase in methanol permeation preferably leads to fuel losses via direct chemical oxidation. Questions about fuel utilization and methanol oxidation product distribution under these conditions have to be dealt with in order to optimize the overall system performance.[28]
The main disadvantage of the DMFC system is the relative low power density. Although the DMFC system relies on thermodynamically favorable reactions, in practice, both of the electrodes (anode and cathode) are kinetically due to the irreversible nature of the reactions. Therefore, both the anode and cathode suffer from similarly large overpotentials.[4] Methanol will be oxidized to CO2 at the
anode of a DMFC system, but the oxidation reaction proceeds through the formation of CO as an intermediate, which strongly adsorbs on the surface of a Pt catalyst. Therefore, a potential that is much more anodic than the thermodynamic value is needed to obtain a reasonable reaction rate.[27] In contrast to the PEMFC where it is mainly only the cathode that is kinetically hindered, both electrodes suffer from kinetic losses in the DMFC system.
In reality, the reactions are both highly activated, and hence poor electrode kinetics (kinetic looses) cause the electrode reactions to deviate from their ideal
limiting effects is presented, including kinetics, resistance, methanol crossover, and mass transport. In order to draw a current from the DMFC, a far more positive potential (overpotential) is required at the anode and a more negative potential (overpotential) at the cathode to accelerate the reactions to reasonable rate (i.e., to produce a cell current). These are shown in Figure 2.2 as the dark gray areas (kinetic losses), and their effect on the efficiency of the cell is interpreted as a reduction in the light gray area, which represents the observed voltage from the cell.[4]
As Figure 2.2 demonstrates, the anode and cathode overpotentials reduce the cell potential by approximately similar amounts. Together, they may be responsible for a loss of DMFC efficiency of approximately 50%.[29] A simple argument shows why the oxygen reduction reaction (ORR) is a highly activated process: each O2 molecule
requires the transfer of four electrons for complete reduction, and the simultaneous transfer of these electrons is highly unlikely. In fact, partial electron transfer takes place, leading to the formation of surface intermediates such as superoxide.
The application of a Pt electrocatalyst allows the stabilization of these intermediates and allows the reaction to proceed at a reasonable and useful rate. In addition, the catalyst may accelerate the reaction by opening up new reaction pathways. In the case of methanol electrooxidation at the DMFC anode, the picture
exists among experimental data; this may be due to the wide range of experimental conditions used in the studies.[4]
2.1.1 Catalyst supported on carbon nanotube
Novel carbon materials such as carbon nanotubes (CNTs) have been investigated as DMFC catalyst supports and enhanced catalytic performance has been demonstrated. However, difficulties involved in the preparation of CNT-supported catalysts diminish practical applications. Other nanostructured carbon materials such as carbon fibers and carbon nanohorns provided only minor improvements in electrocatalytic activity. Thermal treatment is a four step procedure that is an essential component of catalyst preparation (Figure 2.3).[30] Structure and morphology of Pt/CNT composites synthesized by thermal treatment were characterized by transmission electron microscopy and X-ray diffraction. As shown in Figure 2.4, Pt nanoparticles were highly dispersed and adhered to CNTs, yielding s structure that is similar to a Pt-Ru/C nanocatalyst (Figure 2.5).[31] Fujigaya et al. proved that catalyst reconstruction and distribution could be achieved with the use of CNT as a support (Figure 2.6).[32] Additionally, catalyst agglomeration could be avoided with the addition of polybenzimidazole. Prabhuram et al. synthesized Pt-Ru nanoparticles on CNTs by a simple reduction method using sodium borohydride as
was strongly dependent on the amount of RuO2 in the catalyst.[5] A Pt-RuO2/CNTs
catalyst with 15% Pt and 9.5% RuO2 exhibited superior electrocatalytic activity for
methanol oxidation. A change in specific capacitance of RuO2/CNTs, determined by
the degree of proton conductivity and electron transfer, caused an increase in electrocatalytic activity of Pt-RuO2/CNTs. An electrocatalyst based on capacitance
may be useful in the design of novel catalysts for DMFC.
Hollow Pt-Co nanosphere electrocatalysts supported on CNTs were prepared at room temperature in a homogeneous solution, with Co metal nanoparticles as sacrificial templates.[5] Hollow Pt-Co/CNTs electrocatalysts displayed enhanced electrocatalytic activity for methanol oxidation compared to CNT-supported solid Pt-Co nanoparticles and commercial E-TEK PT/C (20 wt% Pt) catalysts. The incomplete and porous shell of Pt-Co hollow nanospheres provides an ideal surface structure with high surface area, exhibiting enhanced electrocatalytic activity. This approach was successfully extended to the fabrication of Au, Pd, and bimetallic hollow nanospheres.
2.2 Methanol reforming
Hydrocarbon fuels have very high hydrogen contents, e.g. methane (CH4) has
and diesel.[35] There are three ways to transform hydrocarbons into hydrogen, i.e. (i) direct decomposition, (ii) partial oxidation, and (iii) steam reforming.[11] The direct decomposition and partial oxidation of hydrocarbons require an elevated temperature and, at the same time, they produce a considerable amount of CO as a product or a byproduct (Table 2.1).[11] In a hydrogen FC, even a trace of CO can deteriorate the Pt electrode, e.g. on introducing 20 ppm CO into the polymer electrolyte membrane FC (PEMFC), the current density decreases to about 18% within 210h. In comparison with other impurities, the poisoning effect of CO is found to exert the largest impact on FC performance.
Steam reforming of hydrocarbons produces a lower CO content relative to the direct decomposition and partial oxidation of hydrocarbons, as listed in Table 2.1; hence, of the above three methods, steam reforming is a promising method to generate hydrogen for automobile and portable applications.[11] As the reforming of methanol requires a low temperature and produces one order of magnitude less CO than the other hydrocarbons (0.8% vs 10%-20%; see Table 2.1), it has attracted considerable attention in the past few decades in this research field.[35] In fact, the U.S. army is focusing on the development of the technology of reforming methanol to generate hydrogen for portable PEMFCs, which are used as energy source for
battlefield.[36]
In the following, the reforming of methanol is specifically introduced. Methanol is a single chemical compound (CH3OH) and commercially is primarily formed from
natural gas through a syngas route. It is a liquid under ambient conditions and has a low boiling point of 65℃, which allows for facile vaporization in roughly the same temperature range as that for water. For the typical range of operation in methanol reforming (45-60 wt% methanol), the freezing point of the fuel mixture ranges from -44 to -74℃, a distinct advantage for cold-weather development of methanol-fueled systems. However, the high toxicity of methanol may pose a problem for large-scale applications. Unlike gasoline or diesel, methanol does not cause vomiting when ingested. This means that any ingestion that is not deal with quickly will result in the formic-acid metabolism route internally.[35]
Methanol reacts with steam in the presence of Cu-based catalysts, e.g. Cu/ZnO/Al2O3, at temperatures higher than 150℃ to form a hydrogen-rich gas.[13]
The main products are H2, CO2, and CO. The formation of methane is
thermodynamically favored, but Cu-based catalysts usually do not promote the formation of this byproduct. The methanol steam reforming process involves the following reactions:[11]
CO + H2O→CO2 + H2, △H0298 = -41.1 kJ/mol (3)
Equation (1) generates 12 wt% hydrogen, which is the algebraic summation of Eqs. (2) and (3). Equation (2) represents methanol decomposition. Equation (3) represents a water-gas shift (WGS) reaction, which is an important process to reduce CO content in the reformate gas. The steam reforming reaction is endothermic, and an external heat supply is required to maintain the reaction. Steam reforming of methanol over Cu-based catalysts was originally thought to have involved the above process, i.e. methanol decomposition, followed by WGS. However, in recent years, this is considerable evidence to suggest another pathway including a methyl formate intermediate.[35] At the same time, the mechanism for the formation of the CO byproduct is a controversial topic. Even so, it is generally observed that CO can be minimized by decreasing the contact time, increasing the steam to carbon ratio to facilitate the WGS reaction, and decreasing the temperature, which acts to suppress CO thermodynamically.[35] But the increase of the steam to carbon ratio requires more heating for vaporizing the additional water in the feed.[11]
As the CO tolerance of PEMFCs is about 10-20 ppm at the normal working temperature of 80℃ in portable applications, further processing is needed to remove the small amount of CO (~0.8 vol%) from the reformate gas of methanol.[37]
selective CO methanation.[35] Figure 2.7 displays a schematic representation of the integrated methanol steam reformer system, which shows the main steps and components of steam reforming of methanol to generate hydrogen for portable applications.[11,38]
Compared with DMFC, steam reforming of methanol does not have the methanol crossover and the high catalyst usage problems. Current DMFCs typically use a Pt alloy at a loading of 2-8 mg/cm2 on the anode, which is much higher than 0.2-0.3
mg/cm2 used for both the anode and cathode in PEMFCs.[35] The drawback of
steam reforming of methanol is its thermal management, because the reactor works at temperature above 150℃ and sometimes up to 300℃. For portable FCs, the device not only needs to be well insulated to eliminate hot surface but also the exhaust needs to be cooled sufficiently so that it does not burn anyone.[35] As external heat is required for steam reforming (Figure 2.7), recently an autothermal-reforming technology was developed, which is a combination of partial oxidation and steam reforming processes.[35] In this technology, methanol reacts with a mixture of steam and oxygen, and the partial oxidation and steam reforming are carried out simultaneously, where the exothermic oxidation supplies the energy for the endothermic reforming.
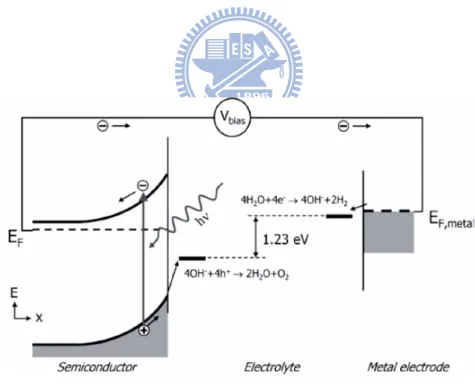
energy into chemical energy that can be stored in molecules, such as hydrogen, through electrochemical reactions, e.g. water splitting. The generation of hydrogen from PEC water splitting was first demonstrated in 1972 by Honda and Fujishima.[23] Besides electrolytes, the key components in a PEC cell are the electrodes (cathode and anode) on which redox chemical reactions involving electron transfer take place; at least one electrode should be a semiconductor (SC). Figure 2.8 shows a simple schematic of a typical PEC device. A conventional PEC cell is established with a SC photoanode and a Pt electrode as the cathode in the electrolyte solution. Under irradiation with the photon energy equal to or exceeding the band-gap energy of the SC photoanode, the electrons are excited and promoted from the valence band to the unoccupied conduction band. n-type SCs are preferred for the photoanode, and the depletion layer formed at the n-type SC-electrolyte interface will lead to energy-band bending as shown in Figure 2.9, which facilitates the separation of photogenerated electrons and holes. The electrons transport to the cathode and react with photons to generate hydrogen, while the holes accumulate on the surface of the photoanode and react with water molecules to produce oxygen. In the presence of sacrificial hole scavengers such as alcohols in the electrolyte solution, the photoexcited holes can oxidize these reducing reagents without
To achieve efficient splitting of water, the SC photoanode should meet the following criteria: (i) photochemically stable with good corrosion resistance in aqueous solution; (ii) with a conduction band edge more negative than hydrogen evolution potential and a valence band edge more positive than the oxygen evolution potential; (iii) strong absorption in the solar spectrum region; (iv) high-quality material with low density of defects for efficient charge transfer and reduction of the electron-hole recombination; and (v) low cost.[41-43] Unfortunately, to date, there is no such material that can meet all the requirements simultaneously. Among the various candidates for the photoelectrode, SC metal oxides are relatively inexpensive and have a better photochemical stability. Many metal oxides have been extensively studied and considerable progress has been made in recent years.[26] For a PEC cell, the conduction band of most metal oxide material is less negative than the hydrogen evolution potential; thus, a small external potential needs to be applied to facilitate the PEC reactions.
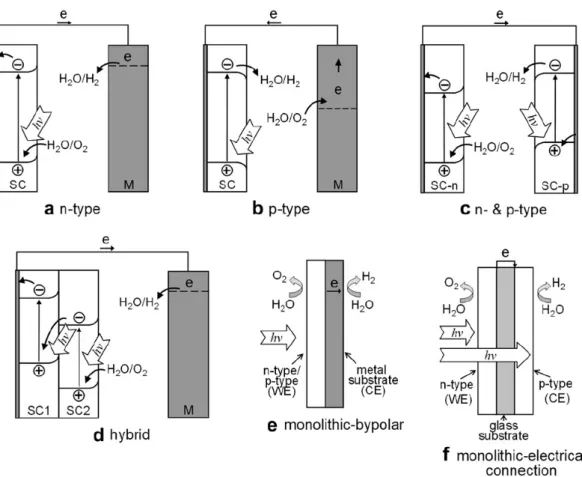
The SCs for PEC water splitting can be generally classified as metal oxide and conventional photovoltaic (PV) material. The SC photoelectrode can be n-type (Figure 2.10a), p-type (Figure 2.10b) or coupling of n-type and p-type (Figure 2.10c). This can be a single photosystem as in the n-type (TiO2) or p-type (InP), but for the
solar spectrum or several p-types can also be done the same way (Figure 2.10d). When involving more than one photosystem, it is important to match the currents generated by the different layers to obtain better efficiency and this is achieved by aligning complimentary band gaps and controlling the thickness or active area.[21] In PEC water splitting, metal oxide and conventional PV material or their combination are used. The anode and cathode are usually physically separated, but can be combined into a monolithic structure either using a metal structure by depositing the anode on one side and cathode on the other and sealing the edges (Figure 2.10e) or stacking the anode on its own substrate with the cathode on its own substrate and providing an electrical connection between the two (Figure 2.10f).[21]
2.3.1 PEC hydrogen generation based on nanomaterial
photoelectrodes
The use of nanomaterial-based PEC for water splitting dates back to 1997. Fitzmaurice and coworkers reported the studies of charge separation in a nanostructured TiO2 membrane sensitized with Ru complexes.[44] The long-lived
charge separation observed was an important finding that suggests that water splitting is practically feasible on nanostructured TiO2 material. In the following few
photoanodes are stable for water splitting. Significantly, the nanocrystalline n-Fe2O3
films showed higher photoresponse compared to those prepared by compression of n-Fe2O3 powder or by thermal oxidation of metallic Fe sheets, indicating that
high-quality nanostructured materials could improve the overall efficiency of the water splitting reaction. Since then, the PEC performance of different nanocrystalline metal oxide films has been studied.[26]
Besides 0D nanostructures, 1D nanostructures, such as nanotubes, nanowires, and nanorods, are expected to exhibit much improved transport properties than nanoparticles. The first demonstration of PEC water splitting using 1D nanostructure as photoelectrodes was reported by Lindquist and coworkers in 2000.[47,48] They reported the photoelectrochemistry of hematite nanorod arrays for the photoanode. It is generally accepted that recombination of electrons and holes, trapping of electrons by oxygen deficiency sites, and low mobility of the holes cause the low photoresponse for hematite films. In comparison to nanoparticles, nanorods improve the transportation of carriers and thus reduce the recombination losses at grain boundaries, as illustrated in Figure 2.11a. Moreover, the small diameter of the nanorods minimizes the distance for holes to diffuse to the SC/electrolyte interface, as shown in Figure 2.11b. Ideally, when the nanorod radius is smaller than the hole
well beyond the efficiencies reported for polycrystalline and nanocrystalline films of hematite. This work demonstrated that nanorod arrays could potentially address some of the fundamental PEC issues and increase the photon-to-current yield of hematite.
Figure 2.1 Schematic operating principles of DMFC.[27]
Figure 2.2 Breakdown of anode, cathode, and electrolyte-related performance losses in a DMFC.[29]
Figure 2.3 Schematic illustration of the synthesis procedure of the composite.[30]
Figure 2.5 TEM images of 20 wt% PtRu/C nanocatalyst prepared with different molar ratios of Pt:Ru (a) LRTEM of 1:1, (b) HRTEM of 1:1.[31]
Table 2.1 Reactor temperature ranges for initial processing of different fuels and CO content of different process streams after the initial reaction.[11]
Figure 2.7 Schematic diagram of the integrated methanol steam reformer system.[11,38]
Figure 2.8 Schematic of a typical PEC device and its basic operation mechanism for hydrogen generation from water splitting.[40]
Figure 2.9 Energy diagram of a PEC cell consisting of an n-type SC photoanode and a metal cathode for water splitting.[40]
Figure 2.10 Type of photoelectrode for PEC water splitting (SC-semiconductor; M-metal).[21]
Figure 2.11 (a) Schematic representation of the electron transport through spherical particles and nanorods. (b) A schematic of a Fe2O3 photoanode for water
splitting. The small dismeter of the nanowires ensures a short hole diffusion length.[40,48]
1D & 3D nanoarchitectures
Carbon nanotube ZnO nanorod ZnO-CuO
inverse opal ZnO inverse opal Doping of nitrogen Decoration of platinum Methanol oxidation reaction Decoration of Cu nanoparticle Decoration of CuO nanotip Microwave treatment O2plasma treatment
Methanol reforming reaction
incorporation of carbon Photoelectrochemical reaction X R D, XAS SEM, TE M XPS, Ra m an TPR , N 2O ti trat ion E le ctr oc he m ic al me asure m en t 1D & 3D nanoarchitectures
Carbon nanotube ZnO nanorod ZnO-CuO
inverse opal ZnO inverse opal Doping of nitrogen Decoration of platinum Methanol oxidation reaction Decoration of Cu nanoparticle Decoration of CuO nanotip Microwave treatment O2plasma treatment
Methanol reforming reaction
incorporation of carbon Photoelectrochemical reaction X R D, XAS SEM, TE M XPS, Ra m an TPR , N 2O ti trat ion E le ctr oc he m ic al me asure m en t
Chapter 3
Experiment Methods
3.2 Preparation of nanomaterials
3.2.1 Synthesis of CN
xNTs and Pt NPs deposition
For the synthesis of the CNx NTs, an iron catalyst layer was deposited on Ti/Si
substrates by ion beam sputtering prior to the NT growth step. Then CNx NTs were
grown on the precoated substrates by MPECVD method (Figure 3.1), which has been reported in our previous paper.[7] For Pt NPs deposition, a potential of -0.1 V vs Ag/AgCl in 0.5M H2SO4 & 0.0025M H2PtCl6 mixture solutions was performed
for 15 sec as shown in Figure 3.2. Other details for the electrochemical deposition process are reported by Quinn and co-workers.[65]
3.2.2 Fabrication of ZnO NRs and metallic Cu NPs deposition
For ZnO array preparation, a thin film of ZnO was first deposited on the inner surface of microchannels prior to the NR growth step by solution method, which acted as a seed layer. This was followed by growth of aligned ZnO NRs on the precoated substrates by chemical bath deposition (CBD) method. The CBD growth was performed using equimolecular mixtures of zinc nitrate hexahydrate (99.5 %, Aldrich) and hexamethylenetetramine (99 %, Aldrich) as source precursors and a reaction temperature of 90 oC for 7 h (Figure 3.3). Other details of the NR array
precursor salts (copper nitrate trihydrate, 99.5 %, Aldrich) that were subsequently reduced (Figure 3.4). This reducing step is the boiling under reflux, which leads to Cu/Cu+ colloids. The synthesis of size-selected Cu NPs immobilized on ZnO NRs
was carried out in ethylene glycol (EG; as reducing agent) solutions containing different amounts of sodium hydroxide (0.5 M NaOH in EG) with pH value between 9 and 11.[85] The decoration concentrations were controlled between 0.5 and 3 mM. The solutions were stirred for 30 min at room temperature, subsequently heated under reflux to 190 ℃ for 2 h, and then cooled in air. Dark brown solutions containing Cu NPs were formed in this manner, referred to as colloidal solutions in this work.
3.2.3 Synthesis of microwave-activated CuO NT/ZnO NR
nanocomposites
For synthesis of ZnO nanorods inside the microchannels, chemical bath deposition growth was performed using the equimolecular mixtures of zinc nitrate hexahydrate (99.5 %, Aldrich) and hexamethylenetetramine (99 %, Aldrich) as source precursors, at a reaction temperature of 90 oC for 7 h. Other details for the NR array growth
process were similar to the procedure proposed by Vayssieres.[84] Typically, the one-step direct impregnation method involved impregnation of ZnO
mixing Cu(NO3)2‧3H2O (99.5 %, Aldrich) in deionized water (18.2 MΩ).
Cu(NH3)42+ complex cations were prepared by adding a concentrated ammonia
solution (28-30 wt %) dropwise into the above aqueous solution until the pH value reached 11 under vigorous stirring. The resulting homogeneous solutions were then gently heated in an oven at 90 oC for over 2 h. Finally, CuO nanotip/ZnO nanorod
nanoarchitectures on the inner surface of microchannels were formed.
The as-derived CuO nanotip/ZnO nanorod catalyst precursors were processed in a microwave oven (2.45 GHz; TMO-17MA; TATUNG CO., Ltd.; Taiwan) for 10 min to obtain the final microwave-irradiated CuO nanotip/ZnO nanorod catalyst precursors. The microwave chamber was 452 mm in length, 262 mm in width, and 325 mm in height. During the microwave irradiation, the substrate temperature, environmental atmosphere and microwave power were maintained at room temperature, air and 600 W, respectively. For comparison, the as-derived CuO nanotip/ZnO nanorod catalyst precursors were also treated in a conventional annealing furnace at 450 oC for 1 h to obtain the conventional thermal-treated CuO
nanotip/ZnO nanorod catalyst precursors
3.2.4 Preparation of O
2plasma-activated CuO-ZnO inverse opals
well-defined structures were formed inside the microchannels. These PS particle-packed microchannels were heated at 90 ℃ for 3-6 h in order to improve the connectivity between the neighboring particles. The copper-zinc precursor solution containing 0.5 M Cu(NO3)2‧3H2O (99.5%, Aldrich) and 0.5 M Zn(NO3)2‧
6H2O (98%, Aldrich) in ethanol was then applied dropwise over the surface of the
PS layer. These infiltrated samples were then placed in air at room temperature for 2-4 h. Finally, the resulting CuZnO/PS composites were heated in air to 300 ℃ to obtain the CuO-ZnO inverse opals (Figure 3.6).
These pristine CuO-ZnO inverse opals were then exposed to O2 plasma for a short
duration of 3-15 min to obtain O2-plasma treated CuO-ZnO inverse opals. The
process of plasma-chemical surface modification was performed in a parallel-plate reactor with a DC flowing discharge (PCD-150; ALL REAL TECHNOLOGY CO., Ltd.; Taiwan). The distance between ground electrode and powered electrode was about 6 cm. The plasma chamber was 250 mm in diameter and 140 mm in height. The electrode was in the form of disk with around 6 inch in size. For the O2 plasma
treatment, the substrate temperature, total gas pressure and DC power were maintained at room temperature, 200 mTorr and 50 W, respectively.
After room temperature evaporation of water from the suspension, PS opals with well-defined structures were formed on the ITO substrate. These PS particle-packed templates were heated at 90 ℃ for 3-6 h in order to improve the connectivity between the neighboring particles. The zinc precursor solution containing 0.5 M Zn(NO3)2‧6H2O (98%, Aldrich) in ethanol was then applied dropwise over the
surface of the PS layer. These infiltrated samples were then placed in air at room temperature for 2-4 h. Finally, the resulting ZnO/PS composites were heated in air to 300 ℃ to obtain the carbon-modified ZnO inverse opals. For comparison, the ZnO noninverse opals could be prepared by the same fabrication procedure only without using PS particle-packed templates.
3.3 Experimental measurements and characteristics analysis
For methanol reforming reaction, the Al-alloy (6061) chip of the microreactor was made by ourselves through a laser machining method. Ten microchannels per Al-alloy chip were separated by 800 μm fins. The width, depth and length of the microchannels were 500μm, 200μm and 4.3 cm, respectively. For the calculation of the catalyst weight for the steam reforming reactions, we measure the total weight by precision electronic balance (± 0.1 mg; Sartorius). After reduction of catalysts in a H2/N2 (5/95) at a flow rate of 50 mL min-1 at 200 ℃ for 1 hr, premixed water,
gas streams were analyzed online with a thermal-conductivity-detector gas chromatograph (TCD-GC; China Chromatography CO., LTD.) and CO detector (Gastech CO., Ltd.; GTF200).
For photoelectrochemical measurement, a water-splitting photoelectrode was used as the working electrode with surface area of 0.5-1 cm2, a platinum plate as counter
electrode, and Ag/AgCl as reference electrode. All PEC studies were operated in a
1M Na2SO4 (pH7.0) solution as supporting electrolyte medium by using
Electrochemical Multichannel Solartron Analytical System. The water-splitting photoelectrode was illuminated with a xenon lamp equipped with filters to simulate the AM1.5 spectrum.
For material characterization, XRD analyses were performed on a Bruker D8 Advance diffractometer with Cu (40 kV, 40 mA) radiation. SEM measurements were made on a JEOL 6700 filed-emission SEM. XPS spectra were obtained using a Microlab 350 system. For obtaining TEM images, the products on the substrate were scratched and dispersed on a carbon-coated Cu grid, and analyzed using a JEOL JEM-2100 TEM system. Micro-Raman analyses were performed on a Jobin Yivon Labram HR800 spectrometer. XAS analyses were performed on a beamline BL17C1 and BL20A1 at the National Synchrotron Radiation Research Center (NSRRC),
Cooling lines
Dummy Load
A-5000 Microwave power source
Mechanical
Pump
Gas
inlet
PlasmaDeposition
chamber
Tune
Stage controller
Working
electrode
A
V
Ag/AgCl
reference
electrode
Pt
Working
electrode
A
A
V
V
Ag/AgCl
reference
electrode
Pt
Figure 3.1 Schematic diagram of microwave-plasma enhanced chemical-vapor deposition (MPECVD) facility.
Zn2+
HMT Heating by oven
Arrayed
Arrayed ZnOZnONRsNRs
9Concentration 9Temperature 9Time Zn2+ HMT Heating by oven Arrayed
Arrayed ZnOZnONRsNRs
9Concentration 9Temperature 9Time Heating by furnace Cu2+ NaOH Ethylene Glycol
Cu NPs/
Cu NPs/
ZnO
ZnO
NRs
NRs
9pH Value9Temp. Ramp Rate
Heating by furnace Cu2+ NaOH Ethylene Glycol
Cu NPs/
Cu NPs/
ZnO
ZnO
NRs
NRs
9pH Value9Temp. Ramp Rate Figure 3.3 ZnO array preparation.
Cu2+ NH4+
OH
-CuO NTs/ZnO NRs hybrids
Cu2+ + 4NH
3 → Cu(NH3)42+
Cu(NH3)42+ + 2OH- → Cu(OH)
2 + 4NH3
Cu(OH)2 → CuO +H2O
Cu2+ NH4+
OH
-CuO NTs/ZnO NRs hybrids
Cu2+ + 4NH
3 → Cu(NH3)42+
Cu(NH3)42+ + 2OH- → Cu(OH)
2 + 4NH3 Cu(OH)2 → CuO +H2O Closed-packing PS colloidal crystal Precursor infiltration removalPS 3DOM structure Cu2+ Zn2+ Closed-packing PS colloidal crystal Precursor infiltration removalPS 3DOM structure Cu2+ Zn2+
Figure 3.5 Cu NT/ZnO NR nanocomposites preparation.
Figure 3.6 Procedure for the preparation of CuO-ZnO inverse opals using polystyrene colloidal crystal templates.
Chapter 4
Effects of Nitrogen-Doping on the Microstructure, Bonding
and Electrochemical Activity of Carbon Nanotubes
4.1 Introduction
Carbon nanoscience and nanotechnology have been developed very rapidly over the past decade since the discovery of carbon nanotubes (CNTs). Miniaturization of electronic and electrochemical (EC) devices using the single-walled CNTs has been demonstrated.[49-51] Meanwhile, the remarkable structure of CNTs offers attractive scaffolds for further anchoring of nanoparticles (NPs) and biomolecules, which is highly desirable for energy conversion/storage and molecular sensing applications.[6,52-62] For these applications, surface modification of the CNTs or attaching functional groups on the sidewall become a key issue. In particular, surface modification offers an opportunity to improve the EC reactivity of CNTs through facilitating an efficient route for their electron-transfer (ET) kinetics with ambient species or specific biomolecules. Therefore, understanding the ET behavior between the CNT surface structures and the active entities are essential.
effectively functionalize CNTs surface.[63,64] Despite that many solutions to modify CNTs are available, simple and reliable process to achieve such goal is still lacking. In the past we have introduced heteroatom dopant such as nitrogen (N)
in-situ during the CNT growth and found it effective not only to change the atomic
structure of the CNTs into bamboo like,[7] but also to improve their electrochemical (EC) performance down the road.[6] Although many reports on nitrogen doped carbon nanotubes (CNx NTs) are available in the literature,[7-10] the role of N-doping in carbon nanotube and its resultant functionality is still not clearly understood.
In this paper, systematic studies on the effect of N incorporation in CNTs on the morphology, microstructures, electronic states, and electrochemical properties have been carried out. CNx NTs with different nitrogen content have been produced using a simple in-situ nitrogen doping in a microwave plasma enhanced chemical vapor deposition (MPECVD) reactor.[7] Comparative studies to correlate the nitrogen content, microstructure, electronic structure, and EC performance of the CNx NTs have been carried out. Subsequent loading of Pt NPs on the CNx NTs to study the correlation of N dpoing with surface defect density and distribution has been carried out.
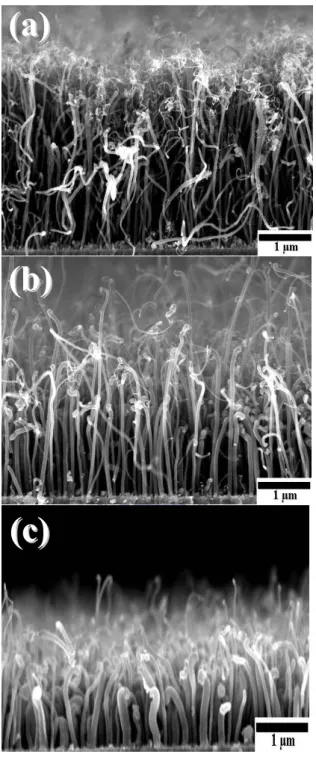
Figure 4.1 shows the cross-sectional scanning electron microscopy (SEM) images of the vertically aligned CNTs synthesized using different flow rate of N2 gas but
otherwise identical growth parameters. The diameters of the CNTs thus produced are in the range of 20-50 nm with an approximate length of 2-4 μm. Bamboo-like structure of the CNx NTs is observed, as reported in our previous paper.[7] However,
as the N2 gas flow is higher than 80 sccm the average diameter of the CNTs goes
beyond 100 nm with a reduced length of 1-2 μm. This may be attributed to the higher growth temperature at higher N2 flow rate, which is deviated from the
nominal growth condition.
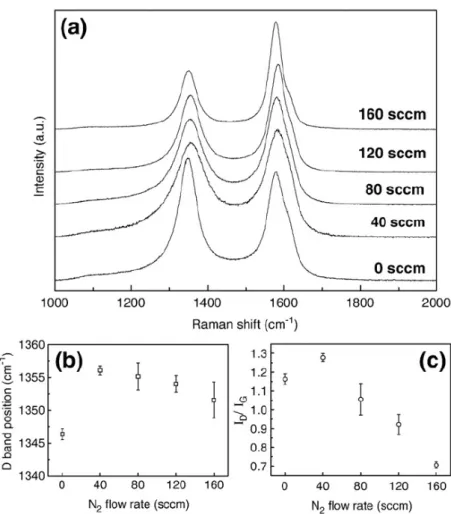
The Raman spectra of the CNx NTs prepared under different nitrogen flow rate are presented in Figure 4.2. The 1350 cm-1 peak (D band) in Figure 4.2(a) corresponds
to the disorder-induced feature due to the finite particle size effect or lattice distortion, while the 1580 cm-1 peak (G band) corresponds to the in-plane stretching
vibration mode E2g of single crystal graphite.[66] A D′ band around 1620 cm-1 at the
shoulder of the G band is attributed to the symmetry breaking duo to the microscopic sp2 crystallite size.[67] The D-band position and the ratio of the D- and
G-band integrated intensities as a function of N2 flow rate are depicted in Figure
dependence on the N2 flow rate. Interestingly, the intensity ratio I(D)/I(G) increases
strongly as the N2 flow rate is increased to 40 sccm and also decreases above the 40
sccm optimal flow rate. In principle, the I(D) increases rapidly as a result of the enhanced defect density. Therefore, the up-shift of the D band and the increase in the ratio of the integrated intensities can be attributed to the increase of defect density in the graphitic structure and/or the enhancement of the edge plane by N-induced deformation in CNx NTs. However, further increase of N2 flow rate over 40 sccm
leads to a higher growth temperature and results in enhanced graphitization degree. The growth temperature determined by pyroelectric thermal detector is 420, 450, and 750 oC at the N
2 flow rate of 0, 40, 160 sccm, respectively.
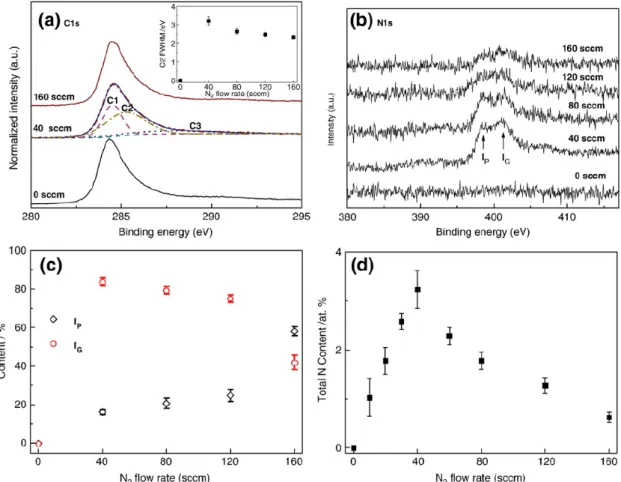
In order to obtain better understanding on the electronic structures of the CNx NTs, X-ray photoemission spectroscopy (XPS) is applied to samples grown using different N2 flow rates. Figure 4.3(a) shows the C 1s spectra of the CNx NTs after
background subtraction using Shirley’s method.[68] The C 1s spectra thus obtained can be decomposed into three Gaussian peaks including C1 peak at 284.4±0.1 eV representing the delocalized sp2-hybridized carbon or graphite-like C-C bonding,[69]
C2 peak at 285.1±0.1 eV reflecting defect-containing sp2-hybridized carbon
peak position shows a slight up-shift from 0 to 40 sccm optimal N2 flow rate
followed by a down-shift at higher flow rate. This result is in agreement with the variation in the degree of structural disorder, which is associated with the electron density of the defect-containing sp2-hybridized carbon and reflected in the FWHM
of the C2 peak as illustrated in the inset of Figure 4.3(a). The C2 FWHM reaches a maximum value at 40 sccm manifesting that the most pronounced disruption in the sp2 carbon framework due to the incorporation of N atoms into the graphene lattice
occurs at a N2 flow rate of 40 sccm.
Likewise, the N 1s XPS spectra of the CNx NTs with increasing N2 flow rate are
fitted by two Gaussian lines as shown in Figure 4.3(b). The peaks at 398.1±0.2 eV (denoted by IP) and 400.8±0.2 eV (IG) are assigned to tetrahedral nitrogen bonded to
a sp3-hybridized carbon (so-called substitutional pyridine-like dopant structure) and
trigonal nitrogen bonded to a sp2-coordinated carbon (so-called substitutional
graphite-like dopant structure), respectively.[69] Figure 4.3(c) displays the fraction of pyridine-like and graphite-like defects as a function of the N2 flow rate.
Increasing N2 flow rate is shown to give rise to an increase of the peak intensity
ratios of the N-sp3 C bonding (I
P), which is strongly related to graphene sheets.
graphene planes through the sp3-coordinated carbons. Meanwhile, the peak intensity
ratios of the N-sp2 C bonding decreases slightly over 40 sccm nominal N
2 flow rate.
In general, N-doping is shown to lower the energy of pentagon defects in the graphite-like dopant structures. Thus, through the N-sp2 C bonding, N atoms are
easily incorporated in the graphene sheets. The total N-doping levels for the peak ratio of N/(N + C) are plotted against the respective N2 flow rate in Figure 4.3(d).
The CNx NTs with N2 flow rate of 40 sccm contain maximum N atomic ratio.
4.3 Nitrogen-Doping Effect on Electrochemical Activity
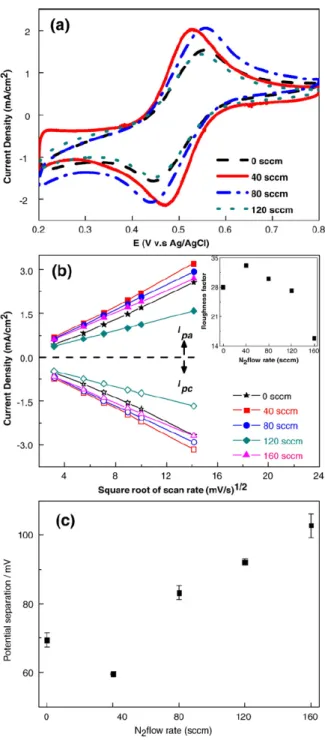
The ET behavior of CNx NTs are explored using a potassium ferrocyanide redox
probe (5 mM K4Fe(CN)6 in 1M KCl). A typical CV curve of CNx NTs
microelectrode in this redox couple system is shown in Figure 4.4(a). The well-defined peaks obtained in the forward and reverse scans are due to the Fe3+/Fe2+ redox couple. The reversible redox reaction of the CN
x NT
microelectrodes is further evidenced by the linear Ipa and Ipc vs υ1/2 plots shown in
Figure 4.4(b), where Ipa、Ipc and υ are the corresponding peak current densities of the
cathodic and anodic reactions and the scan rate, respectively. These data indicate that the whole reactions are limited by semi-infinite linear diffusion of the reactants to the electrode surface. Moreover, the effective surface area of CNx NT arrays can
CNx NTs surface to the geometrical electrode surface area, as a function of N2 flow
rate is depicted in the inset of Figure 4.4(b). It is noted that the roughness factor of CNx NT microelectrode prepared with N2 flow rate of 40 sccm is ~33, showing
significant enhancement in the effective surface area. Clearly, the N-doping induced electrochemically active sites on the surface of CNx NT microelectrodes prepared
with N2 flow rate of 40 sccm are optimized.
The peak-to-peak separation ( Ep△ ) of potassium ferrocyanide redox probe is strongly dependent on the ET rate, namely, the reactivity of electrode materials to the electrolyte. In Figure 4.4(c), Ep△ of CNx NTs with N2 flow rate of 40 sccm is
around 59 mV, reflecting excellent ET reactions. This is also related to the reduced internal resistance of the CNx NT structures, which was determined by EC
impedance (EIS) in 1M KCl solution containing 5 mM K4Fe(CN)6 at an AC
frequency varying from 0.1 to 100 kHz as shown in Figure 4.5. From the point intersecting with the real axis in the range of high frequency, the internal resistance of the electrode is obtained. As shown in the inset of Figure 4.5, the arrayed CNx
NTs microelectrode prepared with N2 flow rate of 40 sccm shows the lowest
resistance of all, which is in good agreement with the above mentioned
capability with selective N dopant.
The enhanced ET kinetics observed at CNx NTs surface may in part be attributed
to higher electronegativity of the CNx NTs surface. The attractive interaction
between the C-N dipoles present at the surface may attract the negatively charged members of the Fe(CN)63-/4- and accelerates the redox reactions. In fact, the rate
constant for ET from the reactant to the electrode can be expressed as
kox = ∫ dє (1 - f(є,T))wox(є),
where wox is the rate of ET from an occupied level of the reactant to an empty
level of the electrode.[72] This ET rates are given in terms of the density of available states, the electron-resonance width and the strength of the coupling to the phonon bath.[73,74] The activation energy for the reaction decreases with increasing electronic interaction width. The structure of the NTs, as well as their local density of states, might be responsible for the increase of the electronic-energy interaction width. In our case, arrayed CNx NT microelectrode prepared with N2 flow rate of 40
sccm has higher local-density of states (including surface defects induced states from XPS results), and promotes the enhanced ET kinetics.
The unique structures thus created in the in-situ N doping process can be verified by selective EC deposition technique, which is a direct and quantitative measure of
![Figure 2.3 Schematic illustration of the synthesis procedure of the composite.[30]](https://thumb-ap.123doks.com/thumbv2/9libinfo/8030198.161366/36.892.163.734.167.395/figure-schematic-illustration-synthesis-procedure-composite.webp)