國
立
交
通
大
學
應 用 化 學 系
碩
士
論
文
三維雷利散射顯微術及成像於活體葉綠體中基粒之研究
Three-dimensional Rayleigh Scattering Microspectroscopy
and Imaging of in vivo Single Grana inside Chloroplast
研 究 生:黃鈴婷 (Ling-Ting Huang)
指導教授:增原宏 教授 (Prof. Hiroshi Masuhara)
三維雷利散射顯微術及成像於活體葉綠體中基粒之研究
Three-dimensional Rayleigh Scattering Microspectroscopy
and Imaging of in vivo Single Grana inside Chloroplast
研究生: 黃鈴婷 Student: Ling-Ting Huang
指導教授: 增原宏 博士 Advisor: Dr. Hiroshi Masuhara
國立交通大學
應用化學系碩士班
碩士論文
A Thesis
Submitted to M. S. Program Department of Applied Chemistry
National Chiao Tung University in partial Fulfillment of the Requirements
for the Degree of Master
in
Applied Chemistry
July 2012
Hsinchu, Taiwan, Republic of China
三維雷利散射顯微術及成像於活體葉綠體中基粒之研究
研究生: 黃鈴婷 指導教授: 增原宏 博士
國立交通大學
應用化學系碩士班
摘要
在此研究中,我們著重於雷利散射共聚焦顯微術及成像系統的應用,尤其在亞微米 及奈米粒子的觀測。基粒 (Grana)為數個盤狀的類囊體堆疊形成亞微米的大小而散布於 葉綠體裡,故可視為行光合作用的最小單位。基粒的大小與其化學組成被認為具有不均 質性,從這觀點出發,結合顯微影像及光譜的量測有助於分子的辨別並討論基粒的大小 與光合作用的關係。 從水蘊草細胞的共聚焦影像中,我們可以清楚的觀察到基粒隨機地在葉綠體裡頭分 布。量測單一基粒的光散射光譜時,我們察覺每一個基粒的光譜都不完全相同,並且觀 察到基粒的位置 (在葉綠體的中間或外圍,或是葉綠體坐落在葉子裡的任一位置)不影 響光譜的量測結果。最重要的發現是基粒的尺寸相關性:當基粒的尺寸越大時,其波長會往紅外線區移動。此外,我們還用極化光測基粒的特性,證實它是光學各向異性 (optical anisotropy)。根據分析結果我們推測:在較大的基粒裡存有較多的葉綠素分 子,此外,在雷射照射下,尺寸大的基粒裡分子排列得愈發整齊,這也暗示了基粒光合 作用的效率與它的尺寸大小有關。 為證實實驗數據的可信度,我們製備了含有金奈米粒子的晶體,並且成功地測得金 奈米粒子的光散射光譜,即便它非常小又存在於晶體之中。另一方面,此實驗亦證實了 我們系統的優異性能。
Three-dimensional Rayleigh Scattering Microspectroscopy
and Imaging of in vivo Single Grana inside Chloroplast
Student: Ling-Ting Huang Advisor: Prof. Hiroshi Masuhara
M. S. Program, Department of Applied Chemistry
National Chiao Tung University
Abstract
In this study, we focus on the application of confocal Rayleigh scattering
microspectroscopic and imaging system of submicron- to nanometer-sized particles,
especially in vivo biological substances. In chloroplast of plant cell, submicronmeter-sized
grana are widely arranged and play a role of light-harvesting. The size and chemical
composition of grana are considered to possess inhomogeneity. With this viewpoint,
combining confocal microscopic imaging with spectroscopic measurement helps us to
identify the molecules and to discuss the function of the grana in terms of their sizes.
grana. The light scattering spectra of the grana depend on the granum size, although the
spectra are independent on the position of the granum, in the center or on the exterior of the
chloroplast. The greatest finding is that the spectrum is red-shifted as the granum size enlarges.
Polarization measurement indicated that grana are optically anisotropic. According to our
analyses, the obtained result suggested that there are more chlorophyll pigments in larger
granum and the molecules align much better in larger ones when irradiated by laser. Based on
the inference, we suppose that the light-harvesting property of grana is reflected in size.
The reliability of the results was supported by measurement of the light scattering spectra
of 40 nm Au nanoparticles embedded in the glycine crystal, which can be considered as a
model system containing nanoparticles inside local anisotropic surrounding, similar to that in
the chloroplast. This model system also demonstrated that confocal Rayleigh scattering
microspectroscopic and imaging system is a powerful tool for detection of single
Acknowledgement
Firstly, I would like to sincerely appreciate Prof. Hiroshi Masuhara (Department of
Applied Chemistry and Institute of Molecular Science, National Chiao Tung University) for
supervising my research studies during these two years. I am very happy to meet him and
become one of the members in his team. Prof. Masuhara is very nice and shares his unique
opinions to not only work but life. I really learned a lot from his thinking process.
I am truly grateful to Prof. Takayuki Uwada (Department of Chemistry, Josai University,
Japan) for his instruction. Prof. Uwada is very interesting and gives me lots of help in
experiment. Though he is now in Japan and very busy, he is still concerned about me. I am
glad to be his student from the bottom of my heart.
I would like to express my gratitude to Dr. Anwar Usman (Department of Applied
Chemistry and Institute of Molecular Science, National Chiao Tung University) for correcting
my master thesis and sharing his thoughts of Germany.
Besides, I want to thank Prof. Atushi Miura, Dr. Ken-ichi Yuyama (Department of
Applied Chemistry and Institute of Molecular Science, National Chiao Tung University) and
Laboratories). Prof. Miura takes care of all of the affairs in the laboratory. Dr. Yuyama and I
had some discussion and that improve my understanding of study. Prof. Sugiyama gave
specific comments and suggestions that helped me a lot in experiment.
Many thanks to all the members inclusive of Ms. Wen-Yu Lee, Mr. Ping-Yu Hee, Ms.
Jing-Ru Tu, Mr. Tsung-Han Liu, Mr. Chong-Wei Huang and my classmates including Mr.
Shung-Fa Wang, Mr. Tsu-Wei Hsu, Mr. Wei-Yi Chiang, Mr. Yan-Hua Huang, Mr. Ching-Shie
Tseng and Mr. Chi-Shiun Wu. They helped me a lot not only for research but also daily life. I
certainly wish them will get great achievement in the future.
Finally, I am greatly indebted to my family for their mentally concern and support to
Table of Contents
Chapter 1 Introduction ... 1
1.1 Confocal microspectroscopy ... 1
1.1-1 History of microscopy ... 1
1.1-2 Light scattering and absorption microscopy to evaluate electronic structure ... 1
1.1-3 Confocal microscopy using supercontinuum ... 2
1.1-4 Confocal light scattering using supercontinuum ... 4
1.2 Motivation for microspectroscopic study of complex nanostructure ... 5
1.2-1 Plant cell ... 5
1.2-2 Metal-organic hybrid material ... 9
Chapter 2 Principle ... 10
2.1 Optical properties of particles ... 10
2.1-1 Mie theory ... 10
2.1-2 Rayleigh scattering... 16
2.1-3 Refractive index of metallic and organic nanoparticles ... 18
Chapter 3 Experimental setup ... 20
3.1 Light source ... 20
3.2 Confocal Rayleigh scattering microspectroscopic imaging system ... 23
3.3 Experimental setup for crystallization ... 24
Chapter 4 Three dimensional morphological and spectroscopic study of Egeria densa .. 27
4.1 Sample preparation ... 28
4.2 Results and discussion ... 30
4.2-2 Confocal light scattering microspectroscopic analysis of grana in Egeria densa ... 36
4.3 Discussion ... 51
4.4 Summary ... 56
Chapter 5 Three dimensional spectroscopic characterizations of glycine crystals incorporated with Au NPs ... 58 5.1 Sample preparation ... 58 5.2 Results ... 61 5.3 Summary ... 68 Chapter 6 Conclusion ... 69 Reference………...71
Lists of Figures
Chapter 1 Introduction
Figure 1.1 Schematic illustration of sunlight collection……….7
Figure 1.2 Chlorophyll pigments in the LHC-II trimer and monomer………...……7
Figure 1.3 Molecular structure of typical chlorophyll pigment………..…8
Figure 1.4 Electron micrographs of plant cell. (a) chloroplast (b) granum………...….8
Chapter 2 Principle Figure 2.1 Spherical polar coordinate system centered on a spherical particle………...12
Figure 2.2 Light scattering, absorption, and extinction by a single particle………13
Figure 2.3 Calculated spectra of 100 nm Au nanoparticles with various refractive indices....19
Chapter 3 Experimental setup Figure 3.1 Picture of mode-locked Ti: sapphire laser, Tsunami………21
Figure 3.2 The mode-locking principle of Tsunami……….….21
Figure 3.3 Picture of supercontinuum……….……..22
Figure 3.4 The light scattering spectrum of supercontinuum………...22
imaging system………..23
Figure 3.6 Laser light source and microscopic system for crystallization………26
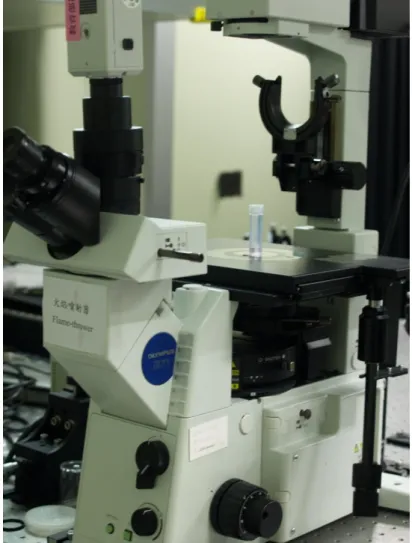
Figure 3.7 Picture of inverted microscope and other accessories……….…26
Chapter 4 Three dimensional morphological and spectroscopic study of Egeria densa Figure 4.1 Photograph of Egeria densa in the aquarium……….……….…28
Figure 4.2 Sample of Egeria densa….………..………..………..29
Figure 4.3 (A) Bright field and (B) Dark field image of plant cell of Egeria densa…………30
Figure 4.4 Light scattering image of plant cell without zooming in………...…..32
Figure 4.5 Light scattering image of plant cell with three times zoom………....32
Figure 4.6 Light scattering image of plant cell with ten times zoom………...…33
Figure 4.7 Light scattering images of a living plant cell at different depth…..…………....…33
Figure 4.8 Line profile method. (A) The chloroplast image. (B) Gaussian curve to fit the distribution……….35
Figure 4.9 The definitions of small and large grana………..………...35
Figure 4.10 The statistic chart of size distribution of grana………..………...36
Figure 4.11 The light scattering spectrum of granum………...37
Figure 4.12 Light scattering image and spectra of grana. (A) Light scattering images of chloroplasts. (B) The corresponding spectra of grana……….38
Figure 4.13 Light scattering spectra of grana. (A) Single Soret band (B) Soret band with a
shoulder (C) Soret band with split peaks……… ……….……..38
Figure 4.14 Correlation of the peak wavelength of the Soret band against size……….……..39
Figure 4.15 Light scattering image and spectra of grana. (A) confocal image (B) spectra of grana inside the chloroplast (C) spectra of grana surfacing the chloroplast…....40
Figure 4.16 Schematic illustration of polarization measurement……….……40
Figure 4.17 The polarization measurement of 200 nm Au nanoparticle..……….44
Figure 4.18 Scattering spectra of granum with various polarizations……….…….44
Figure 4.19 Polarization dependence of granum. (A) expressed in Cartesian coordinate system (B) Polar coordinate system……….45
Figure 4.20 Analyses of polarization dependence. (A) R against size (B) FWHM against size………...……...46
Figure 4.21 Fluorescent images and spectra. The fluorescent images of plant cell (A) without magnification and (B) with ten times zoom. The fluorescent spectra of grana (C) within same chloroplast and (D) in different chloroplasts………...………49
Figure 4.22 The analysis of size dependence………51
Figure 4.23 The calculation of chlorophyll a nanoparticles……….55
Chapter 5 Three dimensional spectroscopic characterizations of glycine crystals
incorporated with Au NPs
Figure 5.1 Picture of laser focusing at air/solution interface……….………..60
Figure 5.2 Picture of laser-induced crystals……….60
Figure 5.3 Picture of sample of glycine crystals………..60
Figure 5.4 The pictures of glycine crystal incorporated Au NPs………..64
Figure 5.5 The tomography of glycine crystal………...65
Figure 5.6 The picture of glycine crystal corresponding to the confocal image……….……..65
Figure 5.7 Light scattering spectra of Au NPs doped in α-polymorph glycine crystal. (A) aggregated Au NPs (B) Au NP dimer (C) single Au NP…….………...66
1
Chapter 1 Introduction
1.1 Confocal microspectroscopy
1.1-1 History of microscopy
Microscopy has been widely used and there has been a great effort to improve the
resolution and precision. Electron microscopy, in particular, can detect very small objects
down to a few nanometers, but the cost is high and the convenience is relative low. Optical
microscopy, though its spatial resolution is usually determined by diffraction limit of light,
now becomes essential tool for characterization of nanostructures. Advances in digital
imaging and analysis have also enabled microscopists to acquire quantitative measurements
quickly and efficiently [1]. With the help of techniques, such as dark-field, phase contrast,
fluorescence, and confocal, the specimen contrast is improved. The following sections would
give further discussions.
1.1-2 Light scattering and absorption microscopy to evaluate electronic structure
To identify the electronic structure of molecules, absorption spectroscopy is usually the
2
nanoparticles (NPs), it is hard to measure the absorption spectra and to distinguish each one
based upon Lambert-Beer Law; the short path length limits the interaction between the
illumination light and the NPs, also the illumination beam is too large compared to their sizes
resulting from the diffraction limit of light.
Recently, photothermal microspectroscopy is developed to measure single noble metallic
NPs, based on the change of refractive index due to changes in temperature and density of the
sample [2]. Furthermore, Photothermal Heterodyne Imaging (PHI) allows for the
unprecedented detection of gold NPs down to 1.4 nm in diameter [3]. Because heating is
necessary for PHI technique, it is not suitable for nonmetallic objects. On the other hand, light
scattering microspectroscopy can be applied to not only nonfluorescent but also nonmetallic
NPs. Combining dark-field technique which detects only scattered light from sample performs
high contrast and S/N ratio by black background. From a viewpoint of electronic information,
scattering relies on the same basic optical response to the absorption process, so the scattering
spectroscopy is an alternative measurement to evaluate the electronic structure.
1.1-3 Confocal microscopy using supercontinuum
Confocal microscopy has been developed to be a powerful tool for a few decades for the
3
of 3-D structure and spectra improves the application in biological and medical science.
Point light source illuminates at the focal plane, detecting object in a point, so that the
light source and the detected spot are confocal. The pointed detection then is imaged at the
pinhole. Confocal microscopy is originated in three mutually confocal points and the key
technique is the spatial filter. With an aperture, the out-of-focus light would be blocked and
permits only the well-defined point forming image, hence the contrast is increased.
Furthermore, scanning with a pair of mirrors (Galvano mirror) constructs the
three-dimensional image of the sample easily [4].
Confocal laser scanning microscopy (CLSM) has attracted much more attentions because
laser shows high energy density with high degree of spatial and temporal coherence, which
increases the resolution and signal intensity. W. Denk et al succeeded in two-photon laser
scanning fluorescent measurement by CLSM [5]. With a colliding-pulse-mode-locked (CPM)
dye laser producing ultrashort pulses, the probability of two-photon molecular excitation
becomes appreciable [5]. Brakenhoff et al. demonstrated that the section inherent to
two-photon imaging could be improved by the introduction of confocal aperture with
amplified Ti: Sapphire laser [6]. The use of femtosecond laser can shield sample from heat
4
range does not efficiently excite fluorophores designed for single-photon excitation [7].
Supercontinuum is the formation of spectra broadening by an intense laser propagating
through a nonlinear media. The characteristics of supercontinuum are the huge bandwidth,
spatial coherence, and high brightness. The huge bandwidth provides a broad range of
spectroscopic transitions in which many species can be detected simultaneously. The high
spectral brightness and spatial coherence give high spectral resolutions [8].
Stefano and his coworker presented a new approach of reflectance laser scanning
confocal system in which the spectroscopic imaging capabilities are achieved with the help of
wavelength-tunable source [9]. The use of supercontinuum confocal microscope in
combination with fluorescence for spectrally resolved imaging offers a great analysis of the
details of living cells [10].
1.1-4 Confocal light scattering using supercontinuum
CLSM combined with fluorescence has been widely used for the study of living tissue,
especially in imaging [11].The application of confocal imaging and fluorescence correlation
spectroscopy (FCS) to characterize well-defined lipid bilayer models was reported two
5
quenching, and environmental factors, which have to be controlled during the analyses to
obtain the reproducible measurements [13].
Scattering, on the other hand, is free from the limitations of fluorescence. Additionally,
combining confocal system and supercontinuum give an effective technique for nanostructure.
Lindfors et al. have demonstrated that confocal microscopy using supercontinuum reveals
spectroscopy and imaging of single Au NPs down to 10 nm [14]. Since noble metallic NPs
exhibit strong scattering in visible region, it recently has been developed as label-free
plasmonic biosensors [15]. Due to the outstanding results obtained by confocal light
scattering [14, 15], we are able to explore electronic spectral properties of nanostructure with
a high spatial resolution.
1.2 Motivation for microspectroscopic study of complex nanostructure
1.2-1 Plant cell
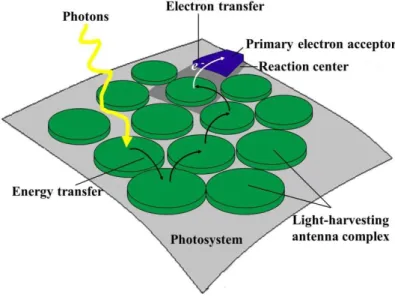
Sunlight collection and the subsequent energy transfer are included in the process of
photosynthesis (Fig. 1.1). A photosystem contains a reaction center associated with numbers
of light-harvesting complexes (LHC) composed of proteins where chlorophyll pigments
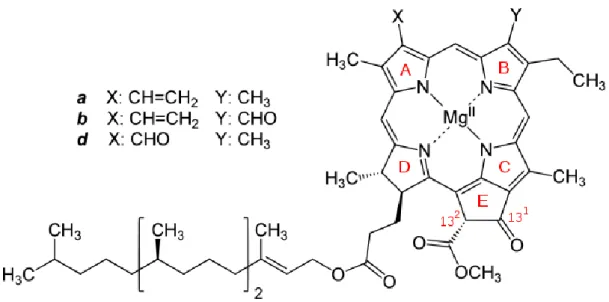
embedded (Fig. 1.2). Chlorophyll pigments (Fig. 1.3) absorb photons and then start a flow of
6
of proteins and pigments, which controls the chemical reactions during photosynthesis.
Photosystems are bound to dicoidal thylakoid membranes forming stacked thylakoids,
granum (Fig. 1.4), and the stroma lamellae which are unstacked thylakoids and connect grana
[16]. The stacked thylakoids are considered to possess high energy transfer efficiency so that
grana can be regarded as heterogeneous photo-chemical reaction center in nature, and the
study of the inhomogeneity will make the function clear.
In this study, we spectroscopically examine individual grana as a function of the size by
utilizing confocal Rayleigh scattering microspectroscopic imaging system. The molecular
arrangement in thylakoid units is especially discussed based on the polarization dependence
7
Figure 1.1 Schematic illustration of sunlight collection. Photons are captured in the
light-harvesting antenna complex by chlorophyll and other accessory pigments. When
sufficient energy is obtained, an electron is transferred to the reaction center to proceed
photosynthesis.
Figure 1.2 Pigments in the LHC-II trimer and monomer. Stereo view shows the pigment
arrangement pattern in the LHC-II trimer. Monomers are labeled I–III. For clarity, the
chlorophyll phytol chains and lipids are omitted. Green, Chl a; blue, Chl b; yellow, lutein;
8
Figure 1.3 A typical chlorophyll molecule contains a porphyrin and a long phytol chain.
Figure 1.4 (A) Thin-section electron micrograph of a higher plant chloroplast. Stroma
thylakoids can be seen in a tilted position between two white arrowheads. Scale bar = 0.5 mm
[18].(B)Tomographic section of isolated thylakoid membranes, granum [19]. (A)
9
1.2-2 Metal-organic hybrid material
Grana are submicron-sized particles inside the natural complex system. To ensure the
reliability of the measurement of grana, we prepare another sample; i.e. Au NPs embedded
inside glycine crystal which is the artificial complex system as a model system containing
NPs in anisotropic surrounding. By measuring the scattering spectra of Au NPs, which can be
corrected by computational calculation, we also show the advantages of confocal Rayleigh
scattering microspectroscopy and imaging system.
In this work, we used femtosecond laser to prepare α-glycine crystal fabricating with Au
NPs, measured the scattering spectra of Au NPs, and revealed the spatial distribution of Au
10
Chapter 2 Principle
When a particle is irradiated by electromagnetic waves, electrons perform oscillated
motion with the electric field of the incident wave. Electric charges accelerated by the
incident wave radiate electromagnetic energy in all directions.
Modes of light scattering can be divided into three domains according to the size of
particle. If the particle size is much smaller compared to the wavelength of light, it is called
Rayleigh scattering; if the size is about the wavelength of light, it is called Mie scattering, and
if the size is larger than the wavelength of light, it is called geometric scattering. In this study,
as the wavelength of light are within the visible to near infrared, Rayleigh and Mie scattering
are especially important for a few nanometer to submicron-sized objects.
2.1 Optical properties of particles
2.1-1 Mie theory
Light scattering by an induced dipole moment is caused by an incident electromagnetic
wave. Electromagnetic field of an arbitrary particle (E, H) located at the polar coordination
11
scattering electromagnetic field (Esca, Hsca).
sca in E
E
E ΗHinHs c a (Eq. 2-1)
The Poynting vector S = E × H specifies the magnitude and direction of the rate of the
transfer of electromagnetic energy at all points of spaces. Once we have obtained the
electromagnetic fields inside the particle and scattered by the paricle, we can determine the
Poynting vector at any point. However, we are usually interested only in the points outside the
particle. The time-averaged Poynting vector S at any point in the medium surrounding the
particle can be written as the sum of three terms [20]:
SSinSscaSext (Eq. 2-2)
*
Re 2 1 in in in Ε H S
*
Re 2 1 sca sca sca E H S
* * Re 2 1 in sca sca in ext E H E H S (Eq. 2-3)12
If the orientation of a plane surface with area A is specified by a unit normal vector N,
the net rate W at which electromagnetic energy crosses the boundary of a closed surface A
which enclose a volume V is
dA W r A a
Se (Eq. 2-4)If Wa > 0 (if Wa is negative, energy is being created within the sphere), energy is
absorbed within the sphere. But the medium is non-absorbing, which implies that Wa is the
rate at which energy is absorbed by the particle. Because of Eq. 2-4, Wa may be written as the
sum of three terms [20]:
ext sca in abs W W W W (Eq. 2-5) where dA W r A in in
S e , W rdA A sca sca
S e , W rdA A ext ext
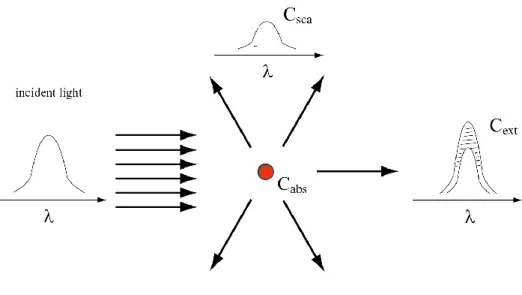
S e . (Eq. 2-6)Figure 2.1 Spherical polar coordinate system centered on a spherical particle of radius a.
θ
X
13
Figure 2.2 Light scattering, absorption, and extinction by a single particle, whose cross
sections are given as Csca,Cabs, andCext respectively.
Win vanishes identically for a non-absorbing medium; Wsca is the rate at which energy scattered across the surface A. Therefore, Wext is just the sum of the energy absorption rate and
the energy scattering rate which corresponds extinction by particle:
abs sca ext W W W (Eq. 2-7)
The ratio of Wext to Ii is a quantity with dimensions of area called cross section:
i ext ext I W C (Eq. 2-8)
14
Similarly to Eq. 2-7, the extinction cross section Cext can be written as the sum of the
absorption cross section Cabs and the scattering cross section Csca:
sca abs ext C C C (Eq. 2-9)
Based on physics, we know that Wext and Wa are independent of the polarization state of
the incident light. Therefore, we may take the incident light to be x-polarized [20]:
n n n n
n n i E i E ' 1 cos
, i i E k H tan
n n n n
n n i E i E
' 1 sin , Hi k Eiφ cot (n=1, 2, …) (Eq. 2-9)where ω is angular frequency, μ is permeability and ρ = kr. The angle dependent functions πn ,
τn and ψn are
sin cos 1 n n P ,
d dPn n cos 1 , n
Jn
(Eq. 2-10) where Pn1 (cosθ) is associated Legendre function and Jn (ρ) is the first term of Bessel function.The corresponding scattered field is
n n n n n n
n n s E ia b E
' 1 cos ,
n n n n n n
n n s E ib a k H
' 1 sin
n n n n n n
n n s E b ia E
1 sin ,
n n n n n n
n n s E ib a k H
' 1 cos
n hn (n=1, 2, …) (Eq. 2-11)15
And the scattering coefficients of the field inside the particle are[20]
' n (1) n ' (1) n n 2 ' n n 2 ' n n 2 j h h j j j j j mx mx x x x mx m mx mx x m x x mx m a p p n
' n (1) n ' (1) n n ' n n ' n n 2 j h h j j j j j mx mx x x x mx mx mx x x x mx m b p p n (Eq. 2-13)where hn(l)(ρ) is Hankel function, jn (x) is spherical Bessel function andμl, μ are permittivities of the particle and medium.
The size parameter and the refractive index are expressed as
λ πN a x 2 env , env l N N m (λ) (Eq. 2-14)
where Nl and N are refractive indices of particle and medium, respectively; a is the radius of
particle, λ is the wavelength of incident light.
Together with Eq. 2-6, Eq. 2-10 and Eq. 2-12, we derive expressions for the cross
sections of a sphere more exactly:
2 0 0 2 iθ sφ iφ sθ sφ iθ sθ iφH E H E H E H sin dθ E Re 2 1 d r Wext
2 0 0 2 θ sφ sφ θH E H sin dθ E Re 2 1 d r Wsca s s (Eq. 2-15)16
Then the scattering cross section is obtained [20]:
2 2
1 2 2 1 2 n n n sca n a b k C
(Eq. 2-16)Similarly, the extinction cross section is:
1 2 2 1 Re 2 n n n ext n a b k C (Eq. 2-17) 2.1-2 Rayleigh scatteringExpanding the spherical Bessel functions in the scattering coefficients leads an and bn to
power series. Retaining the scattering coefficients in a sufficient number of expansions, the
four coefficients can be obtained as[20]
) ( ) 2 1 ( 9 4 ) 2 ( ) 1 )( 2 ( 5 2 2 2 1 3 2 2 2 2 6 2 2 2 2 5 2 2 3 1 O x m m x m m m x i m m x i a ) ( ) 1 ( 45 2 5 1 m O x ix b , ) ( 3 2 1 15 7 2 2 5 2 O x m m ix a , ) ( 7 2 O x b (Eq. 2-16)
Here, we have taken permittivity of the sphere to be equal to that of the surrounding medium.
If |m| x << 1, then |b1| << |a1|; with this assumption the amplitude scattering matrix
17
If the incident light is unpolarized with irradiance Ii, the scattered irradiance Is calculated
by scattering matrix is
i s I m m r Na I 2 2 2 2 4 6 4 cos 1 2 1 8 (Eq. 2-17)Thus, if the quantity |(m2-1) /(m2+2)| is weakly dependent on wavelength, the irradiance
scattered by a sphere small compared with the wavelength or, indeed, any sufficiently small
particle regardless of its shape, is proportional to 1/λ4.
“When light is scattered by particles which are very small compared with any of the wavelengths, the ratio of the amplitudes of the vibrations of the scattered and incident light
varies inversely as the square of the wavelength and the intensity of the lights themselves as the inverse fourth power.” Lord Rayleigh showed the simple dimensional analysis in 1871.
However, if the incident light is unpolarized, the scattered light will be partially
polarized. Thus, we defined the degree of polarization of the scattered light, |P|, which is
independent of particle size.
2 2 cos 1 cos 1 P (Eq. 2-18)
18
The extinction and scattering cross sections are
2 1 Im 4 Im 2 2 2 m m x a k Cext (Eq. 2-19) 2 2 2 4 2 4 2 1 3 8 6 m m x a k Csca (Eq. 2-20)2.1-3Refractive index of metallic and organic nanoparticles
The optical property of metallic nanoparticle is strongly dependent on particle size, shape,
electron density and the local enviroment, the refracive index of surrounding medium. The
application of refractive index now attracts to much attetion because other parameters such as
density and temperature can be obtained by detecting refractive index [21].
We consider Au nanoparticles in 100 nm are dispersed on the glass substrate and
embedded in non-absorbing medium. The relationship between the shift of surface plasmon
band and the refractive index was given by
d l d n m 1 exp 2 max (Eq. 2-20)
Here m is the bulk refractive-index response of the nanoparticle(s); Δn is the change in
refractive index induced by the adsorbate; d is the effective adsorbate layer thickness; and ld is
19
Herman suggested the scattering efficiency based on Mie theory could be written [23]:
1 0 limQsca R x (Eq. 2-21)where R(0°) = |(m-1)/(m+1)|2 is a reflectance of a plane surface at normal incidence and m is
the complex relative refractive index of nanoparticle [24].
Fig. 2.3 shows the calculated scattering spectra of gold nanoparticle with various
refractive index of surrounding medium from 1.33 to 1.53. Based on Mie theory, the
calculation result displays that the surface plasmon band red-shifts and the scattering
efficiency enhances as the refractive index increases.
400 600 800 0.00 0.01 0.02 0.03 0.04 0.05 sca tt e ring e ff ici e n cy / a .u . wavelength / nm n=1.33 n=1.37 n=1.41 n=1.45 n=1.49 n=1.53
Figure 2.3 Calculated spectra of 100 nm Au nanoparticles with various refractive index. With
the increase of refractive index, the plasmon band shifts to longer wavelength, the intensity
20
Chapter 3 Experimental setup
3.1 Light source
Mode-locked Ti: sapphire laser light (wavelength; 700-900 nm, repetition rate; 80 MHz,
pulse duration; 160 fs, Tsunami, Spectra Physics) was introduced into a photonic crystal fiber
(PCF) to generate supercontinuum femtosecond laser beam, which was used as the light
source in this study. In principle, the Ti: sapphire laser (Fig. 3.1) was pumped by a continuous
wave solid-state visible laser (wavelength; 532 nm, Millenia Pro, Spectra Physics) at around 7
W and was controlled by an electronics module (Model 3955, Spectra Physics). A prism
sequence and a slit were used for dispersion control and wavelength selection (Fig. 3.2),
respectively. Spectral information of the output laser light was provided by a fiber optic
spectrometer (USB4000, Ocean Optics). Full width at half maximum of the spectrum and
central wavelength of the laser light were adjusted to be about 12 nm and 800 nm
simultaneously, and then the laser light was focused on PCF (Fig. 3.3).
PCF (core diameter; 1.8 μm, zero dispersion wavelength; 750 nm; length; 100 cm,
NL-PM-750, Crystal Fibre) use a microstructured cladding region with air holes to guide light
in a pure silica core, which allows laser through a cascade of nonlinear effects to give rise to a
21
Figure 3.1 A picture of mode-locked Ti:sapphire laser, Tsunami
22
Figure 3.3 A picture of shining photonic crystal fiber due to supercontinuum
Figure 3.4 One example of the light intensity profile of generated supercontinuum
500 550 600 650 700 Supercontinuum Intens ity / abr. uni t wavelength / nm
23
3.2 Confocal Rayleigh scattering microspectroscopic imaging system
Figure 3.5 The schematic illustration of our confocal Rayleigh scattering microspectroscopic
and imaging system. Blue and red arrows represent illumination and back scattering.
Fig. 3.5 showed a schematic illustration of our confocal Rayleigh scattering
microspectroscopic and imaging system. The system is based on the confocal microscope set
up containing an inverted microscope (IX71, Olympus) and scanning units (FV300, Olympus).
The supercontinuum light output from the PCF was divided into twobeams by a beam splitter,
one was introduced into a polychromator (SpectraPro 2300i, Princeton Instruments) coupled
with a charge-coupled device (PIXIS 400, Princeton Instruments) as reference light and the
24
Olympus) as a probe light. The Olympus objective lenses and optics have been designed to
suppress the chromatic chirp and aberration. Besides we used an immersion oil (with
refractive index = 1.5) to suppress further aberration effect between the objective lens and
sample chamber. Thus, we consider that our data are almost free of chromatic aberration.
The scattered light from sample was collected by the same objective lens and then passed
through a pinhole which was used to measure the target single grana selectively by the
polychromator-CCD system. The setup allows us to measure Rayleigh back scattering which
only from the single granum at the focal plane can pass through the pinhole. This means we
can exclude the contribution of light absorption greatly to the scattering measurements.
Secondly, we discuss anisotropic structures and its size-dependences based on the Soret-band,
but the fluorescence comes from the Q-band and so large Stokes shift means that Rayleigh
light scattering corresponding to the Soret-band is not affected by the fluorescence. To
convert the scattering light into scattering efficiency, we first subtracted the noise signal from
scattering signal then divided the difference by the reference light.
25
3.3 Experimental setup for crystallization
Linearly polarized femtosecond laser pulses from femtosecond laser (wavelength; 800
nm, pulse duration; 160 fs, Spitfire Pro, Spectra Physics) were introduced to an inverted
microscope (IX-71, Olympus) through an objective lens (10×, N. A. 0.25, PlanN, Olympus).
Pulse energy was adjusted by using a half-wave plate, a polarizing beam spilitter, and a
variable neutral density filter, and then was measured after passing through an objective lens
by energy meter (842-PE, Spectra Physics). The repetition rate of femtosecond laser pulse
train was controlled by a Pockels Cell. The crystal formation and morphology were observed
26
Figure 3.6 Laser light source and microscopic system for crystallization.
27
Chapter 4 Three dimensional morphological and spectroscopic study of Egeria densa
The light scattering microscopy of metallic or organic NPs has been well investigated for
decades. Theoretical and experimental studies have provided established fundamental
concepts of light scattering dynamics, microscopy, and imaging of NPs. One of interesting
features of this technique is that the scattering spectrum can give us information on the shape,
size, refractive index, electron density of the target particles, as well as the refractive index of
the medium. Thus, by utilizing such a technique with grana of plant cells being the target
particles, we study optically and spectroscopically the configuration and size of in vivo grana.
For this purpose, we have used Egeria densa Planchon (Hydrocharitaceae), commonly
known as Brazilian elodea or common waterweed, as the target. This submersed perennial
plant species native to south-eastern America was selected due to its well-known “ecosystem engineer,” given its role in stabilizing sediment and reducing turbidity and its important role in trophic dynamics[26]. The alga with a 2 cell thick leaf was cultivated in an aquarium in our
lab (Fig. 4.1). To maintain the healthiness of the alga, visually indicated by its growth and
28
Figure 4.1 A picture of Egeria densa in the aquarium.
4.1 Sample preparation
The sample was prepared by sandwiching a section of 1 mm × 3 mm of green leaf of
E. densa with two cover slips (18 mm × 18 mm and 24 mm × 40 mm, Mastsunami). The gap of the cover slips was filled with water to keep it wet, and it was sealed with a nail polish to
avoid evaporation. The typical sample cell containing the green cell of E. densa is shown in
29
Figure 4.2 A sample in dimension of 1 mm × 3 mm was cut by scissor. The upper and top
glass substrates were 24 mm × 40 mm and 18 mm × 18 mm, respectively. Additional water and nail polish to seal glasses were used to keep plant alive.
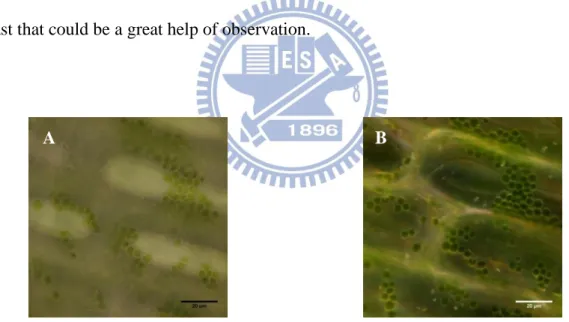
Under bright and dark field (with objective lens 100×, N.A. =1.4), the plant cells in the
leaf are observed as “islands” with white and dark-green area respectively (Fig. 4.3). More
specifically, by dark-field imaging, chloroplasts are easily distinguished and each cell is
bordered by cell wall which can be seen obviously. Dark-field image also shows higher
contrast that could be a great help of observation.
Figure 4.3 (A) Bright field and (B) dark field images of plant cell of Egeria densa
30
4.2 Results and discussion
4.2-1 Three dimensional morphological analysis of Egeria densa
By changing detection system to confocal microscopy, with the objective lens 100×,
N.A.= 1.4, we are able to observe a single granum in more detail. Granum, single grana, is
composed of stacked dicoidal membranous system called thylakoids where all the molecular
complexes that drive the light-induced reaction and provide a medium for energy transduction
are located.
Though such a 3-D organization of granum has been revealed by high resolution electron
tomography [16, 18, 32], in this study we show that our optical, spectroscopic and
non-destructive method can be used to explore the characteristic of grana. The architecture of
grana provides insights into their formation and function to clarify light-harvesting and
electron transport.
Thylakoid membranes could not be recognized by our system. However, distinguishing
each single granum in vivo is quite easy. Confocal light scattering spectroscopic images of a
living plant cell with different magnifications are shown in Figs. 4.4 ~ 4.6. Fig. 4.4 shows the
31
circle is regarded as a chloroplast, hence those gathering spots are grana while other isolated
bright spots are organelles. In some cells, only few chloroplasts were found, which suggests
the organelles moved freely due to living cell. Also, it depicts the construction of chloroplasts
and the different brightness of spots shows the spatial distribution of grana.
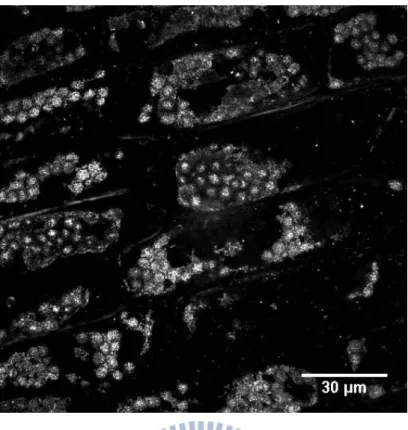
By scanning microscope objective along the z-axis from the bottom to the top within a
cell, we obtained two dimensional image stack with different height and constructed three
dimensional images of chloroplasts (Fig. 4.7). Three dimensional images not only reflect the
depth of a cell but illustrate the arrangements of grana. With confocal light scattering images,
we found that chloroplasts are oval disc-shape structure and diverse size, which have been
32
Figure 4.4 Light scattering image of plant cell of Egeria densa without zooming in.
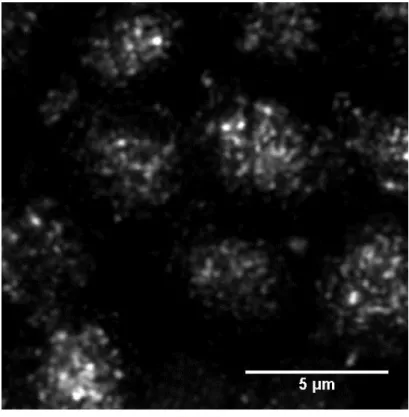
33
Figure 4.6 Light scattering image of plant cell of Egeria densa with ten times zoom.
Figure 4.7 Confocal light scattering spectroscopic images of Egeria densa at different vertical
34
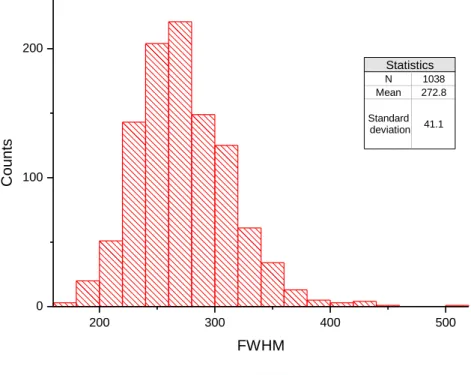
The average size of the grana is examined by the line profile method on the basis of the
obtained 3-D light scattering images. This practical way is useful for examining the relative
behavior of all variables in a multivariate data set. The line profile plot consists of a sequence
of equi-spaced vertical spikes with each spike representing a different variable in the
multivariate data set. In this case, each spike is corresponding to the pixel intensity of the
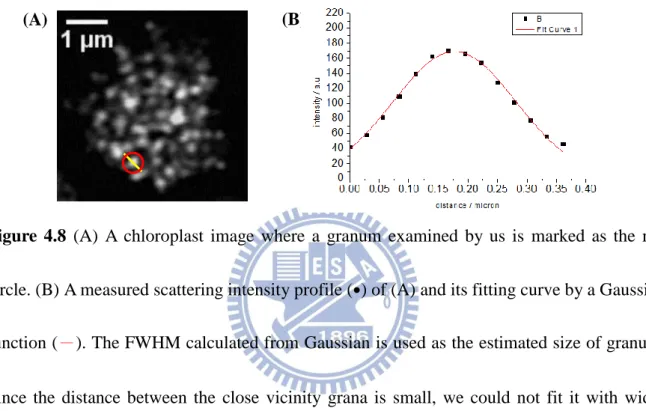
granum in the X-Y image as shown in Fig. 4.8 (A). By fitting the light intensity profile of
granum with the Gaussian fit, we can obtain the size which is derived from the FWHM, full
width at half maximum, of the Gaussian curve. The grana we estimated were on the focal
plane. In conclusion, the average size of the grana was approximated as 273 nm for 1000
numbers of grana. In order to determine the sensitivity and lateral resolution, we used small
Au NPs. The cross section of a 40 nm Au NP allowed us to determine the lateral point spread
function (PSF) with FWHM of the PSF of light, ∆ [27]. ∆ is calculated by ∆= √∆12− ∆22, where ∆1 is the FWHM of Gaussian function which was used to fit the intensity profile from
confocal image of a 40 nm diameter Au NP, and ∆2 is that of a model Gaussian function of the
particle. In this experiment, ∆1 and ∆2 were 256 nm and 20 nm respectively, so ∆ can be
estimated to be 255 nm, which is better than λ/2 for the excitation wavelength, about 300 nm.
By the size analysis, not only the size distribution (Fig. 4.10) but also the spatial
35
randomly in the chloroplast of E. densa. From statistical analyses, both grana of the small size
and the large one (Fig. 4.9) can be found in the center or on the surface of the chloroplast. The
distribution of grana randomly in the chloroplast by this optical method is consistent with the
direct observation by TEM imaging.
Figure 4.8 (A) A chloroplast image where a granum examined by us is marked as the red
circle. (B) A measured scattering intensity profile (•) of (A) and its fitting curve by a Gaussian
function (-). The FWHM calculated from Gaussian is used as the estimated size of granum.
Since the distance between the close vicinity grana is small, we could not fit it with wider
range, and could not have a clear zero background.
Figure 4.9 The definitions of small and large size. Grana below -2S are small size and beyond
+2S are large size.
(B) (A)
36
Figure 4.10 The statistic chart depicts the size distribution estimated for around 1000 grana,
giving 273 nm as average size.
4.2-2 Confocal light scattering microspectroscopic analysis of grana in Egeria densa
The light scattering spectra show obvious Soret band located from 490~530 nm and the
weak signal Q band can be found around 680 nm. Both bands are related to the absorption
spectrum of chloroplasts, which contains two main bands; the Soret band is around 450 nm
and the Q band is approximately at 650 nm. The difference is due to the relationship between
absorption and scattering spectra. Fig. 4.11 illustrates the typical scattering spectrum of a
single granum. The different size results in some side bands and relative intensity fluctuation,
200 300 400 500 0 100 200 C o u n ts FWHM Statistics N 1038 Mean 272.8 Standard deviation 41.1
37
indicating different assorted components inside the granum. By combination of light
scattering images and scattering spectra to analyze the relationship between size and spectra,
we found that the Soret band of the spectrum shifts to longer wavelength with the increasing
size (Fig. 4.12 (B)). The range of the size starts from 200 nm to 460 nm and the Soret band of
spectra shifts from 490 nm until 530 nm. Fig. 4.13 shows three types of the Soret band. When
the band splits into two peaks, we considered both peaks and plotted the peak position of the
Soret band against size (Fig. 4.14). It is clearly shown that the size and the Soret band
wavelength presents a good correlation. The correlation implies that the red-shift is observed
as the size is enlarged.
500 550 600 650 700 0.00 0.05 0.10 0.15 0.20 0.25 0.30 0.35 0.40 sc att er ing ef ficie nc y / a. u. wavelength / nm
38 500 550 600 650 700 335 nm Sc at tering ef fic ienc y / a. u. Wavelength / nm 226 nm 281 nm
Figure 4.12 Light scattering image and spectra of single grana are shown. (A) Light
scattering images of chloroplasts with 10 times magnification and (B) three spectra in
different colors are related to single granum in (A), which differs from granum to granum.
(A) (B) (C)
Figure 4.13 Light scattering spectra of grana. (A) The Soret band shows single peak. (B) The
side peak of Soret band is small so we assumed this kind of peak as single peak. (C) The
Soret band splits. We assumed the case as split peaks.
39
Figure 4.14 The plot of the peak wavelength of the Soret band against size. The split peaks
correspond to the case C in Fig. 4.13.It is clearly shown that the Soret band shifts to longer
wavelength as the size of grana increase.
Whether the site of granum in the chloroplast is one of the factors determining the
scattering spectrum or not was confirmed by measuring the spectra of grana located at various
site. First, we checked the position of chloroplast; we found that wherever chloroplast is either
located, at the center, close to the cell wall, or in the alternative space in the leaf, the spectra
of grana are not distinguishable. Moreover, the distribution of grana inside the chloroplast is
not important. Fig. 4.15 (A) ~ (C) illustrate the position dependence of grana. It implies that
the spectra of grana are independent on the position, although grana at the margin and at the
center of chloroplast still show size dependence.
480 490 500 510 520 530 200 250 300 350 400 450
w
a
v
el
eng
th
o
f
So
ret
ba
nd
/ nm
size / nm
single peak split peak40
Figure 4.15 Light scattering image and spectra of grana are shown. (A) By yellow circle, we
roughly defined the border of center and surface of the chloroplast. (B) The spectra of grana
in the center of the chloroplast. (C) The spectra of grana at the surface of the chloroplast.
Figure 4.16 Polarizer is set in front of the confocal microscope. Each time we started from
same angle as 0 degree; the polarization angle is relative.
(A) (B) (C) 500 600 700 s c attering effi c ienc y /a.u. wavelength / nm 244 nm 328 nm 435 nm
Surface of the chloroplast
500 600 700 s c attering effi c ienc y / a.u. wavelength / nm 214 nm
Inside the chloroplast
322 nm 410 nm
41
The dependence of scattering spectrum of an individual granum on polarization of the
probe light gives important information on the optical anisotropy of grana in the chloroplast.
Such a method has been employed, for instance, in the study of optical anisotropy of
chlorophyll molecules within in vivo chloroplasts [28].Differential polarization imaging and
circular dichroism provide information on long-range chiral organization of the
pigment-protein complexes in mature granal chloroplasts [29].In this study, the polarization
measurement was operated by setting a polarizer in front of the microscope (Fig. 4.16). In
other words, we expect that the polarized light interacts with molecules directly, and then the
scattered light was transformed into signal in this measurement. Circular polarized
supercontinuum passed through the polarizer and became a linear polarized input. The
polarized angle is relative with respect to a certain angle in laboratory axis. To ensure the
reliability of the polarization measurement of grana, at first we measured the scattering
spectrum of 200 nm Au NP as a standard with essentially the same optical probe light and
experimental setup.
The Au NPs are optically isotropic and exhibit high scattering efficiency in visible
region due to the resonant plasma oscillation of conduction electrons. To minimize the
contribution of theindex-mismatched reflection, Au NPs are casted on the glass substrate and
42
plotted the scattering efficiency as a function of polarization angle (Fig. 4.17). The scattering
efficiency was chosen from the fixed wavelength which was the Soret band of the unpolarized
spectrum. Because Au NP is optical isotropic, polarization dependence of Au NP shows in
Fig. 4.17 can be attributed to instrumental function. If we use depolarizer instead of
instrumental function, we will not have any information on anisotropy of the grana or
molecular alignment in the grana. By this instrumental function, we can therefore correct the
raw data of polarization dependent measurement of grana.
Fig 4.18 showed the spectra of single granum at polarization angles of 45, 90 and 135
degree. The spectra changed dramatically, especially at the Soret band. With the same
analytical procedure with the case of Au NP, we found it hard to determine at which
wavelength the scattering efficiency of granum should be analyzed, because the spectral shape
also changed with polarization angle. As a consequence, we selected the wavelength from the
unpolarized spectrum at which the scattering efficiency is maximum. Afterbeing corrected by
instrumental function, we obtained the relative scattering intensity as a function of
polarization angle, as shown in Fig. 4.19 (A). The polarization measurements of grana exhibit
a band at 135 degree and a valley at 45 degree; that is to say that the Soret band appears and
disappears depending on the angle of incident light with 90° symmetry, indicating optical
43
of grana efficiently. The solid and dotted lines represent experimental and expectation result,
respectively, since the motion of living grana made measurement difficult.
Further analyses are expressed in Fig. 4.20 (A) and (B). For easier comparison, the
maximum and minimum values of the polarization plot are defined as b and a, and the ratio of
b and a (R), calculated as a/b, represents the change of light interacted by granum.
Fig. 4.20 (A) illustrates the parameter R as a function of the polarization angle at the peak
wavelength of the Soret band, which shows clear correlation.
The FWHM which also can stand for the effect of light interacted by pigment molecules
is used as a parameter of polarization dependence. Fig. 4.20 (B), which plots the FWHM of
the primary band from polarization plot versus the polarization angle, trends down with
44 0 20 40 60 80 100 120 140 160 180 200 2 4 6 8 s c attering effi c ienc y / abr. uni t polarization / degree 200 nm Au
Figure 4.17 The polarization measurement of 200 nm Au NP. We measured the scattering
efficiency of the resonance band at the wavelength giving its maximum intensity for each 15
degree. The dependence can be used as an instrumental function because Au NP is optically
isotropic.
Fig. 4.18 Scattering spectra of granum without polarization and with 45, 90 and 135 degree.
The spectrum changed as the polarization changed, especially at the Soret band.
500 600 700 s c at tering ef fic ienc y / a. u. wavelength / nm 45 degree 90 degree 135 degree without polarizer
45 0 50 100 150 200 0 4 8 12 16 20 24 re lat ive int e n sity / a .u . polarization / degree size~419 nm @533.174 nm 0 5 10 15 20 0 15 30 45 60 75 90 105 120 135 150 165 180 195 210 225 240 255 270 285 300 315 330 345 0 5 10 15 20 experiment expectation relat iv e int ens it y / a. u.
Fig. 4.19 Polarization dependence of granum. (A) The intensity of each angle was chosen
from the scattering efficiency of each spectrum at 533 nm which had the maximum efficiency
of the Soret band. The polarization plot then is corrected by instrumental function, and finally
the polarization dependence was plotted. The polarization dependence indicated granum is
optically anisotropic. (B) Polarization dependence expressed in polar coordinate system. The
solid line is the experimental result and the dotted line is the expectation. The symmetry was expected since we used linear polarization.
(B) (A)
46
Fig. 4.20 The analyses of polarization dependence. (A) R is defined by the ratio of the
minimum and maximum the values of the polarization dependence. The inset illustrated the
parameters of R. It is clear that R decreases as size of granum enlarges. (B) The y-axis stood
for the FWHM shown in the inset. FWHM was calculated by Gaussian fit. In general, FWHM
and the size represent negative correlation.
(A)
47
Chlorophyll fluorescence analysis has become one of the most powerful and widely used
techniques, which is available to plant physiologists and ecophysiologists [31]. In this study,
we also apply fluorescence measurement to living grana. Sample was directly excited by 488
nm Ar-ion laser. This means that the shoulder of Soret band is excited. Although the total
fluorescence yield of chlorophyll is very small (only 1 or 2% of total light absorbed),
measurement is quite easy because of strong fluorescence intensity due to high fluorescence
cross section [31].Fig. 4.21 (A) and (B) are the fluorescence images with one and ten times
zooming respectively. Compared to Fig. 4.4, only chloroplasts were observed and their cell
wall was not depicted directly, but it could be distinguished from the distribution of
chloroplast. In addition, the 3-D spatial distribution can be differentiated from the brightness
of chloroplast. By contrast with Fig. 4.6, the fluorescence image showed lower resolution,
only few and unclear grana could be recognized. In contrast to 90 grana observed on average
in one chloroplast from the CLSM image, less than 20 grana are clearly observed in the
fluorescence image. On the other hand, the granal size of fluorescence image is around 600
nm which is almost 2 to 3 times larger than that of CLSM image. It implies that a granum in
the fluorescence image may contain 2 to 3 grana. These demonstrated that CLSM is better
48
Chlorophyll fluorescence emission spectra were measured from various sites of the
imaged chloroplasts. Results are shown in Fig. 4.21 (C) and (D), with the spectra normalized
at 684 nm. Spectra a and b show grana in the same chloroplast, spectra a, c, d and e illustrate
the spectral shapes of grana from different chloroplasts. Obviously, the discrepancy among
them is quite small. In other words, the fluorescence spectrum is independent on granum size
and position in the chloroplast. The results suggest that (i) the grana contain different kinds of
molecules with various relative intermolecular orientations and many of them play as a
fluorescence quencher with different quenching efficiency, and (ii) some grana may undergo
non-radiative decay. Hence, the signal-to-noise ratio of the light scattering is better than that
of the fluorescence, so that the spatial resolution of light scattering is apparently better
compared to the fluorescence imaging. The consequences indicate that, as compared to
fluorescence measurement, light scattering measurement is more suitable for in vivo grana to
49 a b c d e (A) (B)
50 620 640 660 680 700 720 740 0.0 0.2 0.4 0.6 0.8 1.0 N orm aliz ed int ens it y / a. u. wavelength / nm a b 620 640 660 680 700 720 740 0.0 0.2 0.4 0.6 0.8 1.0 a c d e wavelength / nm N orm aliz ed ef fic ienc y / a. u.
Figure 4.21 Fluorescence images and spectra are shown. (A) The fluorescence image of plant
cell without magnification. Different brightness depicts the distance from the focal plane. (B)
The fluorescence image of plant cell with 10 times magnification. Only some grana are
recognized. (C) The fluorescence spectra of two grana in the same chloroplast. (D) The
fluorescence spectra of grana in different chloroplast.
(C)
51
4.3 Discussion
Fig. 4.22 The analysis of size dependence.
To interpret the granum size-dependence of the Soret band of the spectrum, first we
should consider what important factors determine the Soret band. Size dependence of
electronic spectra could be discussed based upon optical property. Here we list three
possibilities that might be the effective factors of size dependence; chemical composition,
optical effect and molecular arrangement (Fig. 4.22). The further detail of each element
will be discussed in the following sections, which includes the computational calculation and
experimental evidences. size dependence of optical properties optical effect Reabsorption by itself by other particles calculatoin chemical composition molecular arrangement
52
When mentioning molecular electronic spectra, chemical composition of the species
usually comes up. It is known that various pigments in the grana and their compositions differ
for each granum. The fluctuation of chlorophyll a usually varies with different extracting
procedures or solvents, but the main pigment composition is still chlorophyll a [33, 34]. This
finding is not only limited to E. densa but also presented in other plants [35]. In other words,
although the spectra vary slightly from granum to granum due to different composition, the
primary shape should retain the same. Since the composition of granum only has minor
influences on the spectrum, the factor of chemical composition can be excluded from the
possibilities.
Optical effect can be divided into two parts, reabsorption and calculation. Reabsorption
denotes that the scattered light from a sample is reabsorbed by surrounding or the sample
itself. In this study, reabsorption means the scattered light from granum is reabsorbed by other
grana or itself. Reabsorption by granum itself can be neglected because the grana are small
enough (average size is 273 nm). In section 4.2-2, we have already proven the position
dependence. Actually, the position dependence showed the indirect verification that
reabsorption by other grana was very small. The spectra of grana in arbitrary site
discriminating non-dissimilarities implied that the reabsorption effect was so unobvious that