行政院國家科學委員會專題研究計畫 成果報告
產品資料管理系統下的零件搜尋與比對
研究成果報告(精簡版)
計 畫 類 別 : 個別型
計 畫 編 號 : NSC 95-2221-E-002-136-
執 行 期 間 : 95 年 08 月 01 日至 96 年 07 月 31 日
執 行 單 位 : 國立臺灣大學機械工程學系暨研究所
計 畫 主 持 人 : 尤春風
計畫參與人員: 博士班研究生-兼任助理:蔡易龍、趙甦農
碩士班研究生-兼任助理:曾凱威
報 告 附 件 : 出席國際會議研究心得報告及發表論文
處 理 方 式 : 本計畫可公開查詢
中 華 民 國 96 年 09 月 05 日
行政院國家科學委員會補助專題研究計畫成果報告
※※※※※※※※※※※※※※※※※※※※※※※※※※
※ ※
※ ※
產品資料管理系統下的零件搜尋與比對
3D Part Retrieval in Product Data Management System
※ ※
※※※※※※※※※※※※※※※※※※※※※※※※※※
計畫類別:■個別型計畫 □整合型計畫
計畫編號:NSC95-2221-E-002-136
執行期間:95 年 08 月 01 日至 96 年 07 月 31 日
計畫主持人:尤春風
計畫參與人員:蔡易龍、曾凱威
本成果報告包括以下應繳交之附件:
□赴國外出差或研習心得報告一份
□赴大陸地區出差或研習心得報告一份
■出席國際學術會議心得報告及發表之論文各一份
□國際合作研究計畫國外研究報告書一份
執行單位:臺灣大學機械系
中 華 民 國 96 年 08 月 22 日
行政院國家科學委員會專題研究計畫成果報告
產品資料管理系統下的零件搜尋與比對
3D Part Retrieval in Product Data Management System
計 畫 編 號:NSC 95-2221-E-002-136
執 行 期 限:95 年 08 月 01 日至 96 年 07 月 31 日
主
持
人:尤春風
you@ntu.edu.tw
臺灣大學機械系
一、中文摘要
有鑑於市場上產品推陳出新的快速及
圖檔資料數量倍增的情況下,檢索圖檔愈
來愈不易,且舊有群組技術無法描述現代
多樣化的產品,故需要新的方法來進行圖
檔搜尋。
本研究利用零件 CAD 圖檔的打光投
影影像,進行 Polar Fourier Transform(PFT)
分析,得到描述此影像的 Generic Fourier
Descriptor(GFD)資料,以此進行圖檔外
型的描述與比較;透過分析製造特徵與特
徵辨識技術,可以取得圖檔的特徵種類與
特徵輪廓。比較 GFD 與特徵資料,能夠判
斷圖檔的相似性。此法則應用在產品管理
系統中,可以搜尋資料庫中具有特定外型
的零件圖檔,透過分析圖檔的外型與特徵
變更,進行自動版本管理的工作。
關鍵詞:零件搜尋與比對、網頁、產品資
料庫管理系統
Abstract
This investigation presents an effective
algorithm of searching parts with similar
shape and manufacturing features from a
CAD files, identifying parts with similar
shapes and features, in order to share their
design and manufacturing data in product
data management (PDM) systems. Polar
Fourier Transform (PFT) analysis is applied
to the shadings image of a part to obtain its
Generic Fourier Descriptor (GFD) indexes,
while feature recognition is employed to
obtain the manufacturing features of a part.
The similarity of two parts can be defined
using GFD index and feature information.
This proposed approach can be applied to
PDM systems in web-based environment to
search parts with a particular shape and
manufacturing feature, and to process the
automatic version control by analyzing the
differences in shape and manufacturing
feature of different version parts.
Keywords: part retrieval, web-page, product
data management
二、緣由與目的
大型企業普遍使用 CAD 系統超過三
十年以上。中小型企業因為個人電腦科技
進步,效能一日千里,且設備成本快速降
低,近十年來導入 CAD 系統的比例也大幅
提高,幾乎完全取代人工製圖的設計程
序,可說是目前設計與製造流程中最重要
的工具。
從企業採用 CAD 系統開始,圖檔的管
理與檢索,一直是重要的課題。由於產品
不斷推陳出新,相對的圖檔數量亦快速增
加,尤其今日少量多樣化的產品生產模
式,使得圖檔增加的速度超過以往。普通
的 3C 電子產品,如手機、筆記型電腦,由
數十個至數百個零件所組成,車輛由數萬
零件組成,更甚者如飛機等航空器,其零
1
件數目達到百萬之譜。若依照一個零件需
要一個圖檔估計,企業累積的圖檔數量十
分可觀。
管理數量如此龐大的圖檔,若沒有建
立詳細的歸類方式,要從數量龐大的檔案
中,找到目標圖檔,可謂大海撈針。因此
利用有效的控管機制,例如群組技術,按
照圖檔特徵進行編碼分類,以利分類管
理,是早期管理圖檔的機制。描述圖檔特
徵的 GT 編碼具有其限制,當圖檔複雜時,
將難以歸類。且若編碼規則不夠清楚或者
編碼有誤時,搜尋檔案反而更為困難。為
克服圖檔搜尋困難的問題,相似零件搜尋
技術應運而生。
三、研究方法
各種外型描述與相似程度判斷法則,
都有其使用上的優點與限制,學者們的研
究也提出許多相似性判斷所需遵守的原
則,但尚未見到完整的原則列表。此處按
照這些原則並加上新的看法,作為本研究
的外型描述與相似性判斷法則必須遵照的
目標與規範。
各種相似性判斷法則,需符合以下幾
項條件,才具有實際的應用價值:
(1) 外型描述方式符合唯一性。
(2) 外型描述不受非扭曲幾何變化影響。
(3) 外型描述與相似性評估法則線性度高。
(4) 相似性評估結果需對稱。
(5) 相似性評估的計算量,不因候選零件數
目增加而大幅成長。
本 計 畫 為 達 成 本 計 劃 的 目 標 , 茲
分 為 外 形 描 述 與 相 似 性 判 斷 原 則 加
以 敘 述 :
A. 外形描述
本研究提出一種外型描述法則,能夠
讀取 Spring Solid Part 檔案(.prt)、STEP
AP203 / 214 檔案與三角形網格檔案,以不
簡化、不改變原有模型資料的前提下,針
對不同格式的檔案,重建實體外型,辨識
特徵資訊。
外型的描述大致可以特徵與外型兩方
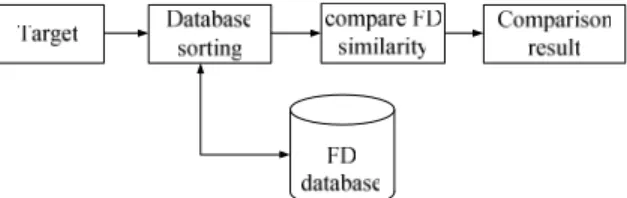
面著手,其分析方法如圖 1 所示。
圖 1 零件檔案分析流程
(1) 實體外形描述
對於實體外型描述,本研究使用實體
影像,以圖像辨識方法進行外型描述與比
較。
為了克服實體旋轉造成的差異,採用
多視角擷取影像方式避免。視角的角度分
佈,將一個正 20 面體中心與實體重疊,利
用正 20 面體頂點等分於空間的特性,以面
的法向量作為視角(View Vector),依此
角度進行打光著色。故一個實體會有 20 張
不同角度的打光著色圖形,如圖 2 所示。
2
圖 2 利用 20 面體等角取得投影影像
(2) 製造特徵描述
要比較兩圖檔所具有特徵的相似程
度,需要針對特徵資料項中具有代表性的
項目進行比對,如圖檔特徵種類、數量、
生長輪廓、基準位置與方向、生長長度等
等。判斷完特徵種類後,接著才能依照特
徵種類進行比對。
特徵資訊中的特徵輪廓亦採用圖像辨
識法,配合檢驗特徵在零件上的相對位
置,描述與比較兩個物體的特徵。雖然特
徵皆由輪廓與路徑組成,如圖 3 所示,但
是不同種類特徵其生長方式不同,故需先
區分特徵種類再進行比較。
圖 3 特徵生長資料
對相同種類的特徵先比較其特徵輪
廓,由於特徵輪廓是簡單的 2D 圖形,可以
採用 GFD 進行分析,生長路徑亦可藉此方
式來判斷兩特徵的相似程度。
特徵對物體的外型具有相當的影響,
故兩個物體具有的特徵種類可作為相似性
比較的指標,但並沒有絕對的關連性,因
為兩個外型完全一樣的物體,可能特徵並
不相同,反之亦然,兩個特徵完全一樣的
物體,可能外型並不相同,但透過特徵辨
識法則解決,可使外型相同的物體具有一
致特徵。
B. 相似性判斷原則
完成圖檔的 GFD 與特徵分析後,便可
以進行兩圖檔的相似性評估。
GFD 描述子代表該影像組成離散元素
的頻譜分佈,低頻項影響物體輪廓整體組
成,高頻項影響細部外型。振幅是此頻率
影響影像的程度,故比較兩 GFD 時僅考慮
中低頻部分料,以接近實際情況,省略過
高的頻率,避免雜訊及小變化影響運算時
間及整體趨勢。
比較兩個圖形的 GFD 前,首先需將
GFD 進行正常化。相同項目的絕對差值進
行加總後可得到總差異值,計算法則如(1)
式,此值越小則兩 GFD 越接近,相似性可
藉此來衡量,其中 Q 為候選者,T 為比對
目標,N 為 GFD 數列長度。
2 / 1 2 / 1 2 ⎟ ⎠ ⎞ ⎜ ⎝ ⎛ − × =∑
= T i N i T i Q i GFD GFD GFD d(1)
實際運作流程如圖 4 所示。
3
圖 4 GFD 外形比對流程
四、結論與成果
本研究提出一個以外型與特徵為基準
的相似零件搜尋系統,以 Thick Server -
Thin Client 為主要架構,將系統分為網頁
介面,運算伺服器與資料庫,如圖 5 所示。
以 Java Swing 建構使用者介面,Java 3D 進
行 3D 圖形展示,並使用 Microsoft SQL 資
料庫作為存放資料的平台。
圖 5 系 統 基 本 架 構
解讀圖檔、GFD 計算等高運算量工作
是本系統的核心工作,為了避免使用者介
面的變更影響核心運作,將其與使用者模
組的低運算量工作分離。網頁介面主要提
供存取圖檔、展示圖檔 3D 外型及顯示搜尋
結果等功能,但不具處理圖檔或相似零件
搜尋的能力。
系 統 運 算 核 心 有 圖 檔 處 理 、 計 算
GFD、相似性評估、資料傳遞。利用 Java
撰寫的 Spring Solid System,讀入圖檔後,
開始特徵辨識與擷取特徵資料,並重建圖
檔後進行面資料分割並以三角形資料型態
傳遞給網頁介面之 Java 3D 顯示。
接著針對網頁介面回傳的圖檔外型影
像以及特徵輪廓影像,進行 PFT 分析,得
到描述物體外型與特徵輪廓的 GFD。並利
用檔案的 GFD,與資料庫中其他圖檔的
GFD,進行相似性評估。
資料傳遞分成兩部分,對於使用者模
組,接收圖檔原始資料,回傳可供 Java 3D
顯示的三角形資料以及特徵資訊,並將圖
檔上傳至資料庫;接收 Java 3D 擷取的外型
影像與特徵輪廓,回傳 GFD 計算與相似性
評估結果,並將特徵資料、外型影像與 GFD
上傳至資料庫,流程如圖 6 所示。
圖 6 資 料 傳 遞 流 程
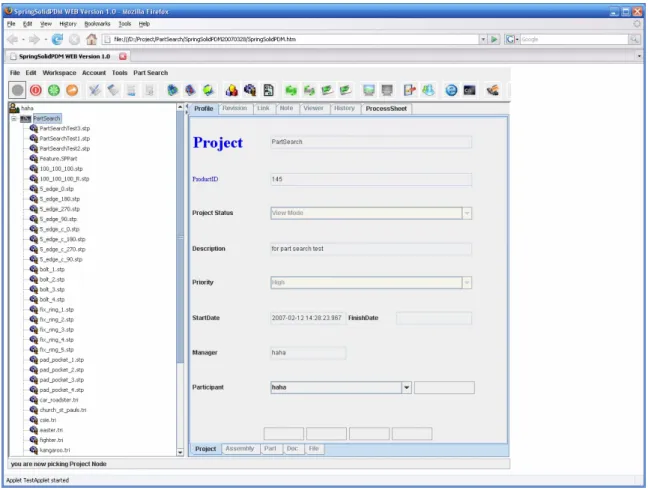
本研究建立一個在產品管理系統中的
相似零件搜尋系統在網頁環境下運作,圖 7
是產品管理系統的使用者介面。進入 PDM
系統後,可以看到先前所儲存的 Project,
點選 Project 中的 Part 可以預先瀏覽 3D 圖
形,接著進入搜尋系統。
4
圖 7 產 品 管 理 系 統 使 用 者 介 面
依照檔案類型,可以在使用者介面
上,選擇依照外型或者特徵,對目標檔案
與資料庫檔案比較其相似程度。若選擇比
較外型影像,則系統會自動進行旋轉圖形
建立投影影像的動作。
系統接著將取得的實體投影影像,以
PFT 法則分析,計算得到 GFD,並且計算
跟資料庫中記錄的圖檔 GFD 之差異程度,
依相似程度排序列出結果。使用者可以透
過選擇要比對的 GFD 數列長度,來控制比
較的精確度與搜尋時間。
使用者可以點選圖形,指定從資料庫
中下載相似圖檔的原始檔案進行即時的
3D 檢視。若選擇比對特徵,系統會針對目
標物體尋找特徵種類與數量接近的候選
者,特徵數量從使用者介面設定。
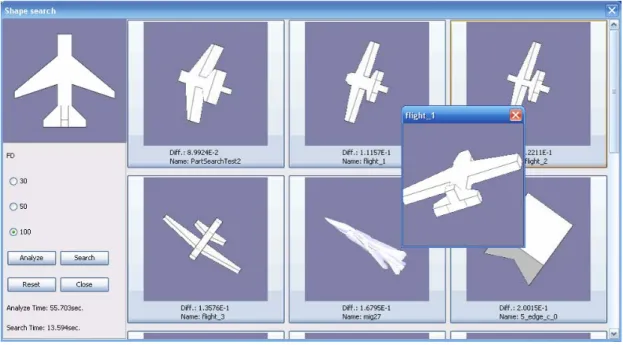
圖 8 及圖 9 分別為外形搜尋以及特徵
搜尋的結果。
圖 8 零件外形搜尋結果,GFD=100
圖 9 多特徵零件搜尋結果,GFD=100
使用者可以點選圖形,指定從資料庫
中下載相似圖檔的原始檔案進行即時的
3D 檢視。若選擇比對特徵,系統會針對目
標物體尋找特徵種類與數量接近的候選
者,特徵數量從使用者介面設定。
本研究驗證 GFD 外型描述法則可在實
體模型系統上作為外型相似程度判斷及特
徵輪廓的比對分析。
本研究針對 Spring Solid Part、STEP
AP203/214、STL 三角形化檔案,採用 GFD
外型描述及分析製造特徵實作一個相似零
件搜尋系統,可在單機環境與網路化環境
下,達成以下成果:
(1) 給定一個檔案搜尋資料庫中外型或特
徵相似者,並依相似程度排序列出。
(2) 使用者可將相似圖檔自資料庫中下載
加以應用。
本研究亦提出相似零件搜尋功能,在
產品管理系統上的應用,並且實作一個具
有相似零件搜尋功能,以圖檔管理為主的
三層式產品管理系統,且具有以下幾點特
徵:
(1) 分析 CAD 圖檔並搜尋產品資料庫,取
得類似圖檔的相關資訊加以應用。
(2) 以圖檔為目標,尋找產品資料庫中該圖
檔所相關的資訊。
5
五、參考文獻
[1] Berchtold, Stefan. Keim, Daniel A.
Kriegel, Hans-Peter. "Using extended
feature objects for partial similarity
retrieval",
The VLDB Journal,
pp.333-348, 1997.
[2] Chen, Ding-Yun. Tian, Xiao-Pei.
Shen,Yu-Te. Ouhyoung, Ming. "On
visual similarity based 3D model
retrieval", EUROGRAPHICS, Vol.22,
No.3, 2003.
[3] Elison, Alexei. Nau, Dana S. Regli,
William C. "Feature-based similarity
assessment of solid models", Proc
ACM Solid Modeling Conference,
pp.297-310, 1997 Atlanta GA USA.
[4] Zhang, Dengsheng. Lu, Guojun.
"Content-based shape retrieval using
different shape descriptors: A
comparative study", In Proc. of IEEE
International Conference on
Multimedia and Expo (ICME2001),
pp.317-320, Tokyo, Japan, August
22-25, 2001.
[5] Zhang, Dengsheng. Lu, Guojun.
"Improving retrieval performance of
Zernike moment descriptor on affined
shapes", In Proc. of IEEE International
Conference on Multimedia and Expo
(ICME2002), Vol.1, pp.205-208,
Lausanne, Switzerland, August 26-29,
2002.
[6] Zhang, Dengsheng. Lu, Guojun.
"Shape based image retrieval using
generic Fourier descriptors", Signal
Processing: Image Communication,
Vol. 17(10), pp. 825-848, 2002.
[7] Zhang, Dengsheng. Lu, Guojun. "A
comparative study of curvature scale
space and Fourier descriptors", Journal
of Visual Communication and Image
Representation, R.14 (1 ) ,pp.41-60,
2003.
[8] You, Chun-Fong, Chen,
Tsung-Po. "3D Part Retrieval in
Product Data Management System",
Computer Aided-Design & Application,
pp.117-125, 2007.
[9] 王馨苹,製造特徵辨識之研究,國立
台灣大學碩士論文,中華民國 92 年。
[10] 尤春風,實體模型系統,課程講義,
1995。
[11]
尤春風,台灣大學實體模型系統實驗
室,Spring Solid System 實體模型系
統。
出席國際學術會議心得報告
計畫編號 NSC
95-2221-E-002-136
計畫名稱
產品資料管理系統下的零件搜尋與比對
出國人員姓名
服務機關及職稱
尤春風, 國立臺灣大學機械系教授
會議時間地點 2007, June 25-29, Honolulu, Hawaii
會議名稱
2007 International CAD Conference and Exhibition
發表論文題目 3D Part Retrieval in Product Data Management System
一、參加會議經過
論文於 2006 年 11 月 30 日上傳整篇全稿文章,並以規定的格式撰寫,經審查委員會審查,
於 2007 年 2 日月 28 日核定接受通知,並告知論文修改的重點。如 Paper 被審查委員會核定
可以發表在Computer-Aided Design and Applications journal 時,修正版的文章以 MS DOC 格
式於 2007 年 3 月 31 日上傳繳交, 2007 年 5 月 15 上傳繳交 Microsoft Power Point (PPT)檔案,
並於 2007 年 6 月 25 日至 29 日於指定的時間在 Honolulu 發表論文。
二、與會心得
International CAD Conference 是 CAD 領域重要的研討會之一
。投稿者需親自報告,
如被接受還可以發表在Computer-Aided Design and Applications journal 上,是一個評價不
錯的研討會。
從 1974 年開始
,
每年皆舉辦
,
2004 年至 2006 年移至泰國
,
分別在 Pattaya
,
曼谷
,
Phuket 舉行
,
2007 年起移至美國舉行
。
2006 年本人參加過第一次的 CAD 研討會
,
本次為第二次參加。2006 年所參加的研討會在我所報告的 section 裹,大部份皆教授親自
上台報告,感覺蠻好的,領域相近,彼此可以互相交流,但反觀今年所分配到的 section,
領域差異極大,大部份的教授無法與會,皆由博士班的研究生參加,參與感或許打折扣。
本次的 CAD 研討會除了 section 的報告外
,
每天皆有特定的
Tutorial,由研究有成的
學者主講,計有 Graphics Processors in CAD,Towards CAD and Manufacturing at the
Nanoscale,Data Mining for Knowledge-Driven Design,Computer-Aided Tolerance Analysis
for Design,Knowledge Sharing in the Global Product Development Process 等,為時一小時,
僅小部份為舊主題,大部份為 CAD 發展的新趨勢。尤其是知識工程與知識管理等領域皆
是可以與電腦輔助設計系統與產品資料管理系統結合在一起,尤其在接觸企業界有關治
夾具與模具的領域,更易發揮其可用之處。
本次所報告的主題是在產品資料管理系統下進行零件的搜尋
,
並且在網頁的環境下
進行搜尋的工作
。主題的特點是電腦輔助設計系統與產品資料管理系統整合在一起,使
用 Java 語言撰寫,易與網際網路的環境結合在一起,讓使用者可以一氣呵成,達成使用
者搜尋零件的目標,減少零件建模所耗費的時間。
從整個的議程而言
,
CAD 研討會是成功的
,
一方面可以彼此學術交流, 再者可以瞭
解 CAD 發展的新趨勢
,
因此 CAD 研討會足以鼓勵從事 CAD 領域研究人員參與
。
Computer-Aided Design & Applications, Vol. 3, Nos. 1-4, 2007, pp 117-125 117
3D Part Retrieval in Product Data Management System
Chun-Fong You1 and Tsung-Po Chen2
l National Taiwan University, you@ntu.edu.tw
2National Taiwan University, r91522606@ntu.edu.tw
ABSTRACT
This investigation presents an effective algorithm of searching parts with similar shape and manufacturing features from a CAD files, identifying parts with similar shapes and features, in order to share their design and manufacturing data in product data management (PDM) systems. Polar Fourier Transform (PFT) analysis is applied to the shadings image of a part to obtain its Generic Fourier Descriptor (GFD) indexes, while feature recognition is employed to obtain the manufacturing features of a part. The similarity of two parts can be defined using GFD index and feature information. This proposed approach can be applied to PDM systems in web-based environment to search parts with a particular shape and manufacturing feature, and to process the automatic version control by analyzing the differences in shape and manufacturing feature of different version parts.
Keywords: Polar Fourier transform, part search, Web-page, product data management 1. INTRODUCTION
Computer-aided design is an essential element in the modern design and manufacturing fields. Large–scale enterprises have utilized CAD system more than 30 years. Solid modeling system is a representation of a geometric model on the CAD system. Boundary representation (B-rep) is the main stream of a solid modeling system, where the representation of topologic and geometric entities is un-ambiguous and provides the detail descriptions of the design and manufacturing information.
A product may be mobile phone, portable computer, car, or even an airplane, and may range in quantity from several dozens to several millions. Because products change frequently and also the number of drawing files increases so quickly, the management and searching of the drawing file has become a significant task since enterprises adopted the CAD systems.
A well developed classification schema need to be established in order to manage the large number of drawing files. Group technology (GT) is an effective schema for capturing the design and manufacturing attributes of a part in an alphanumeric string, called a GT code. However, the GT code representation has some limitations, especially when the shape of the part is very complex, meaning that the manufacturing attributes cannot be easily retrieved.
As an increasing number of CAD models become available on the enterprise, designers can re-use existing drawing files, and extract design patterns from the web-based environment to modify as new parts in order to shorten the design cycle time and increase the competition of their products on the market. A designed part with a set of characteristics is generally given, and considered as a goal part. All parts are searched to retrieve similar designs from a drawing database and compare their similarity.
2. LITERATURE REVIEW
Elison [1] presented some relationships between attribute and application, and also indicated that some desirable properties such as function, shape, tolerance, material and manufacturing methods can measure the similarities in a different application area.
Typically the designer determines the appearances and sizes of the parts directly through the CAD system, and also determines the function attributes, and the manufacturing process. Therefore, the shape is the most representative information on the CAD model. If two parts have a high similarity, then the manufacturing processes, finite element analysis, and durability can be shared between them.
Computer-Aided Design & Applications, Vol. 3, Nos. 1-4, 2007, pp 117-125 118
The shape of a CAD model is divided into two aspects, namely the mathematical representation of point, curve and surface, and the topological relationships among the geometric entities. Although the information of material and tolerance may be included on the CAD model, most CAD system mainly record the solid model information.
Iyer[2] et al. surveyed the three-dimensional shape search, and categorized 3D shape searching techniques according to shape representations into the following classes: global-feature, manufacturing feature recognition, graph, histogram, product information, and 3D object recognition.
Some researchers have focused on the descriptions of shape descriptors [3][4][5][6][7][8]. These descriptors are broadly classified into two groups: namely contour-based and region-based shape descriptors. Contour-based shape descriptors include Fourier descriptor (FD). Because contour-based shape descriptors only employ boundary information, they cannot capture the interior content of a shape. Region-based techniques derive shape descriptors from all the pixel information within a shape region. The continuous and discrete 2-D Fourier transform of a shape image f(x,y)( 0≤x<M,0≤y<N)are given by Eqs. (1) and (2), respectively.
[
]
∫∫
×
−
+
=
x ydxdy
vy
ux
j
y
x
f
v
u
F
(
,
)
(
,
)
exp
2
π
(
)
(1)[
]
∑∑
− = − =+
−
×
=
1 0 1 0)
/
/
(
2
exp
)
,
(
)
,
(
M x N yN
vy
M
ux
j
y
x
f
v
u
F
π
(2)The u and v in Eq. (2) denote the uth and vth spatial frequency in the horizontal and vertical directions, respectively.
The FD should not be calculated directly from the image because of the variant problem of the translation and rotation. Usually, the original shape image in the polar space is first computed, and then transferred onto the rectangular polar image on the Cartesian space. Hence, the 2D FT is applied on this rectangular image, and the polar FT has a similar form to the normal 2D discrete FT in Cartesian space.
Cardone et al. [9] presented an algorithm to identify machined parts in a part database. They adopted reduced feature vectors to access shape similarity defining a distance function between two sets of reduced feature vectors to distinguish two similar parts.
The Google search engine has become the standard text-based search engine. Funkhouser et al. [10] presented a Web-based search engine system that supports queries based on 3D sketches, 2D sketches, 3D models and text keywords. For the shape-based queries, they developed a matching algorithm that adopts spherical harmonics to calculate discriminating similarity measures.
Recently some engineering shape benchmark are proposed by Doug et al. [11] and Jayanti et al.[12] and similarity comparison are proposed by Hong et al. [13].
This investigation develops a web-based architecture for processing 3D machined parts through an Internet and communicates with PDM systems in order to preserve the automatic version control of the parts.
3. PROPOSED APPROACH
3.1 Shape Representation and Similarity Criteria
Various shape representation and similarity criteria have their benefits and limitations. To handle real applications, similarity criteria should fulfill the following requirements:
a. The shape representation should be unique. b. Shape representation should be twisted invariant.
c. The relationship between the shape representation and similarity evaluation should be highly linear. d. The result of similar assessment should be symmetrical.
Computer-Aided Design & Applications, Vol. 3, Nos. 1-4, 2007, pp 117-125 119
3.2 Searching Target
The proposed searching algorithm should be able to retrieve the STEP (STandard Exchange of Product data model) file format from various CAD systems. As well as the STEP AP 203 file format, the proposed method also support the triangular mesh and native file (.prt) of the SpringSolid system. SpringSolid system was developed by the Solid Model Lab. at National Taiwan University.
Since STEP AP 203 only knows the information of manifold_solid_brep entity, which is the external shape of the part, feature recognition is first parsed and analyzed. Some information of manufacturing features can be obtained for further analysis.
3.3 Shape Representation
The main representation task can be divided into two parts, namely feature and shape. Figure 1 illustrates the analytic approach.
Fig. 1: Analytic approach.
This approach employs 2-D Polar Fourier Transform (PFT). The amplitude of PFT frequency is applied to evaluate the Generic Fourier Descriptor (GFD). The GFD index from the PFT algorithm can be adopted to describe the image contour.
Multiple views can be utilized to overcome problems resulting from the rotation effect of an object. Light field cameras are placed on 20 vertices of a regular dodecahedron. Twenty different views are obtained, distributed uniformly over a 3D model. The 20 views can roughly represent the shape of a 3D model as shown on Fig. 2. Two extra projection images from the negative Y axis(0, −1,0)and the negative X axis (−1,0,0) are provided to suit the behavior of CAD modeling. The ability to run the rendering shading is the essential capability of the CAD system, where Java3D is adopted for the graphic user interface.
The proposed approach focuses on the representative items of the manufacturing feature, including the feature type, feature quantity, approach direction, datum position and growing direction.
The feature profile and growing direction can be compared for the same type feature. Since the feature profile is 2D domain, it can use GFD rule to analyze the feature profile. Figure 4 depicts a flow chart of manufacturing feature comparison.
Computer-Aided Design & Applications, Vol. 3, Nos. 1-4, 2007, pp 117-125 120
Fig. 2: Light field cameras on 20 vertices of a regular dodecahedron.
Fig. 3: Feature profile. Fig. 4: Feature comparison.
3.4 Similarity Evaluation
The similarity comparison between two parts can be performed after completing the calculation of GFD and feature analysis,
The GFD descriptor is the frequency spectrum distribution of the discrete elements. A low frequency item can influence entire shape of the body, while a high frequency item can affect the detail of the contour.
To describe the shape, the acquired Fourier coefficients must normalize, so that their rotation, scaling and start points are independent of shape descriptors. The similarity between the query shape Q and a target shape T is derived from the Euclidean distance d between their GFDs:
2 / 1 2 / 1 2
⎟
⎠
⎞
⎜
⎝
⎛
−
=
∑
= N i T i Q iGFD
GFD
d
(3)
Computer-Aided Design & Applications, Vol. 3, Nos. 1-4, 2007, pp 117-125 121
where N denotes the number of discrete points.
The high-frequency coefficients strongly affect the contour, while the low frequency coefficients have little effects on it. The modified Euclidean distance d between their GFDs proposed in this schema is givcn by
2 / 1 2 / 1 2
⎟
⎠
⎞
⎜
⎝
⎛
−
×
=
∑
= T i N i T i Q iGFD
GFD
GFD
d
(4)
Fig. 5 illustrates the flow chart of shape comparison.
Fig. 5: Flow chart of shape comparison.
4. SYSTEM IMPLEMENTATION
The proposed algorithm is written in Java, with Swing for the graphic user interface, Java 3D for displaying 3D graphic shape representations and a Microsoft SQL Server database to store the necessary information.
4.1 System Architecture
To search the similarity part in PDM system [14], a Thick Server-Thin Client is applied for the system architecture, which is divided into three sections, web-page interface, server with computational kernel and database, as illustrated in Fig. 6.
A web-page user interface is adopted to access and retrieve the drawing files, view the 3D graphic representations and display the sorted results.
Shape and feature retrieval and evaluation to calculate the GFD index is the kernel of the proposed approach. To lower the burden of the user interface, this high heavy calculation is separated from the graphical user interface. After reading the STEP file, the proposed approach first executes the feature recognition, and reconstructs and splits the advanced face, and finally transfers the triangular mesh to a web-page interface in order to display the 3D object.
The calculation kernel has two elements, the GFD server manager and the PDM server. The GFD server manager can create the corresponding GFD computing server, which can analyze 3D models and calculate the GFD index. The tasks of the PDM server include the management of drawing, evaluation of similarity and data transfer. GFD calculation is then performed with the image of the shape and feature profile in the GFD Computing server. Hence, the value of GFD for the body shape and feature profile can be obtained and passed to the PDM server. The similarity evaluation can then be started in PDM server by comparing this GFD index with the GFD index stored on the database. For the graphic user interface, it receives the original data file and returns back for displaying the triangular mesh and manufacturing feature information, and stores the necessary information to the database.
The database is employed to store all information on the processes, including the native file, image of shape, image of feature profile, manufacturing features, and results of GFD index. Figure 7 illustrates all data tables.
Computer-Aided Design & Applications, Vol. 3, Nos. 1-4, 2007, pp 117-125 122
Fig. 6: System architecture of proposed algorithm.
Computer-Aided Design & Applications, Vol. 3, Nos. 1-4, 2007, pp 117-125 123
4.2 Similarity Searching Program
The main window of PDM system is shown in Fig. 8. Part files and 3D drawings are managed and displayed in the PDM system. To search for a similarity part in this system, a part file must be chosen first, then pressing the part search button, and the similarity searching program for this part will be activated.
Figure 9 illustrates the graphical user interface for the part search in the PDM system. The Java 3D viewer and setting option is shown on the left, while the part information and searching result is shown on the right of the figure. The target object is also shown on the left top of the figure.
After the file is opened, the part has individual handling process. The part can be viewed and rotated through the 3D visualization. While reading the file, system can parse and recognize all the characteristic features using feature-recognition parser. The manufacturing features and native file are then transmitted to the database management system.
The shape of manufacturing feature can be chosen for comparison according to the type of file. If the shape image is chosen, then the system can automatically rotate the part, and establish the projection image at various view directions. After obtaining the projection image, the system then continues to derive the GFD index by the PFT rule, and compares the target GFD index with that on the database. Finally, the system sequentially sorts the comparing result. The user can click and select part to view or download for reference.
If a user chooses to compare a manufacturing feature, for example general-boss, then the system can compare the feature profile of the general-boss, and sort the comparing results. If the target parts have multiple features, then the system can compare the feature sequentially. Target part has three manufacturing features, and the searching result is also illustrated in Fig. 10.
Computer-Aided Design & Applications, Vol. 3, Nos. 1-4, 2007, pp 117-125 124
Fig. 9: Searching result of shape representation with GFD index = 100.
Fig. 10: Searching result of multiple feature representation.
5. CONCLUSION AND FUTURE WORK
The proposed method can handle the file format of Spring Solid Part, STEP AP203 and triangular mesh, and can utilize the GFD descriptor to measure the similarity of the shape and manufacturing features in the PDM system. The proposed method can be run on a standalone platform or in a web-based environment. The proposed method has the following features:
Computer-Aided Design & Applications, Vol. 3, Nos. 1-4, 2007, pp 117-125 125
a. Given a target part with characteristic attributes, the method can be applied to search for similar parts in the database based on the shape or manufacturing feature, and sort the result in order of similarity.
b. The user can download the candidate part from the database. Future work may include the following directions:
a. The proposed algorithm for the similarity evaluation adopts the PFT method, which is a discrete Fourier transform method with a long computation time. Fast Fourier transform can be applied in order to reduce computational time. b. The manufacturing feature set is very limited. The range of manufacturing features could be expanded.
6. ACKNOWLEDGEMENT
The authors would like to thank the National Science Council of the Republic of China, Taiwan for financially supporting the research under Contract No. NSC 95-2221-E-002-136.
7. REFERENCES
[1] Elison, A.; Nau, D.; Regli, S.; William, C.: Feature-based similarity assessment of solid models, Proc ACM Solid Modeling Conference, 1997, 297-310.
[2] Iyer, N.; Jayanti, S.; Lou, K.; Kalyanaraman, Y.; Ramani, K.: Three-dimensional shape searching: state-of-the art review and feature trend, Computer-Aided Design, 37, 2005, 509-530.
[3] Berchtold, S.; Keim, D. A.; Kriegel, H-P.: Using extended feature objects for partial similarity retrieval, The VLDB Journal, 1997, 333-348.
[4] Chen, D.-Y.; Tian, X.-P.; Shen, Y.-T.; Ouhyoung, M.: On visual similarity based 3D model retrieval, EUROGRAPHICS, 22(3), 2003.
[5] Zhang, D.; Lu, G.: Content-based shape retrieval using different shape descriptors: A comparative study, In
Proc. of IEEE International Conference on Multimedia and Expo (ICME2001), Tokyo, Japan, August 22-25, 2001, 317-320.
[6] Zhang, D.; Lu, G.: Improving retrieval performance of Zernike moment descriptor on affined shapes, In Proc. of
IEEE International Conference on Multimedia and Expo (ICME2002), Lausanne, Switzerland, August 26-29, 1, 2002, 205-208.
[7] Zhang, D.; Lu, G.: Shape based image retrieval using generic Fourier descriptors, Signal Processing: Image
Communication, 17(10), 2002, 825-848.
[8] Zhang, D.; Lu, G.: A comparative study of curvature scale space and Fourier descriptors, Journal of Visual
Communication and Image Representation, R 14 (1), 2003, 41-60.
[9] Cardone, A.; Gupta, S. K.; Deshmukh, A.; Karmik, M.: Machining feature-based similarity assessment algorithms for prismatic machined parts, Computer Aided Design, 38, 2006, 954-972.
[10] Funkhouser, T.; Min, P.; Kazhdan, M.; Chen, J.: A search engine for 3D Models, ACM Transactions on Graphics, 22(1), 2003, 83-205.
[11] Doug, E. R.; Clark, J.; Coney, R.; Mill, F.; Rea, H. J.; Sherlock, A.; Taylor, N. K.: Benchmarking shape signatures against human perceptions of geometric similarity, Computer-Aided Design, 37, 2006, 1038-1051. [12] Jayanti, S.; Kalyanaraman, Y.; Iyer, N.; Ramani, K.: Developing an engineering shape benchmark of CAD
models, Computer Aided Design, 38, 2006, 939-953.
[13] Hong, T.; Lee, K.; Kim, S.: Similarity comparison of mechanical parts to reuse existing design, Computer Aided Design, 38, 2006, 973-984.
[14] You, C. F.; Chao, S. N.; Multilayer architecture in collaborative environment, Concurrent Engineering: Research and Applications, 14(4), 2006, 273-281.